
Statistics on payments and securities trading, clearing and settlement– data for 2007 –
Today the European Central Bank (ECB) will publish statistics on payments and securities trading, clearing and settlement in 2007. These statistics cover all of the countries in the European Union (EU). Several key indicators, outlining trends in both the EU and the euro area, are presented below.
Payment instruments
The statistics on payments include data on: the public’s use of payment instruments in terms of the volume (number) and value of transactions; the number of cards and payment devices used; the institutions providing payment instruments; and transactions between payment providers.
The 2007 data on payment instruments reflect the fact that the system for reporting payment statistics in Germany has been enhanced. As a consequence, the 2007 data for Germany, the euro area and the EU are not directly comparable with the data reported in previous years. Methodological improvements have also been made to the data for France, affecting the data for 2005 and onwards, which raises similar issues. Therefore, in order to facilitate comparisons over time, the impact of these improvements has been estimated for the periods prior to the improvements (see Chart 1). [1]
Chart 1 illustrates the steady increase in the use of cashless payment instruments in the EU over the past seven years. The number of cashless payment transactions (by non-monetary financial institutions) in the EU rose by an average of 7% per annum between 2000 and 2007, while the value of these transactions rose by 6% per annum.
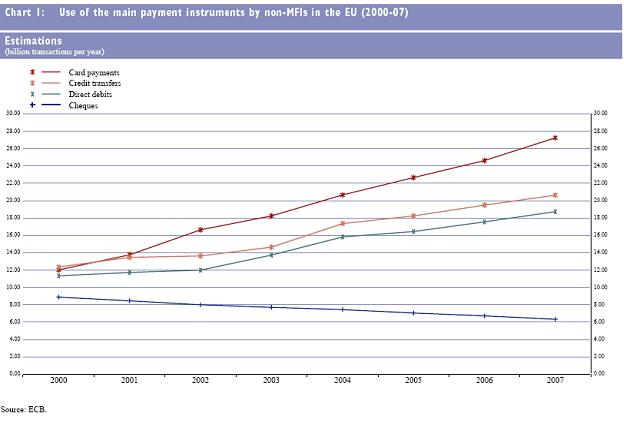
Moreover, the use of cards and direct debits also increased steadily between 2000 and 2007, at average annual rates of 12% and 8% respectively. Over the same period the use of credit transfers rose at an average rate of 8% per annum.
On the other hand, the use of cheques showed a continuous decline, falling at an average rate of around 5% per annum. There was steady growth in the number of e-money transactions (not shown in Chart 1), but these still only accounted for 0.6% of all cashless transactions in 2007.
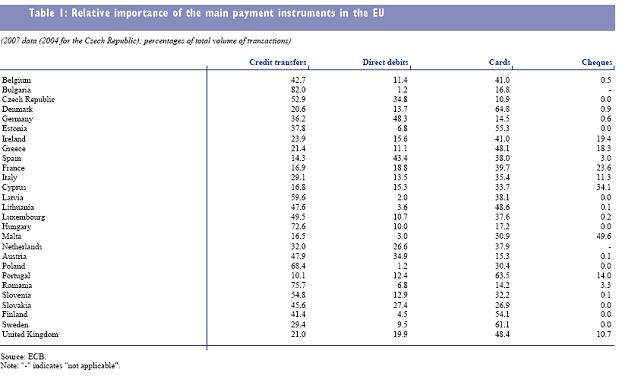
In 2007 cards were the most popular form of cashless payment instrument in the EU, accounting for 36.9% of the total volume of transactions, which reached 73.8 billion in that year. The shares of credit transfers and direct debits were similar, at around 27% each. Cheques, e-money transactions and other cashless payment instruments accounted for less than 10% of the total volume of transactions.
The relative importance of the main cashless payment instruments for each EU country is shown in Table 1.
Retail payment systems
In 2007 there were 14 retail payment systems operating in the euro area, serving a total population of 320 million. In that year these systems processed 25.5 billion transactions, with a total value of €17.2 trillion. This compares with a transaction volume of 24.7 billion at a total value of €16.7 trillion in 2006.
In the EU as a whole, there were 39 [2] retail payment systems in 2007, serving a total population of 495 million. These systems processed 36.4 billion transactions in that year, with a total value of €28.9 trillion, compared with 34.8 billion transactions at a total value of €26.5 trillion in 2006.
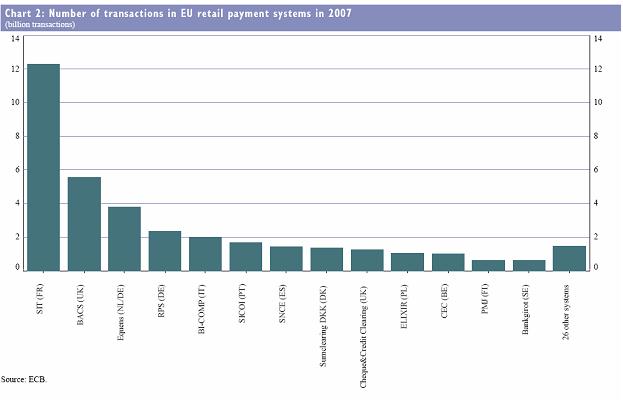
There is a notable degree of concentration, in terms of the transactions processed, in the retail payment systems of the EU. In 2007 the largest system accounted for just over a third (12.3 billion) of all transactions in the EU, while the five largest systems together processed over 70% (26 billion) of the total volume of transactions in the EU.
Between 2000 and 2007 the average annual growth in the volume of transactions processed by EU retail payment systems was 4.7%. The large increase in transaction volumes in 2004 (see Chart 3) reflects the inclusion of the transactions taking place in the ten Member States which joined the EU in that year.
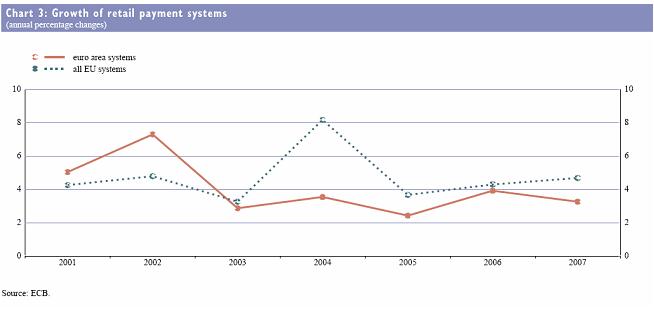 Over the same period the average growth in the volume of transactions processed by retail payment systems in the euro area was 4.0% per annum.
The value of transactions processed by EU retail payment systems also grew between 2000 and 2007, at an average rate of 5.0% per annum, while the euro area showed a corresponding growth rate of 3.7%.
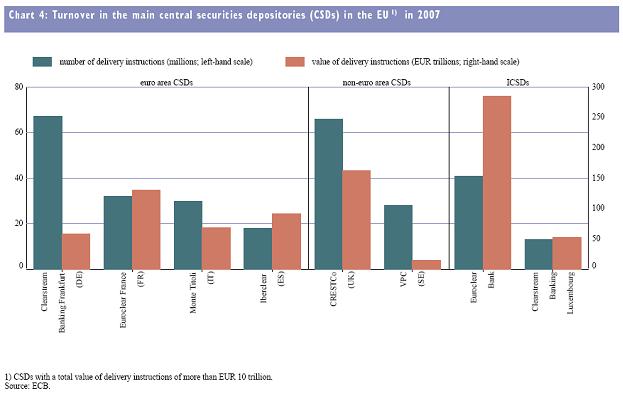
Central securities depositories
There are 36 central securities depositories (CSDs) currently operating in the EU, of which 19 are located in the euro area.
In 2007 355 million delivery instructions were processed by CSDs in the EU, with a total value of €893 trillion. Compared with 2006, this represents an increase of 14.1% in terms of volume and an increase of 19.9% in terms of value.
In addition, there is a notable degree of concentration in terms of the value of the delivery instructions processed, with the five largest CSDs accounting for 83% of the total value of the delivery instructions processed in the market. There is less concentration in terms of volume, with the five largest CSDs representing 66% of the total volume of delivery instructions processed in the market.
Additional information
This press release contains only a small sub-set of the payment and settlement statistics regularly compiled by the ECB. The full set of statistics can be downloaded from the Statistical Data Warehouse (SDW) on the ECB’s website at http://sdw.ecb.europa.eu/. These statistics were formerly published in an addendum to the ECB publication entitled “Payment and securities settlement systems in the European Union”, also known as the “Blue Book”. As the relevant data are now readily accessible in the SDW, the hard copy publication of the Blue Book Addendum has been discontinued. In its “Reports” section, the SDW also contains pre-formatted tables on payment statistics for the last five years, in which the data are presented in the same format as in the former Blue Book Addendum.
Payment statistics cover the period 2000-07. Statistics on securities trading, clearing and settlement have been expanded following the enhancement of their methodology. In general, the current methodology applies to statistics on securities settlement systems since 2005, and to statistics on central counterparties (i.e. securities clearing) and stock exchanges (i.e. securities trading) since 2006. For further methodological information, see the “Statistics” section of the ECB’s website at http://www.ecb.europa.eu/stats/payments/html/index.en.html.
-
[1] The data, as they were originally reported, are also available in the ECB Statistical Data Warehouse (SDW), as both tables (http://sdw.ecb.europa.eu/reports.do?node=100000138) and series (http://sdw.ecb.europa.eu/browse.do?node=3447413). Further information on the features of national data can be obtained from the compilation of notes on payment statistics (http://www.ecb.europa.eu/stats/pdf/paymentstatistics_notes_discrepancies.pdf?35ebdbcf571c6c6838aa7ed1241d25f4).
-
[2] Including the two pan-European retail payment systems: STEP2 XCT Service and STEP2 ICT Service.
Europese Centrale Bank
Directoraat-generaal Communicatie
- Sonnemannstrasse 20
- 60314 Frankfurt am Main, Duitsland
- +49 69 1344 7455
- media@ecb.europa.eu
Reproductie is alleen toegestaan met bronvermelding.
Contactpersonen voor de media