
The monetary pillar of the ECB
Speech by Otmar Issing, Member of the Executive Board of the ECB“The ECB and Its Watchers VII” Conference3 June 2005
Today’s conference “The ECB and Its Watchers” is the seventh of its kind. I would like to thank the organisers for this outstanding opportunity to communicate and maintain an open dialogue with market participants, academics and journalists. For the ECB, this open dialogue has not always been a bed of roses. To avoid any misunderstanding: we at the ECB – and I personally – have benefited considerably from this regular exchange of views, and I would not have wanted to miss this opportunity or the many other opportunities.
Especially in the early days, we were confronted with substantial criticism. Our two-pillar monetary strategy, in particular, came under fire from many sides. Critical central bank watchers at these conferences and beyond, argued that the monetary pillar did not provide any useful information for our monetary policy decisions, and was therefore superfluous. They felt it would be an obstacle to transparency and clear communication with the public. While, with time, our monetary policy has increasingly been seen in a more positive light, recent experience – where a high growth rate of M3 has not prompted an interest rate increase – is sometimes seen as further evidence of the superfluous, even confusing, role of the monetary pillar. It comes as no surprise therefore when outside commentators advise us to abandon the monetary pillar or “merge” it with the economic analysis.
In my presentation today, I would like to address this type of criticism. First, I will explain why we rely – and will continue to rely – on the monetary pillar of our strategy. I will then present the tools which we have developed in our monetary analysis to extract inflationary signals from monetary developments. Finally, I will illustrate how we communicate the results of the monetary analysis to the public to explain our monetary policy decisions.
The key messages I would like to convey today are as follows:
After 6½ years the success of the ECB’s monetary policy is beyond dispute. We have delivered on our mandate: price stability for the euro area. Medium to long-term inflation expectations have been firmly anchored at healthy levels.
This success, which few expected seven years ago when the ECB was created, is founded on the two-pillar strategy.[1] A thorough analysis of monetary developments has played a key role in this. The monetary pillar has been essential for the medium-term orientation of our monetary policy.
Over time, the continuous deepening and broadening of our monetary analysis has enabled us to cope with different developments. The main challenge for monetary analysis remains the real-time extraction of signals of medium-term inflationary or deflationary pressures from monetary developments. In recent years, this task has become particularly important, but also more challenging, as sizeable shifts in money demand resulted in some signs of instability in traditional relationships between money, output and prices. We have been successful in disentangling, in real time, money demand shocks and noise in monetary developments from the relevant underlying trends. The information provided by the monetary analysis has been consistent over time, helping to overcome the limited reliability of other indicators, such as the output gap, and the unavoidable limitations of economic analyses, such as macroeconomic projections.
As we made clear from the outset, our approach is not a kind of dogmatism; it demonstrates a constant reflection, learning and practical validation.
Cross-checking the information from the economic and monetary pillars has enhanced the robustness of our monetary policy. The indicator role of money has been a guiding element of our assessment in a situation of continued economic and financial uncertainty.
We have consistently communicated the role of the monetary pillar and any uncertainty related to monetary developments to market participants, other external experts and the general public. The high predictability of our decisions suggests that we have been able to successfully explain our policy in a transparent way.
All in all, our experience with the two-pillar strategy is unambiguously positive. Importantly, it also adds to the renewed role assigned to money in economic research and the revival of interest in money and its counterparts by other central banks in the context of recent asset price developments. It should be obvious therefore that the burden of proof is indeed on the side of those who suggest that we should neglect the information stemming from monetary analysis.
The role of money for monetary policy
There are a number of empirical and theoretical arguments for giving money an important role in monetary policy. The long-term relationship between money and prices reflects what many economists would consider one of the fundamental relationships in economics. A sustained increase in money growth in excess of what is needed to finance transactions in the economy at constant prices will ultimately be associated with inflation. Equally, prolonged and substantial deflation is accompanied by monetary contraction. The link between money growth and inflation – one of the most robust empirical findings in economics – has again recently been confirmed, also for the euro area. Empirical evidence suggests that the link between money and inflation is more prominent at the medium to longer-term horizon.[2]
The association between money and prices over the medium term suggests that money may be a natural indicator for future inflationary pressures. The empirical properties of money as a leading indicator for inflation are more favourable in the euro area than in other countries/areas and are well-documented. The results vary across monetary aggregates, since money holdings may be held for different transaction or savings motives and allow for different substitution effects.[3] Based on this work, the broad monetary aggregate M3 seems to have predictive power for inflationary pressures at horizons longer than those contained in other real and financial indicators.[4]
In addition, money may have an indicator role to complement or replace other economic variables measured with delay or uncertainty. The availability of euro area statistics is improving, making the timeliness of data less problematic. But this does not resolve the continuous real-time uncertainty associated with economic measures such as the output gap or the natural real interest rate. It has been argued that mis-measurement of the output gap in real time has contributed to misguided economic policy decisions in some countries in the past[5] and that monetary aggregates may be a helpful indicator of the state of the economy.[6]
Moreover, historical experience has shown that an analysis of money and credit developments can provide information in advance of a build-up of asset price overvaluations. Historically, many episodes of asset price “bubbles” have tended to be either accompanied or preceded by strong money and credit dynamics.[7] This holds, in particular, for booms which, at some point, ended in a collapse of asset prices which had a major and lasting negative impact on the financial sector, the real economy and thereby also on price developments. Monitoring money and credit aggregates can therefore help us to identify the build-up of financial imbalances and, in conjunction with the developments in asset prices and nominal spending, may help monetary policy to avoid such instabilities, even in cases in which developments in the prices of goods and services appeared to be benign.[8] Giving a role to money and credit can therefore reduce the risk of monetary policy accommodating an asset price bubble which could possibly undermine price stability over rather long horizons. In this sense, the monetary pillar can help to overcome certain limitations of strict inflation targeting.[9]
Economic research had, for several years, neglected money as a major building block to understanding monetary policy. More recently, however, a number of studies have put money back into monetary policy.[10] Theoretical research has helped to rationalise the signalling or indicator role of money and underscored its usefulness for guiding monetary policy decision-making. It has been argued, for instance, that money may play a role as a proxy for a broad range of yields and asset prices that may otherwise be difficult to observe. The money stock then provides additional information about determinants of aggregate demand not apparent in directly observable interest rates.[11] When the economy is subject to different demand and supply shocks, money may also help the central bank to better identify the type of shocks affecting the economy by providing a clearer and more discriminating picture of the source of the shock. This allows central banks to better infer the appropriate path of the policy interest rate. Assigning a role to a broad monetary aggregate in a central bank’s analysis is conducive to better economic performance.[12]
In addition, weaknesses of simple feedback rules only focusing on inflation and output have been uncovered.[13] Such rules do not deliver a unique and determinate solution to the policy problem of how to keep macroeconomic magnitudes safely anchored to the policy objective. Monitoring monetary developments can provide one nominal anchor, among others, overcoming the possible instability of simple feedback mechanisms.[14]
In practice, most central banks monitor and analyse monetary aggregates and their components and counterparts, and report on developments. The weight they assign to this analysis in their policy, however, varies widely, and may change over time. More recently some central banks seem to have again placed greater emphasis on the analysis of money and credit aggregates in the context of real estate and asset price fluctuations.[15] What role money effectively plays as an element of a central bank’s overall assessment of the economy depends on a) the concrete monetary policy strategy of a central bank, and b) how the central bank pursues and communicates this strategy in view of the empirical performance of monetary aggregates and their counterparts. Whatever the approach taken in pursuing the objective of price stability, no central bank can afford to exclude such information from its overall assessment. Relevant information should be given the appropriate weight in the structure of the monetary policy decision-making process. The assessment of risks to price stability, which can be extracted from monetary developments, must not be neglected in policy decisions. For the ECB, the existence of a monetary pillar ensures that money is given its appropriate weight. As long as monetary aggregates and economic developments cannot be modelled in a robust, fully integrated way, it seems preferable to maintain the complementary perspectives on the working of the economy as a whole in the form of two pillars.
The decision to create a monetary pillar took into account the above considerations as well as the evidence of a long-term relationship between monetary aggregates and prices and the leading indicator role of money for the euro area. In line with the argument of a closer relationship between money and inflation at lower frequencies, the function ascribed to the monetary pillar is to reveal medium-term risks to price stability underpinning the medium-term orientation of the monetary policy strategy. Moreover, the Governing Council announced a reference value for the growth rate of M3 compatible with the objective of price stability based on the evidence of long-term money demand stability. However, as already made public in October 1998, there is no mechanical monetary policy reaction to deviations of M3 growth from the reference value and the reference value clearly does not constitute a monetary target. The strategy was thoroughly scrutinised and evaluated in 2003 after some years of experience. As a result of this exercise, the role of the monetary pillar was confirmed. Cross-checking the indications from the economic analysis with the information from the monetary pillar was emphasised as a crucial element underpinning the robustness and medium-term policy orientation.[16]
Real-time monetary analysis
For central bankers the key question is always: how can we translate the principles of a strategy and developments we observe into practical policy advice in real time. The main challenge for monetary analysis as a tool for monetary policy lies in the successful real-time extraction of those fundamental signals from monetary developments that are linked to future price developments. The separation of these fundamental signals from noise is often possible ex post with relatively simple tools and models. In real time, this separation poses considerable challenges and requires a permanent refinement of the analysis. It requires a continuous monitoring of the long-term relationship between money and prices and the leading indicator properties of money. As we have experienced recently, standard money demand relationships may show signs of instability due to temporary or permanent changes in the behaviour of the money holding sector. The ECB’s monetary analysis therefore employs a wide range of tools – a combination of model-based and institutional analyses – to carry out this real-time assessment.
Rather than unpacking the toolbox[17] and describing each individual tool here in an abstract way, let me briefly give you an example of how the signals contained in monetary developments regarding future inflationary trends have been extracted recently. The past four years have been particularly challenging for the ECB’s monetary pillar because the very rapid expansion of M3 that we observed cannot be easily explained in terms of the traditional determinants of monetary developments.
From 2001 to 2003, annual growth of M3 was well above the reference value and the strong upward dynamics in this broad monetary aggregate could only partly be explained by developments in the traditional determinants of money demand, such as output, prices and interest rates. A deep and broad analysis of components and counterparts of M3, capital market flows and the global liquidity situation was needed to single out signals from noise in real time. Based on this analysis, the ECB identified extraordinary portfolio shifts into M3 – due to heightened economic and financial uncertainty in the aftermath of declining stock prices in 2001 and the terrorist attacks of 9/11 – as the main driver behind the strong monetary dynamics. This implied modest medium-term risks to price stability.
To quantify this assessment, an M3 series corrected for the estimated impact of portfolio shifts was constructed. When analysed in parallel with the official M3 series, this enabled us to derive two scenarios for assessing inflationary risks. The modal scenario was derived from the input of M3 corrected into the simple models that help us forecast inflation on the basis of monetary information. By contrast, the input of official M3 time series into the same models resulted in higher inflation forecasts reflecting, by difference, further possible upward risks to price stability.
The assessment of modest medium-term risks to price stability stemming from the monetary analysis changed in the second half of 2004, when broad money growth accelerated. This acceleration has been judged to be of a different quality to that observed between 2001 and 2003, as monetary dynamics have strengthened in parallel with increasing demand for loans to the private sector and, importantly, high M3 growth has been driven by its most liquid components, pointing to a significant impact of the low level of interest rates on monetary dynamics. At the same time, financial market uncertainties had been considerably lower than between 2001 and 2003. This has led to a convergence of M3 and M3 corrected for the estimated impact of portfolio shifts. In such an environment, the likelihood that strong monetary developments find their way through to higher prices is considerably higher.[18]
However, given that the signals from the two pillars pointed in different directions, the stability of policy rates cannot be taken as an indication that the Governing Council disregarded the ample liquidity situation. The ample liquidity signalled from the monetary analysis was a medium-term factor weighting against a further lowering of interest rates at that stage.
For a detailed analysis of the above issues, see the Annex to this paper.
An answer to the question of the relevance of the monetary pillar for monetary policy cannot be found by looking at the simple correlation of broad monetary aggregates with policy rates. Indeed, the information on the signals for medium-term risks to price stability is the result of a much broader monetary analysis than a simple glance at headline M3 could reveal. In addition, expecting any proof from simple correlations overlooks the crucial role of cross-checking. It is the combination of economic and monetary analysis which drives monetary policy decisions.
Conclusion
To sum up, the experience of the first 6½ years, together with theoretical and empirical findings, leads us to a number of straightforward conclusions:
In its assessment and policy considerations, a central bank cannot ignore the information from monetary developments.
To analyse developments of money and credit, the ECB has broadened and deepened its tools.
By cross-checking the available information, the two-pillar approach guarantees the medium-term orientation of the ECB’s monetary policy.
It has certainly been a learning process and the outcome of a lot of efforts invested in that area. In this sense, you can also think of the monetary pillar as the institutionalised promise of what the ECB will continue to do in the future; cultivating, as far as possible, an approach to central banking geared towards constant learning and encompassing all available information relevant for monetary policy.
Annex : Experience in real-time monetary analysis between 2001 and early 2005
From 2001 to 2003: distorted signals from money for risks to price stability
Over the past four years, we have come to experience the complexity and challenges of using money as a policy signal. Indeed, as early as 2001, annual money growth was well above the reference value, and a sequence of positive shocks in traditional money demand models could be observed. In other words, to a significant extent, the strong upward dynamics in money growth could not be explained by developments in the traditional determinants, such as output, prices and interest rates. This raised a number of fundamental questions that had to be addressed in real time, for example:
Are the strong increases in money part of a fundamental signal pointing to risks to price stability, or do they reflect a temporary phenomenon which is not relevant for monetary policy?
Would a continuation of the sequence of positive shocks to money demand point to a permanent change in the money demand behaviour of economic agents, i.e. a structurally higher liquidity preference and, hence, an increase in the direct level of money holdings?
Should we interpret signs of instabilities in specific econometric money demand models as structural changes?
Or could the same empirical observation be a corollary of the build-up of imbalances pointing towards risks to future price stability?
It is not possible to give a satisfactory answer to such questions by means of statistical or econometric inference in real time on the basis of the M3 time series itself. A derivation of a useful policy signal under these circumstances thus requires a broad and deep analysis that enables us to single out the relevant signal. The ECB has carried out such an analysis based on a thorough examination of the components and counterparts of M3 and international capital flows, financial market situations and global liquidity situations.[19] Some of the key questions raised and answers provided by the monetary analysis in this context have been as follows:
1) Which components of M3 showed strong dynamics between 2001 and 2003?
Answer: the increase in monetary dynamics from 2001 to early 2003 had been driven to a significant extent by increases in money market fund shares/units that are often used to “park” money in times of high uncertainty.
2) Which counterparts of M3 have contributed to strong M3 dynamics?
Answer: an important driver of monetary developments from the counterparts of M3 has been the net purchase of non-monetary securities rather than money creation via credit. The analysis of the net external position of euro area monetary financial institutions and their further breakdown in the monetary presentation of the balance of payments revealed that, in particular, the repatriation of equity capital from abroad has influenced this development. Non-euro area residents have therefore been an important counterpart for strong monetary dynamics.
3) Is there model-based evidence for a shock to monetary developments driven by stock market developments?
Answer: simple structural models that include stock market variables hint at a significant “liquidity preference shock”, e.g. a shock that affects the level of money and the level of the stock market index in an adverse way.[20]
Of course, the imbalances and strong signals provided by the exceptional monetary developments of 2001 to 2003 may have been driven by a combination of various reasons. The ECB has consistently followed up on an analysis originally pursued in real time which has helped to isolate the relevant signal in monetary dynamics for the inflationary outlook.
Spring 2001 marked the start of extraordinary portfolio shifts into M3, as the combination of declining equity prices and worsening economic conditions led to a rise in the demand for safe and liquid monetary assets. This process received a significant additional impetus in the aftermath of the terrorist attacks of 11 September 2001, which led to a considerable further rise in financial, economic and geopolitical uncertainty.
In order to assess and quantify this analysis, an M3 series corrected for the estimated impact of portfolio shifts was constructed. When assessed in parallel with the official M3 series, it enabled us to better express uncertainties related to monetary developments. More specifically, the analysis of both time series enabled us to derive two scenarios for assessing inflationary risks:
The modal scenario could be derived using M3 corrected as an input into simple monetary models that forecast inflation, for example simple leading indicator models based on monetary growth indicators or P-star models based on measures of the money gap.
The second scenario, reflecting possible upward risks to price stability as compared to the modal view, could be derived by using the official M3 series and by applying the tools referred to earlier.
In order to visualise this point, we should compare the real-time forecast for annualised HICP inflation forecasts over six quarters from a simple forecast model as described in Nicoletti-Altimari (2001) with the corresponding realised inflation rates over the same horizon. Figure 1 makes this comparison for those forecasts from 2001 onwards, for which realised inflation is currently available. It is clear that official M3 developments have not been a reliable guide to price developments over this period, given the magnitude of portfolio shifts. Most importantly, the figure shows that a thorough monetary analysis – using the series of M3 corrected as derived in real time – has produced a useful insight into inflation dynamics by offering close to unbiased inflation forecasts. In this respect, it is important to note that the estimates of the corrections to M3 have remained relatively consistent during the last few years, which is a key issue for deriving reliable monetary policy messages in real time.
The ECB’s Governing Council took this real-time assessment of the monetary pillar into account and communicated from October 2001 onwards its assessment of the accelerated monetary growth in view of portfolio shifts:
“… a number of temporary factors play an important role in explaining recent monetary developments. Notably the uncertainty in stock markets and the relatively flat yield curve until August have led to portfolio shifts... For these reasons, we do not judge that monetary developments signal risks to price stability at this juncture.”[21]
As early as February 2002, the Governing Council indicated that this assessment might have to be revised if there was further evidence of a recovery in the euro area economy. In autumn 2002 it became apparent that the expected economic recovery would not materialise quickly. When cross-checking this information with the monetary pillar, the Council considered that, in view of the temporary factors boosting monetary growth and the expected unwinding for portfolio shifts, monetary developments did not pose a risk to price stability, and decided on lower interest rates. This was expressed, among others, by the ECB’s President in the Introductory Statement of March 2003:
“The continued strong monetary growth reflects an ongoing pronounced preference for liquidity in an environment of high financial, economic and geopolitical uncertainty. Although liquidity remains ample, it is not expected at this stage to give rise to inflationary pressures, given the current economic context and the expectation that some of the portfolio shifts will be reversed once the financial market uncertainty diminishes.”
The subsequent period of stable interest rates was characterised by countervailing economic and monetary developments. Signs of a moderate pick-up of economic developments emerged during the second half of 2003 and strengthened in early 2004. Short-term inflation volatility, due to exogenous shocks and the decelerating growth of the broad monetary aggregate, did not suggest any clear medium-term inflationary pressure. However, the Governing Council also made reference to the low level of interest rates as a factor driving monetary growth, increases in loans to the private sector and uncertainty about the pace at which portfolio shifts would unwind.[22]
The second half of 2004 and early 2005: change in the quality of money growth
The assessment of modest medium-term risks to inflation stemming from the monetary analysis changed in the second half of 2004, when broad money growth accelerated. This acceleration, though less pronounced, has been judged to be of a different quality to that observed between 2001 and 2003. Indeed, since the second half of 2004, monetary dynamics have strengthened in parallel with increasing demand for loans to the private sector. On the component side, high M3 growth has been driven by high growth in the most liquid components of M3. By contrast, financial market uncertainties have been considerably lower than between 2001 and 2003. Stock market indices have recovered from their lows in 2003, leading to a convergence of the growth of M3 and M3 corrected for the estimated impact of portfolio shifts. In such an environment, the likelihood of strong monetary developments, largely driven by the low level of interest rates all along the maturity spectrum, finding their way through to higher prices is considerably higher. For example, it remains likely that part of strong monetary dynamics is part of a fundamental signal that hints at risks to future price stability. In addition, the Governing Council pointed to the possible impact of strong monetary and credit growth on asset prices.[23]
These increased risks to price stability can be visualised by a simple candle chart showing the ranges of real-time inflation forecasts from simple leading indicator models six quarters ahead using a number of monetary variables, as shown in Figure 3.[24] This figure shows the range of the respective real-time inflation forecasts (with the minimum and maximum forecasts derived using the various indicator models) together with the median of the forecasts for each of the last seven quarters. These real-time forecasts show that the median and the minimum of the inflation forecasts have been above 2% throughout 2004.
Moreover, the breadth of the range of forecasts was considerably smaller in 2004 than in 2003. This narrowing of the range reflects the convergence of developments in monetary and loan growth and the recent co-movements of the growth in M3 and M3 corrected for the estimated impact of portfolio shifts. This assessment was further confirmed when looking at money gaps derived for headline M3 and M3 corrected for the estimated impact of portfolio shifts (see Figure 2). Despite the large uncertainties prevailing – as expressed by the large differences in the level of the estimated money gap – the estimated nominal and real money gaps based on M3 and for M3 corrected showed upward movements during 2004. Thus, there was no ambiguity in terms of the risks of monetary developments to price stability. As a result, the Governing Council stressed its concern at these developments more forcefully from mid-2004 onwards. With more cloudy economic indicators emerging towards the end of 2004, it was noticed that these risks might not materialise, but continued to warrant vigilance. As the Introductory Statement of November 2004 concluded:
“To sum up, the economic analysis suggests that underlying inflationary pressures are still contained, but a number of medium-term upside risks to price stability need to be monitored closely. It is particularly important that these do not affect long-term inflation expectations. Cross-checking with the monetary analysis continues to support the case for strong vigilance with regard to the materialisation of risks to price stability.”
The stability of policy rates does not therefore indicate that the Council disregarded the ample liquidity situation. The ample liquidity signalled from the monetary analysis was a medium-term factor weighting against a further lowering of interest rates at that stage.
Figure 1
Real-time forecasts of inflation using M3 and M3 corrected for the estimated impact of portfolio shifts in a simple bivariate leading indicator model* (annualised inflation over the next six quarters)
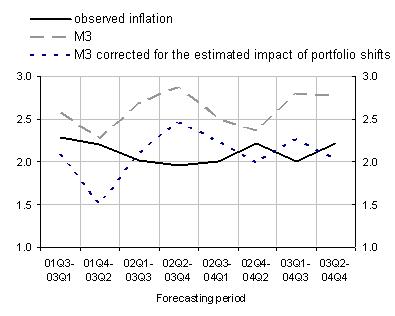 |
* see Nicoletti-Altimari (2001) for details.
Measures of the real and nominal money gaps
(as a percentage of the respective stock of M3; adjusted for seasonal and calendar effects; December 1998 = 0)
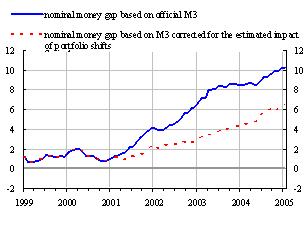 The measure of the nominal money gap is defined as the difference between the actual level of M3 and the level of M3 that would have resulted from constant M3 growth at its reference value of 4½% since December 1998 (taken as the base period). The measure of the nominal money gap is defined as the difference between the actual level of M3 and the level of M3 that would have resulted from constant M3 growth at its reference value of 4½% since December 1998 (taken as the base period). |
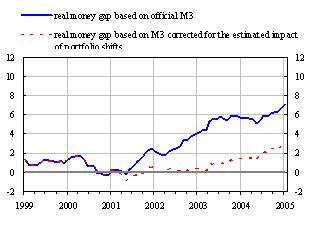 The measure of the real money gap is defined as the difference between the actual level of M3 deflated by the HICP and the deflated level of M3 that would have resulted from constant nominal M3 growth at its reference value of 4½% and HICP inflation in line with the ECB’s definition of price stability, taking December 1998 as the base period. The measure of the real money gap is defined as the difference between the actual level of M3 deflated by the HICP and the deflated level of M3 that would have resulted from constant nominal M3 growth at its reference value of 4½% and HICP inflation in line with the ECB’s definition of price stability, taking December 1998 as the base period. |
Figure 3 The range of annualised HICP inflation forecasts over six quarters from bivariate leading indicator models (annualised percentage growth rates; real time results of the last seven quarters) 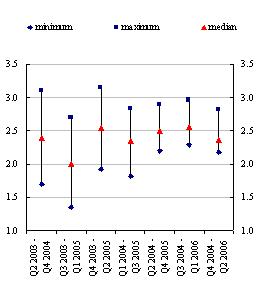 |
|---|
| Source: ECB estimates. Note: The chart shows the range of the annualised inflation forecasts of the last quarters from seven bivariate leading indicator models of inflation. Each forecast is based on information available at the time the forecast was made. For example, the forecast for Q4 2004 - Q2 2006 contains information on money and inflation up to and including Q4 2004. The methodology underlying the inflation forecasts of the seven models is described in detail in Nicoletti-Altimari (2001). |
References to the literature
Andrés, J, J. D. López-Salido and E. Nelson (2004) Money and the Natural Rate of Interest: Structural Estimates for the UK, the US and the Euro Area, CEPR Discussion Paper No. 4337.
Benhabib, J., S. Schmitt-Grohe and M. Uribe (2001) The Perils of Taylor Rules. Journal of Economic Theory, 96(1-2): 40-69.
Borio, C. and P. Lowe (2002), “Asset prices, financial and monetary stability: exploring the nexus”, BIS Working Paper, No. 114, July.
Bruggeman, A., G. Camba-Méndez, B. Fischer and J. Sousa (2005), “Structural Filters for Monetary Analysis – The Inflationary Movements of Money in the Euro Area”, ECB Working Paper Series No. 470.
Bruggeman, A., Donati, P., and Warne, A. (2003), “Is the demand for euro area M3 stable?”, in: O. Issing (ed.), Background Studies for the ECB’s Evaluation of its Monetary Policy Strategy. Frankfurt: ECB, pp. 245-300.
Calza, A., Gerdesmeier, D. and Levy, J. (2001), Euro area money demand: measuring the opportunity costs appropriately, IMF Working Paper, No. 01/179.
Calza, A., J. Sousa (2003) Why has broad money demand been more stable in the euro area than in other economies, a literature review, in: O. Issing (ed.), Background Studies for the ECB’s Evaluation of its Monetary Policy Strategy. Frankfurt: ECB, pp. 229-43.
Carlstrom, C. and T. Fuerst (2001) Timing and Real Indeterminacy in Monetary Models. Journal of Monetary Economics 47 (2): 285-98.
Christiano, L. and M. Rostagno (2001) Money growth monitoring and the Taylor rule. NBER Working Paper No. 8539.
Christiano, L., R. Motto and R. Rostagno (2003) The Great Depression and the Friedman-Schwartz Hypothesis. Journal of Money, Credit, and Banking. 35(6): 1119-97.
Coenen, G., Levin, A. and V. Wieland (2001), Data uncertainty and the role of money as an information variable for monetary policy, ECB Working Paper, No. 84.
Detken, C. and F. Smets (2004) Asset price booms and monetary policy, ECB Working Paper, No. 364.
Disyatat, P. (2005) Inflation targeting, asset prices and financial imbalances: Conceptualizing the Debate. Basel: BIS, BIS Working Papers No. 168.
ECB (2003) “Estimating the size of portfolio shifts from equity to money” Box 1 of the ECB Monthly Bulletin May 2003, pp. 11-14.
ECB (2004) “Monetary Analysis in Real Time”, ECB Monthly Bulletin October 2004, pp. 43-66.
Friedman, M. (1956) The quantity theory of money – A restatement, in M. Friedman (ed.) Studies in the quantity theory of money, Chicago and London: University of Chicago Press, reprinted in D. Laidler (ed.), The Foundations of Monetary Economics – Vol. 1, Cheltenham, UK, and Northampton, MA: Elgar Reference Collection, 1999.
Gerdesmeier, D. and B. Roffia (2004) “Taylor rules for the euro area: The issue of real-time data”, Deutsche Bundesbank, Discussion paper No. 37/2004.
Gerlach, S. and L. E. O. Svensson (2003) Money and Inflation in the Euro Area: A Case for Monetary Indicators?, Journal of Monetary Economics 50(8): 1649-72.
Greiber, C. and M. J. M. Neumann (2004) Inflation and core money growth in the euro area. Deutsche Bundesbank Discussion Paper, No. 36/2004.
Issing, O., V. Gaspar, I. Angeloni, O. Tristani (2001), Monetary Policy in the Euro Area Strategy and Decision-Making at the European Central Bank, Cambridge University Press, Cambridge.
Issing, O. (ed.) (2003) Background Studies for the ECB’s Evaluation of its Monetary Policy Strategy. Frankfurt: ECB.
Jäger, A. (2003) The ECB’s money pillar: An assessment, IMF Working Paper, No. 03/82.
King, M. (2001) No Money, No Inflation – The Role of Money in the Economy. Bank of England Quarterly Bulletin. Summer, 162-77.
Lombardo, G., R. Motto and M. Rostagno (2005) Money Growth and the Natural Real Interest Rate. ECB, typescript.
Leeper, E. and J. E. Roush (2003) Putting ‘M’ Back In Monetary Policy. Journal of Money, Credit and Banking 35 (6): 1217-56.
Masuch, K., S. Nicoletti-Altimari, H. Pill and M. Rostagno (2003) The Role of Money in Monetary Policy Making. In: O. Issing (ed.), Background Studies for the ECB’s Evaluation of its Monetary Policy Strategy. Frankfurt: ECB, pp. 187-228.
Masuch, K., H. Pill, C. Willeke (2001) “Framework and tools of monetary analysis” in Monetary Analysis: Tools and Applications, ed. H. J. Klöckers and C. Willeke, ECB, pp. 117-144.
Nelson, E. (2003) The future of monetary aggregates in monetary policy analysis, Journal of Monetary Economics 50 (2003), pp. 1029-59.
Nelson, E. and K. Nikolov (2003) UK Inflation in the 1970s and 1980s: The Role of Output Gap Mismeasurement. Journal of Economics and Business. 55: 353-370.
Nelson, E. and K. Nikolov (2004) Monetary Policy and Stagflation in the UK. Journal of Money, Credit and Banking. 36(3): 293-318.
Nicoletti-Altimari, S. (2001) Does money lead inflation in the euro area?, ECB Working Paper No. 63.
Orphanides, A. (2003a) The quest for prosperity without inflation. Journal of Monetary Economics. 50(3): 633-663.
Orphanides, A. (2003b) Monetary policy evaluation with noisy information, Journal of Monetary Economics, Volume 50, Issue 3, pp. 605-631.
Orphanides, A. and S. van Norden (2002) The unreliability of output gap estimates in real time, Review of Economics and Statistics, 84(4), pp. 569-83.
Orphanides, A., R. Porter, D. Reifenschneider, R. Tetlow and F. Finan (2000): “Errors in the Measurement of the Output Gap and the Design of Monetary Policy”, Journal of Economics and Business. 52: 117-41.
Spencer, D. E. (2004) Output Gap Uncertainty and Monetary Policy During the 1970s. Topics in Macroeconomics: Vol. 4: No. 1, Article 2. http://www.bepress.com/ bejm/topics/vol4/iss1/art2.
Von Hagen, J. (2004) Hat die Geldmenge ausgedient? Plenumsvortrag zur Jahrestagung des Vereins für Sozialpolitik. Perspektiven der Wirtschaftspolitik. 5(4): 423-453.
-
[1] See Issing et al. (2001).
-
[2] See the contributions of Masuch et al., Calza and Sousa and Bruggeman et al. in Issing (2003) for literature overviews and additional empirical evidence. More recent work on the euro area is presented in Bruggeman et al. (2005), Greiber and Neumann (2004). Jaeger (2003) and King (2001) are based on a broader set of countries.
-
[3] See for example von Hagen (2004) for an overview.
-
[4] See for example Nicoletti-Altimari (2001).
-
[5] See Orphanides (2000, 2003) and Spencer (2004) for the United States and Nelson and Kikolov (2003, 2004) for the United Kingdom.
-
[6] Coenen et al. (2001).
-
[7] See Borio and Lowe (2002) and Detken and Smets (2004) for a recent review and empirical investigation.
-
[8] For a general discussion of this issue see the article “Asset price bubbles and monetary policy” in the April 2005 edition of the ECB’s Monthly Bulletin.
-
[9] See Disyatat (2005) for a general discussion of the restrictions of strict inflation targeting to deal with asset prices.
-
[10] The title of Eric Leeper’s and Jennifer E. Roush’s contribution is “Putting ‘M’ Back in Monetary Policy”.
-
[11] See Nelson (2003) and Andrés et al. (2004).
-
[12] Lombardo et al. (2005) explore this argument in the context of a DSGE model.
-
[13] Weaknesses of these rule are discussed in Benhabib et al. (2001) and Carlstrom and Fuerst (2001).
-
[14] See Christiano and Rostagno (2001).
-
[15] For example, Norges Bank has recently modified its inflation targeting approach and given a more explicit role to credit and asset price developments.
-
[16] See Issing (2003).
-
[17] See for example ECB (2004) or Masuch et al. (2001) for a detailed description.
-
[18] See Introductory Statements in September and October 2004.
-
[19] For a more detailed description, see ECB (2004).
-
[20] See ECB (2003) for details.
-
[21] See the Introductory Statement of October 2001.
-
[22] See the Introductory Statements of February and March 2004.
-
[23] See the Introductory Statements of September and October 2004.
-
[24] The monetary indicators considered are: M1 growth, M2 growth, M3 growth, the growth of M3 corrected for the estimated impact of portfolio shifts, the growth of MFI loans to the private sector, a P-star measure of excess liquidity based on M3 and a P-star measure based on M3 corrected for the estimated impact of portfolio shifts.
Banca Centrală Europeană
Direcția generală comunicare
- Sonnemannstrasse 20
- 60314 Frankfurt pe Main, Germania
- +49 69 1344 7455
- media@ecb.europa.eu
Reproducerea informațiilor este permisă numai cu indicarea sursei.
Contacte media