The suspensions of redemptions during the COVID‑19 crisis – a case for pre-emptive liquidity measures?
Published as part of the Macroprudential Bulletin 12, April 2021.
Following the onset of the coronavirus (COVID‑19) crisis, a significant number of European investment funds suspended redemptions. We find that many of those funds had invested in illiquid assets, were leveraged or had lower cash holdings than funds that were not suspended. Furthermore, suspensions were more likely to be seen in jurisdictions where pre-emptive liquidity measures were not available. Our findings also suggest that suspensions have spillover effects on other funds and sectors, highlighting the importance of pre-emptive liquidity management measures.
1 Introduction
Following the onset of the COVID‑19 crisis, the European investment fund sector experienced severe liquidity issues, with a significant number of funds suspending redemptions. Between mid-February and end-March 2020, European investment funds experienced substantial valuation losses and net investor outflows.[1] This article finds that at least 215 investment funds (with net assets totalling €73.4 billion) suspended redemptions in March 2020.[2] While the majority of those funds were only suspended for a few days, others were suspended for longer periods or were liquidated.[3]
Suspending redemptions can mitigate stress at the fund level, but it impairs investors’ ability to raise liquidity. Suspensions stop investor outflows, thereby alleviating the immediate liquidity stress at the fund level. They can also mitigate possible spillovers to asset markets via price declines or fire sale dynamics during periods of stress. However, suspensions also reduce investors’ ability to obtain cash and can result in a decline in confidence and reputational losses.[4] This article provides an overview of the suspensions seen in March 2020 and identifies possible drivers of those developments. Furthermore, it assesses the impact that the suspensions had on the funds in question and looks at potential spillover effects.
2 The main drivers of the suspensions seen in March 2020
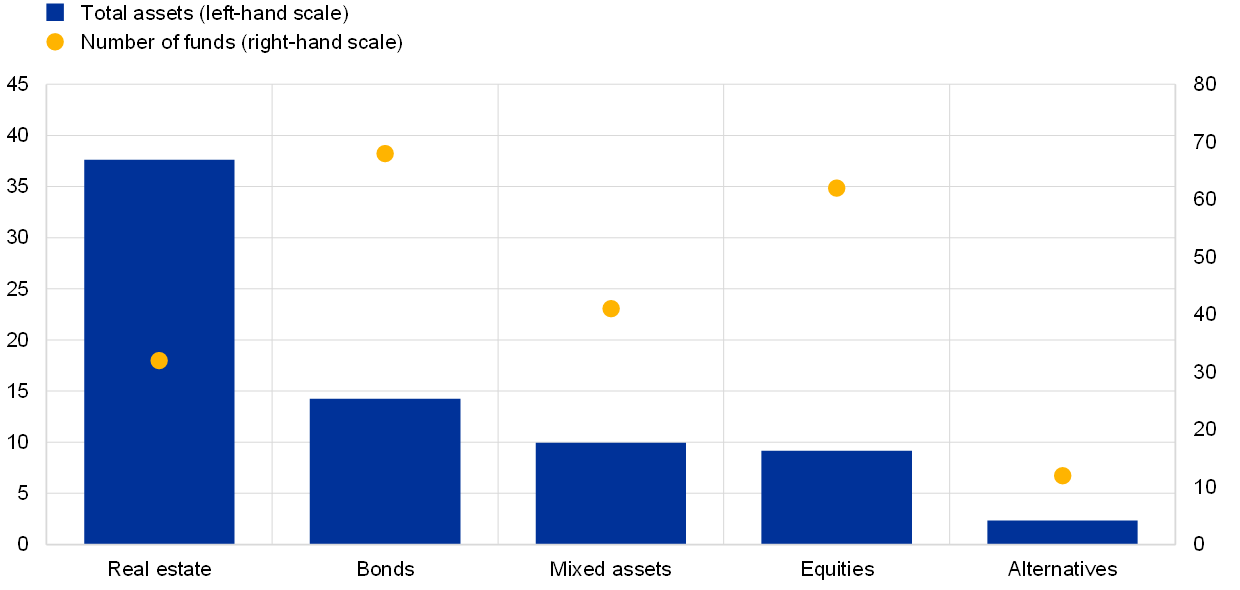
The suspensions seen in March 2020 mainly affected real estate and bond funds domiciled in Denmark, Luxembourg and the United Kingdom. Chart 1 provides information on the number of funds that suspended redemptions in March 2020 and the total net assets affected, broken down by asset type. In terms of total net asset value, real estate funds (€37.6 billion; 32 funds) and bond funds (€14.3 billion; 68 funds) were the most affected ones. The majority of the suspended funds were domiciled in Denmark and Luxembourg, followed by the United Kingdom and Sweden. Almost all of the suspended real estate funds were domiciled in the United Kingdom and many of them had previously suspended in 2016 following the Brexit referendum.
Chart 1
Number of funds suspending redemptions in March 2020 and their total net assets, broken down by asset type
(left-hand scale: total net assets (EUR billions); right-hand scale: number of funds)
Sources: Refinitiv Lipper, Morningstar, Financial Times, funds’ prospectuses and annual reports, and ECB calculations.
Note: This figure shows the number of funds that suspended redemptions in March 2020 and the total net assets affected, broken down by asset class.
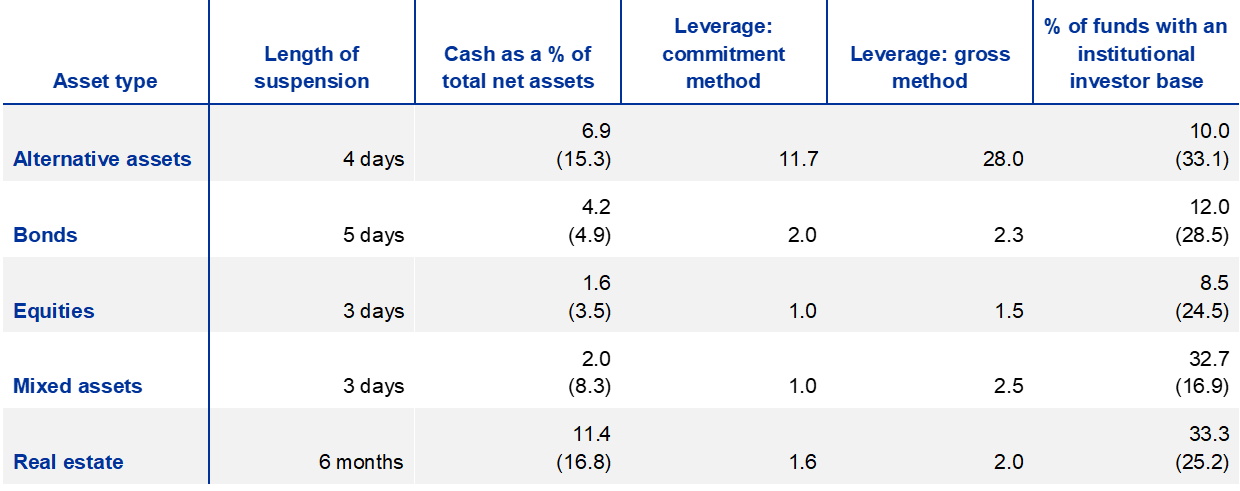
Investment in illiquid assets may have contributed to the stress experienced by suspended funds. Column 1 of Table 1 shows the average number of days of suspension by asset type. The longest suspensions were observed for real estate and bond funds.[5] Such funds typically invest in illiquid assets such as commercial property or high-yield corporate bonds, while offering their investors daily redemptions.[6] According to the suspending funds, those suspensions were driven by the prevailing uncertainty and the difficulty of accurately valuing their underlying assets. In that context, it may have been difficult for some funds to sell assets at a predictable price, encouraging investors to withdraw their money before others did (Chen et al., 2010).[7]
Table 1
Average fund-level features of funds that were suspended in March 2020
(sample means)
Sources: Refinitiv Lipper, Morningstar, Financial Times, funds’ prospectuses and annual reports, and ECB calculations.
Notes: This table shows the sample means of fund-level features for funds that suspended redemptions in March 2020, broken down by asset type. The numbers in brackets are the equivalent figures for all available UCITS and AIF funds. The commitment and gross leverage figures are hand-collected and only available for suspended funds. Total assets and cash holdings are based on figures as of 31 January 2020, while reported leverage is based on the latest investor prospectus available online. We assume that UCITS funds following the commitment approach do not employ leverage. Note that some real estate funds in the sample were still suspended at the time of writing.
Low cash holdings were common among the funds that suspended redemptions, adding to vulnerabilities in those funds. Column 2 of Table 1 shows average cash holdings as a percentage of total net assets. Across all asset types, funds that suspended redemptions tended, on average, to have lower cash holdings than the average fund in their asset class. Cash holdings are an important source of liquidity, particularly when faced with abrupt net redemptions (Chernenko and Sunderam, 2016). Meanwhile, Goldstein et al. (2017) show that investors react more strongly to funds’ poor performance when cash holdings are low, suggesting that outflows for such funds will be larger during stress periods.
Leverage may have further amplified pressure to sell among fund managers, implying larger first-mover advantages for investors. Columns 3 and 4 of Table 1 show the average leverage of different types of suspended funds, calculated using the commitment method and the gross method respectively.[8] Alternative funds have the highest leverage, in terms of the commitment approach, followed by bond and real estate funds.[9] Molestina Vivar et al. (2020) show that managers of leveraged funds react more procyclically to changes in the prices of securities than managers of unleveraged funds. Since those sales of securities are associated with additional costs for investors remaining in the fund, leverage amplifies investors’ first-mover advantages and their response to poor performance.[10] Thus, leverage may have intensified liquidity pressures in some suspended funds, especially those with low levels of cash holdings for which selling pressures are particularly high.
Most of the funds that suspended redemptions target retail investors, who are generally more prone to runs than institutional investors. Column 5 of Table 1 suggests that the majority of suspended funds target retail investors.[11] Retail investors typically have less scope to monitor the performance and risks of their investments than institutional investors (Schmidt et al., 2016). At the same time, they also tend to hold lower proportions of the fund’s shares than institutional investors and are thus more affected by the actions of others (Chen et al., 2010). Consequently, first-mover advantages and run risks are expected to be larger among retail investors, which suggests that redemption pressures will be greater in funds with a large percentage of retail investors.
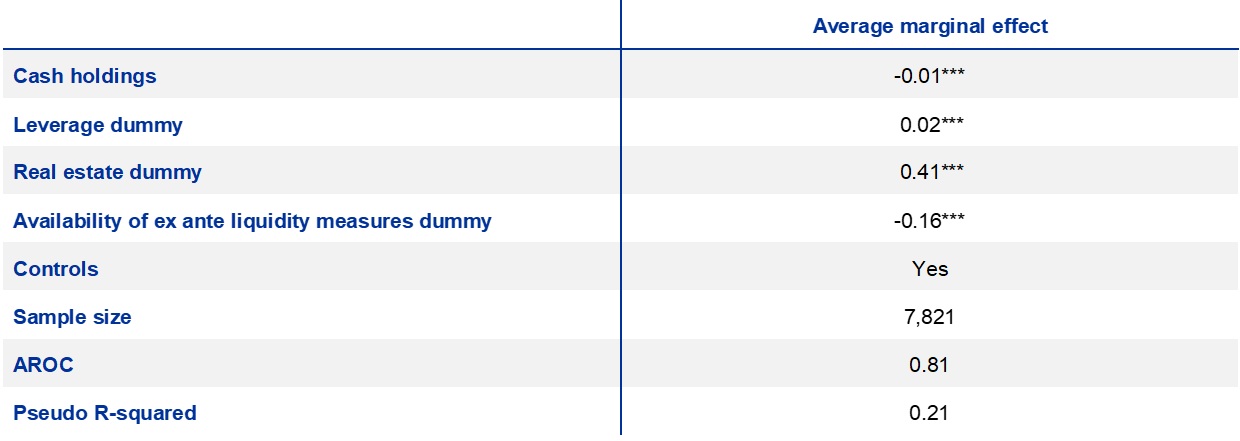
Investment in real estate, leverage and low levels of cash holdings are the main variables explaining the suspensions, but the availability of ex ante liquidity measures reduces the probability of suspending redemptions. Table 2 shows the average marginal effects of the key explanatory variables as derived from a cross-sectional multivariate logistic regression model estimating the probability of suspending redemptions in March 2020. Investment in real estate, leverage and low levels of cash holdings all increase the probability of suspending redemptions at the 1% significance level when controlling for fund size, lagged net flows and returns, asset class, valuation frequency[12] and whether the majority of investors are institutional. Furthermore, funds that are domiciled in jurisdictions which do not have ex ante liquidity management measures are more likely to suspend redemptions than other funds.[13]
Table 2
A logistic regression model estimating the probability of suspending redemptions in March 2020
(dependent variable: suspension dummy)
Sources: Refinitiv Lipper, Morningstar, Financial Times, funds’ prospectuses and annual reports, and ECB calculations.
Notes: This table shows the average marginal effects of explanatory variables that are significant at the 1% level on the basis of a logistic regression model estimating the probability of suspending redemptions. Cash holdings are calculated as a percentage of total net assets in units of 10 percentage points. The leverage dummy has a value of 1 if the fund is either synthetically or financially leveraged, applying the methodology used by Molestina Vivar et al. (2020). The real estate dummy has a value of 1 if the fund’s asset type is real estate. Alternative assets are the base group category for the asset type variable. The other asset types are bonds, equities and mixed assets. Controls include the fund’s total net assets (log), its average net flows and returns between 24 February and 9 March 2020, a categorical variable indicating the fund’s valuation frequency and a dummy variable indicating whether the majority of investors are institutional. Variables that are not listed in the table are not statistically significant at the 1% level. The sample comprises 7,821 share classes across AIFs and UCITS funds for which the required data are available. Asterisks denote standard statistical significance (*** p < 0.01).
3 The impact of suspending redemptions
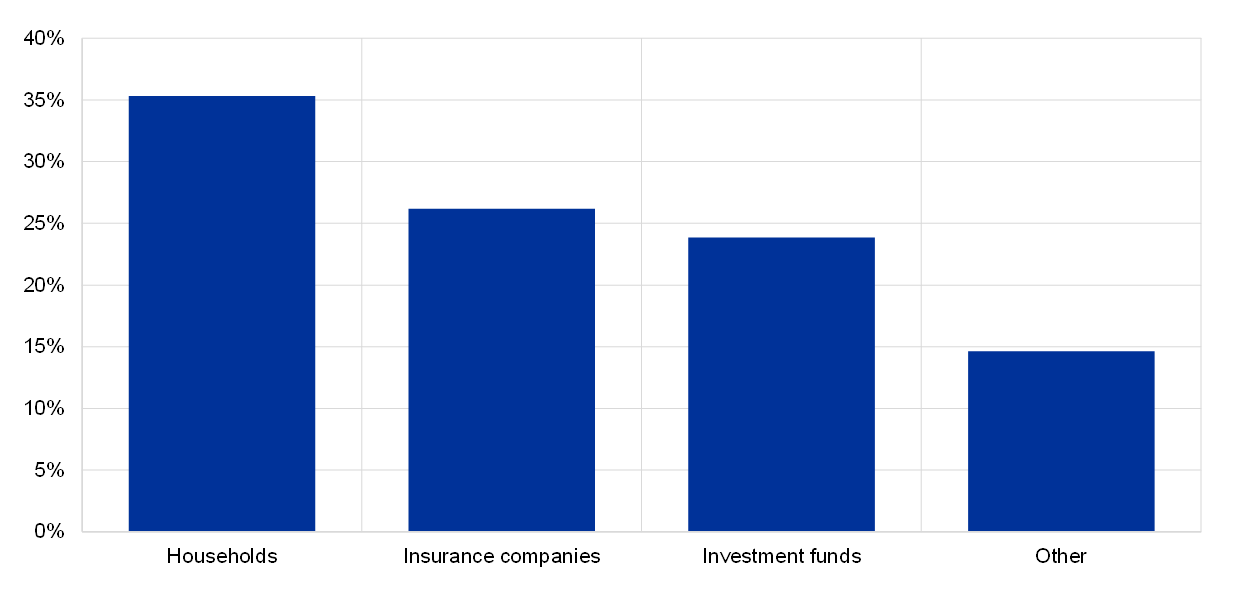
While suspensions mitigate the immediate stress at the fund level, they can result in liquidity shortages in other financial and economic sectors. Chart 2 shows the different types of euro area investors that held shares in euro area funds that suspended or were likely to have suspended redemptions in March 2020.[14] Of those investors, households accounted for the largest percentage of assets (35%), followed by insurers (26%) and investment funds (24%). By limiting investors’ ability to raise cash in a period of declining market prices, the suspensions in March 2020 may have exacerbated liquidity shortages in those sectors.
Chart 2
Euro area investors exposed to the fund suspensions in March 2020
(percentages of total assets held by euro area investors)
Sources: ECB securities holdings statistics, Morningstar, Financial Times, funds’ prospectuses and annual reports, and ECB calculations.
Notes: This figure shows the different investor types that held shares in suspended funds and funds that were likely to suspend redemptions in March 2020. The data in this figure relate to the first quarter of 2020. We only consider funds domiciled in the euro area with a probability of suspending in the top decile of the sample distribution. The probability to suspend is estimated, per fund, based on the predicted values from the logistic regression model presented in Table 1.
Suspensions can damage investors’ confidence, trigger reputational losses and produce spillover effects. Investors may regard a suspension as a sign of a major problem within the fund, which could lead investors to withdraw their money once the suspension has been lifted.[15] At the same time, a suspension affecting one fund, or a small group of funds, can increase concerns about further suspensions and lead to withdrawals from other funds as well. Thus, the suspension of a fund can also have broader adverse effects on other funds, other asset classes or the wider fund sector.
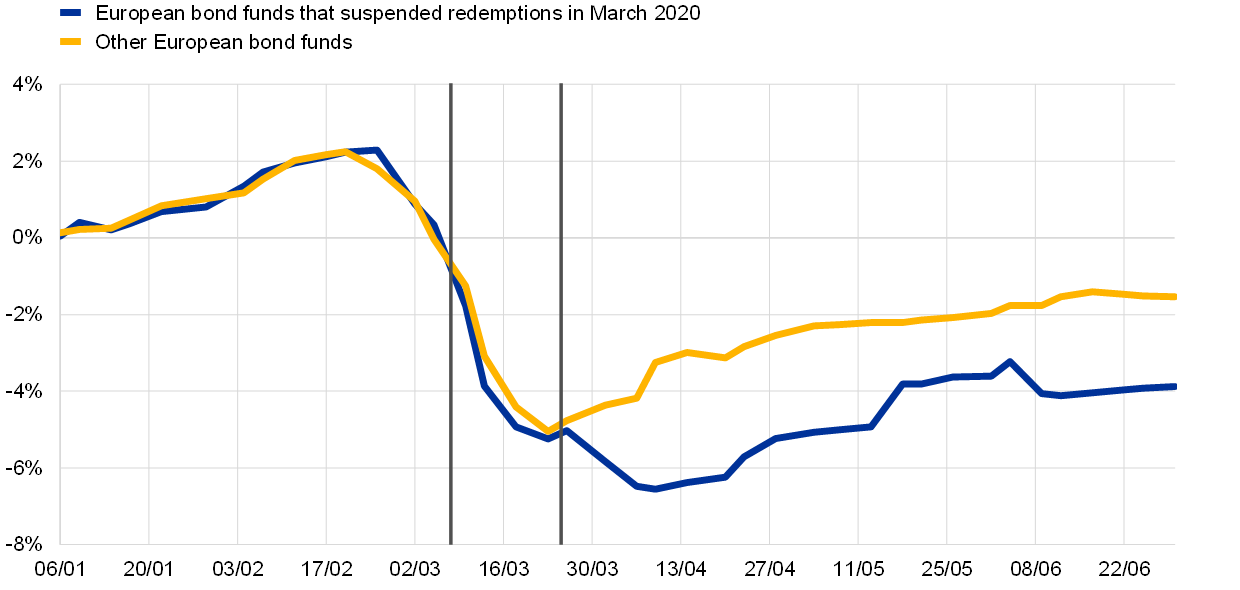
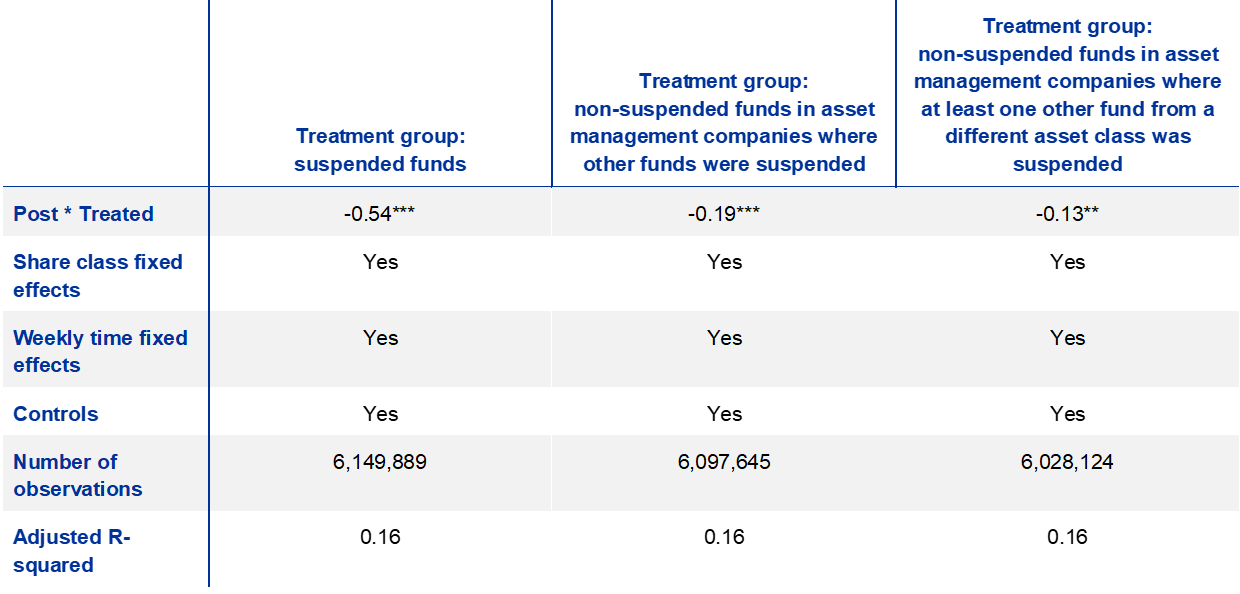
After reopening, funds that had suspended redemptions in March 2020 experienced smaller inflows than funds that had not imposed suspensions, suggesting that reputational costs may have been incurred. Chart 3 shows cumulative flows for (i) bond funds that suspended redemptions in March 2020 (blue line) and (ii) bond funds that did not impose suspensions (yellow line).[16] Before the suspensions, the two groups moved largely in parallel. Since those suspensions were lifted, however, funds that suspended redemptions in March 2020 have seen weaker net flows. This finding is confirmed by a fixed effects difference‑in‑differences model suggesting that, post-March 2020, funds that had imposed suspensions saw larger outflows than funds that had not suspended redemptions (see column 1 of Table 3).
Chart 3
Net flows for suspended and non-suspended bond funds before and after March 2020
(cumulative flows as a percentage of total assets)
Sources: Refinitiv Lipper, Morningstar, Financial Times, funds’ prospectuses and annual reports, and ECB calculations.
Notes: The first vertical line denotes 9 March 2020 – the day that the first bond funds in the sample suspended redemptions. The second vertical line denotes 27 March 2020 – the day that the last fund in the sample reopened after suspending redemptions.
Fund suspensions may have also affected funds that were not suspended themselves but belonged to an asset management company where other funds were suspended. As column 2 of Table 3 shows, after the suspensions of March 2020, average weekly net flows for non-suspended funds were around 0.19 percentage points lower where they were part of an asset management company where other funds had been suspended. This would suggest that, in the 12 weeks following those suspensions, these funds experienced, on average, outflows that were around 2.28 (0.19 x 12) percentage points larger than those seen by other funds that had not been suspended. This effect holds when the suspended fund within the same asset management company involves a different type of asset (see column 3 of Table 3), suggesting that suspensions can have spillover effects on other funds and other asset classes.
Table 3
Difference-in-differences model assessing the impact of suspensions
(dependent variable: net investor flows)
Sources: Refinitiv Lipper, Morningstar, Financial Times, funds’ prospectuses and annual reports, and ECB calculations.
Notes: This table shows the coefficients derived from a difference-in-differences model. The sample period runs from January 2019 to June 2020 with a weekly frequency. The dependent variable is net investor flows as a percentage of lagged total net assets. In column 1, the dummy variable “Post” has a value of 1 for all periods after the fund reopened (and 0 otherwise), while the dummy variable “Treated” has a value of 1 if the fund suspended redemptions in March 2020 (and 0 otherwise). In column 2, “Post” is 1 for all periods after the fund was suspended, while “Treated” is 1 if the fund was not suspended but is part of an asset management company in which at least one other fund was suspended. Funds that suspended redemptions are excluded from the analysis in column 2. In column 3, “Post” is 1 for all periods after the fund was suspended, while “Treated” is 1 if the fund was not suspended but is part of an asset management company in which at least one other fund from a different asset class was suspended. Thus, the analysis in column 3 excludes funds from asset management companies where one or more suspended funds were from the same asset class as the non-suspended fund. All specifications control for lagged returns and total net assets (log) and include share class and daily weekly fixed effects. Asterisks denote standard statistical significance (* p < 0.1, ** p < 0.05, *** p < 0.01).
4 Conclusion
The suspension of redemptions can prevent stress at the fund level, but it impairs economic actors’ ability to obtain liquidity, with repercussions for various sectors of the real economy and the wider financial system. The stress seen in March 2020 highlights the fact that investment funds are largely reliant on ex post liquidity tools such as the suspension of redemptions. The findings in this article suggest that suspensions increase outflows after funds reopen and result in spillover effects on other funds within the same asset management company and other asset classes as well. Furthermore, suspensions limit the ability of other financial institutions and households to raise liquidity in periods of stress.
The events of March 2020 highlight weaknesses in the policy framework for investment funds. The current prudential framework includes provisions aimed at ensuring that the liquidity of assets is consistent with funds’ redemption policies.[17] However, a significant number of investment funds began the recent period of stress with substantial liquidity mismatches, pointing to vulnerabilities in the investment fund sector.[18] Many of the funds that suspended redemptions had invested in illiquid assets, were leveraged or had lower cash holdings than other funds, adding to the stress in those funds and across the fund sector more broadly. Furthermore, suspensions were more likely to be seen in jurisdictions where ex ante liquidity measures were not available, pointing to possible weaknesses in the policy framework.
Greater availability and use of ex ante liquidity measures could mitigate the build-up of systemic risks. While suspensions can be effective in mitigating risks once they have materialised, they cannot prevent such risks from building up in the first place. This could be achieved by implementing ex ante liquidity measures such as minimum levels of cash holdings, restrictions on the frequency of redemptions or minimum notice periods. Greater availability and use of such measures could help to limit the build-up of liquidity risks in investment funds, ensuring that the liquidity of their assets is better aligned with redemption risks in periods of stress and thus reducing the likelihood of funds needing to suspend redemptions.
References
AMIC and EFAMA (2017), “Use of Leverage in Investment Funds in Europe”, July.
Chen, Q., Goldstein, I. and Jiang, W. (2010), “Payoff complementarities and financial fragility: Evidence from mutual fund outflows”, Journal of Financial Economics, Vol. 97(2), pp. 239‑262.
Chernenko, S. and Sunderam, A. (2016), “Liquidity transformation in asset management: Evidence from the cash holdings of mutual funds”, NBER Working Papers, No 22391.
Cominetta, M., Lambert, C., Levels, A., Rydén, A. and Weistroffer, C. (2018), “Macroprudential liquidity tools for investment funds – A preliminary discussion”, Macroprudential Bulletin, Issue 6, ECB, October.
Downs, D., Sebastian, S., Weistroffer, C. and Woltering, R.-J. (2016), “Real Estate Fund Flows and the Flow-Performance Relationship”, The Journal of Real Estate Finance and Economics, Vol. 52(4), pp. 347‑382.
ECB (2020), Financial Stability Review, May.
ESMA (2020), “Recommendation of the European Systemic Risk Board (ESRB) on liquidity risk in investment funds”, 12 November.
ESRB (2016), “Macroprudential policy beyond banking: an ESRB strategy paper”, July.
ESRB (2017), “Recommendation ESRB/2017/6 of 7 December 2017 on liquidity and leverage risks in investment funds”.
ESRB (2020), “A Review of Macroprudential Policy in the EU in 2019”, April.
Fitch Ratings (2020a), “European Mutual Fund Gatings Rise as Coronavirus Spooks Markets”, 20 April.
Fitch Ratings (2020b), “Jyske Fund Suspensions Highlight Open-End Fund Vulnerability”, 13 March.
FSB (2017), “Policy Recommendations to Address Structural Vulnerabilities from Asset Management Activities”, 12 January.
Goldstein, I., Jiang, H. and Ng, D.T. (2017), “Investor flows and fragility in corporate bond funds”, Journal of Financial Economics, Vol. 126(3), pp. 592‑613.
IOSCO (2012), “Principles on Suspensions of Redemptions in Collective Investment Schemes”, final report, January.
Molestina Vivar, L., Wedow, M. and Weistroffer, C. (2019), “Is leverage driving procyclical investor flows? Assessing investor behaviour in UCITS bond funds”, Macroprudential Bulletin, Issue 9, ECB, October.
Molestina Vivar, L., Wedow, M. and Weistroffer, C. (2020), “Burned by leverage? Flows and fragility in bond mutual funds”, Working Paper Series, No 2413, ECB.
Schmidt, L., Timmermann, A. and Wermers, R. (2016), “Runs on Money Market Mutual Funds”, American Economic Review, Vol. 106(9), pp. 2625‑2657.
ECB (2020).
Data on suspended funds have been collected by hand using a variety of different sources, including Morningstar, the Financial Times, disclosure letters from fund managers, funds’ annual reports and investor prospectuses, and other media reports and articles. This data was merged with fund-level variables based on Refinitiv Lipper. The suspended funds cover 336 different share classes. The total value of all suspended assets could well be even higher, with ESMA indicating that the combined assets of all funds that suspended redemptions or applied other extraordinary liquidity measures in March 2020 had a total value of €100 billion (Fitch Ratings, 2020a).
By the end of April 2020, at least six bond funds, six equity funds and two alternative funds had been liquidated.
IOSCO (2012).
Some real estate funds still had not lifted their suspensions at the time of writing. The longest suspension for a bond fund in our sample was 16 days; it was 12 days for equity funds and alternative funds; and it was 7 days for mixed funds.
For example, a number of suspended Danish bond funds had exposure to Lebanese sovereign bonds maturing in 2026 and 2027, or to junior/hybrid instruments issued by Italian banks that were facing threats relating to their earnings and asset quality (Fitch Ratings, 2020b).
See also Goldstein et al. (2017) and Downs et al. (2016) for analysis of corporate bond funds and real estate funds respectively.
See AMIC and EFAMA (2017) for an overview of the methods to measure leverage.
The leveraged funds that suspended redemptions were all alternative investment funds (AIFs) or absolute value-at-risk (VaR) funds governed by the UCITS Directive. The absolute VaR limit generally allows greater use of derivatives and leverage than the other regulatory approaches under the UCITS Directive, which restrict leverage more directly – see, for instance, AMIC and EFAMA (2017) and Molestina Vivar et al. (2019).
Costs are attributed to the trades that fund managers make to accommodate investor withdrawals, and include commissions, bid–ask spreads, price impact as well as indirect costs that arise when redemptions force fund managers to deviate from their optimal portfolios.
Similarly, with the exception of alternative and real estate funds, funds that suspended redemptions are mostly registered under the UCITS framework, which is popular among retail investors.
A higher valuation frequency may make it more difficult to value asset prices accurately. In Denmark, for instance, funds price assets several times a day. This can increase the probability of suspending redemptions if fund managers are unable to obtain accurate valuations during periods of market turmoil.
Ex ante measures can be used to mitigate first-mover advantages and systemic risk, while ex post tools allow fund managers to manage funds’ liquidity by limiting outflows (ESRB, 2017). In April 2020, the ESRB reported that ex ante liquidity management policies were not available in Bulgaria, the Czech Republic, Denmark, Greece, Hungary, Iceland, Latvia or Sweden, but they were available in other European jurisdictions (ESRB, 2020). It reported that some jurisdictions (Denmark, Hungary, Latvia and Sweden) “only [had] the suspension of redemptions available to asset managers” (ESRB, 2020). However, by now, these jurisdictions have adopted additional liquidity policies (ESMA, 2020). For an overview of the available ex ante measures in EU jurisdictions, see ESMA (2020).
This analysis focuses on funds domiciled in the euro area, since ECB data on securities holdings are only available for euro area countries. To have a sufficiently large and representative sample for suspending funds in the euro area, we also include euro area funds that did in fact not suspend in March 2020, but were similar to the suspended funds. To ensure similarity, we only consider funds with a probability of suspending redemptions in the top decile of the sample distribution. The probability to suspend is estimated per fund based on the predicted values from the logistic regression model presented in Table 1.
See IOSCO (2012) and Cominetta et al. (2018).
This figure looks solely at bond funds in order to see the impact within a single asset class. The bond fund sector is the most affected sector in the euro area in terms of the number of funds and the total value of assets. Real estate funds are mainly domiciled in the United Kingdom, and many of those funds had not lifted their suspensions at the time of writing.
Article 40(4) of Commission Directive 2010/43/EU provides that the liquidity profile of a UCITS fund’s investments needs to be in line with its redemption policy, while Article 16(2) of the AIFM Directive stipulates that AIF managers must ensure that their funds’ liquidity profiles and redemption policies are consistent.
See also ESRB (2016, 2017) and FSB (2017).


