Assessing the impact of a mandatory public debt quota for private debt money market funds
This analysis studies the extent to which a minimum public debt quota could increase the shock-absorbing capacity of private debt money market funds (MMFs), while also considering potential costs and feasibility issues in terms of the supply of public debt. We define shock-absorbing capacity as the amount of assets that are expected to be liquid and relatively easy to sell in a period of stress. This includes public debt as well as parts of a fund’s daily and weekly liquid assets (DLA and WLA). The assumption is that some assets, in particular public debt instruments, would be easier to draw down and sell during market stress than private sector debt, such as commercial paper (CP), for which there is no or very little secondary market trading, even in normal times. We perform the benefit analysis for a sample of low-volatility net asset value (LVNAV) and variable net asset value (VNAV) funds using Crane data.[1] The analysis also considers possible costs related to the funding of non-financial corporations (NFCs) and the attractiveness of MMFs as well as possible feasibility issues in terms of the supply of public debt.
Assessing possible benefits
A minimum share of short-term public debt assets would complement the existing daily and weekly maturing asset requirements and help fund managers to meet large and unexpected outflows. Chart 1, panel a, shows the share of MMFs that would have been able to meet their largest weekly outflows during the coronavirus (COVID-19) related market turmoil in March 2020 by liquidating only public debt (based on actual holdings of public debt and hypothetical holdings of public debt under a minimum quota). The first two bars in panel a are based on actual holdings prior to March 2020. They show that only around 8% of LVNAV funds and 13% of VNAV funds would have been able to meet outflows during the turmoil with the public debt they had when entering it, assuming that fund managers could have used all of their public debt irrespective of whether or not it was part of their WLA. However, a minimum public debt quota that is fully usable during a crisis could substantially increase the resilience of MMFs. For instance, a minimum public debt quota of 10% would have allowed around 21% of LVNAV funds and 47% of VNAV funds to meet their weekly outflows during the March 2020 market turmoil without having to sell private debt assets (see the second pair of bars in panel a). This figure rises to about 66% of LVNAV funds and 87% for VNAV funds with a minimum public debt quota of 20%.
Chart 1
A higher share of public debt holdings in MMFs would help fund managers to deal with large and unexpected outflows

Sources: Crane data and ECB calculations.
Notes: 10% public debt refers to a minimum 10% public debt quota; 15% public debt refers to a minimum 15% public debt quota; 20% public debt refers to a minimum 20% public debt quota. Panel a shows the share of MMFs whose public debt at the end of January 2020 was enough to cover their largest weekly outflow in March 2020 for actual and hypothetical values of public debt holdings. The shaded areas show the share of funds that could cover their outflows with public debt that is also part of their WLA, while the solid areas refer to the share of funds that could cover their outflows with “excess” public debt, meaning public debt holdings that are not part of their WLA. Panel b shows the percentage of MMFs whose “excess” public debt and “usable” WLA at end of January 2020 was enough to cover their largest weekly outflows in March 2020 for actual and hypothetical values of public debt. “Usable” WLA refers to the estimated average share of WLA that private debt MMFs used to meet their weekly outflows in March 2020, i.e. around 30% of their total available WLA.
To inform the discussion on the calibration of a minimum public debt quota, it is also important to consider how MMFs have used their liquid assets to meet redemptions during periods of stress and how a public debt quota would interact with other liquidity requirements. The March 2020 turmoil showed that, although large outflows were seen for some private debt MMFs, fund managers did not draw down their weekly liquid assets to the same extent. In Chart 1, panel b, we assume that fund managers draw down parts of their available WLA, in addition to using their public debt holdings in excess of their WLA. In particular, we assume that funds can use up to 100% of those public debt holdings and up to 30% of their available WLA, as the latter number corresponds to our estimates of the average amount of WLA that private debt MMFs used to meet their largest weekly outflows during the March 2020 turmoil. In this case, 31% of LVNAV funds and 46% of VNAV funds would have had sufficient shock-absorbing capacity to cover their March 2020 outflows (first pair of bars in panel b). A minimum public debt quota in the range of 10% to 20% of total assets would significantly increase the shock-absorbing capacity to meet their outflows (second, third and fourth pairs of bars).
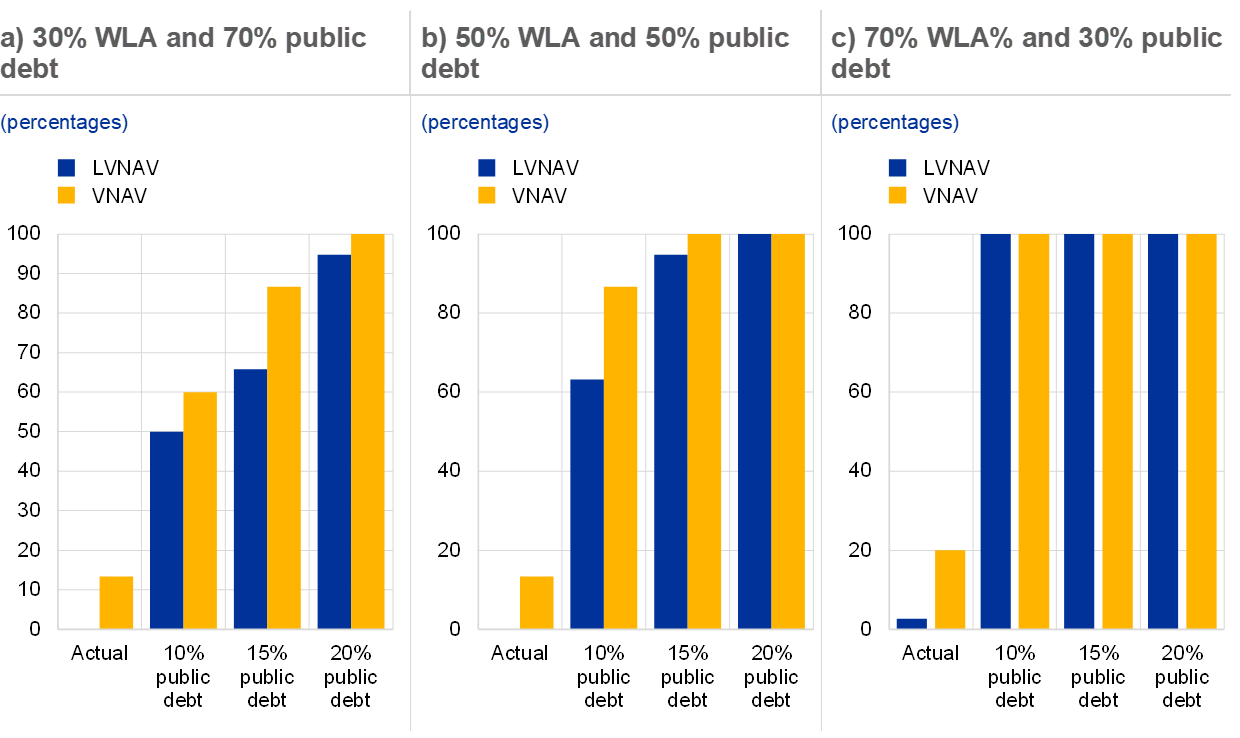
This finding is confirmed using various scenarios and assumptions on how fund managers might meet their redemptions, based on different combinations of public debt and WLA (Chart 2). In particular, this exercise considers different fixed fractions of WLA and public debt that are used to cover outflows (so that, in contrast to Chart 1, private debt MMFs that cover their outflows cannot generally draw down all of their public debt in any of the scenarios).[2] This implicitly allows for greater usability of WLA in some configurations, in line with the wider intention of the MMF reform proposals to also make liquidity buffers more usable, even if the higher liquidity and depth of public debt markets relative to CP and CD markets means that fund managers may tend to use relatively more public debt to meet redemptions.[3] The high share of funds that can meet the outflows in panels b and c of Chart 2 rests on this greater usability and highlights how enhanced usability of liquidity buffers can complement the introduction of a mandatory public debt quota.
Chart 2
The impact of a higher share of public debt holdings in MMFs depends on how fund managers might meet their redemptions, based on different combinations of public debt and WLA

Sources: Crane data and ECB calculations.
Notes: Panel a shows the share of MMFs that would have been able to meet 30% of their March 2020 largest weekly outflows with WLA and the remaining 70% with public debt. Panel b shows the share of MMFs that would have been able to meet 50% of their March 2020 largest weekly outflows with WLA and the remaining 50% with public debt. Panel c shows the share of MMFs that would have been able to meet 70% of their March 2020 largest weekly outflows with WLA and the remaining 30% with public debt. Both WLA and public debt need to be available in sufficient amounts to meet outflows by liquidating a particular mix of assets. No other constraints are imposed on the usability of WLA or public debt. To avoid double counting of public debt holdings, the amount of public debt that is used to meet the outflows does not include public debt instruments that are held within the WLA. Additional shock-absorbing capacity results from an increase of public debt holdings outside WLA to 10%, 15% or 20%, while WLA is assumed to remain at pre-existing actual levels.
Assessing possible costs in relation to NFC funding
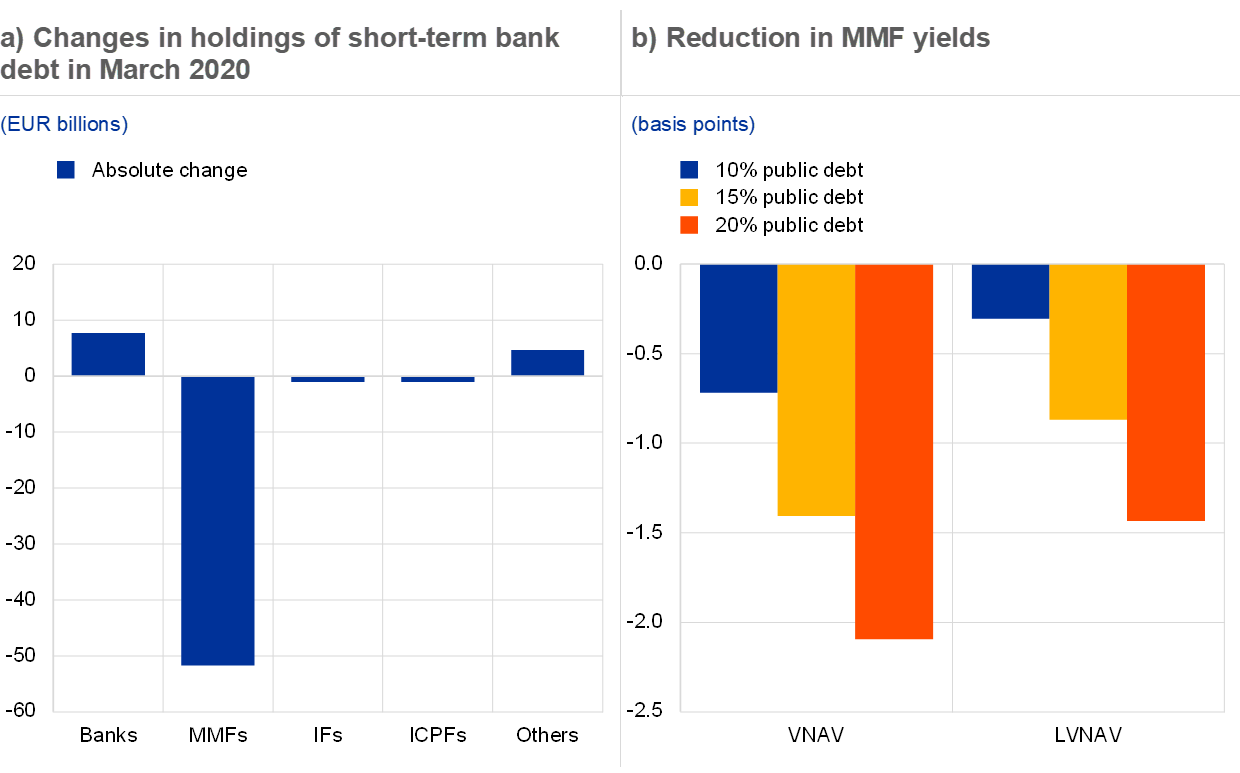
The impact on MMFs’ economic function in terms of NFC funding ultimately depends on how MMFs would rebalance their portfolios to meet the public debt quota, and there are clear incentives for MMFs to do this via bank debt. An increase in holdings of public debt would tilt MMFs’ investment away from private debt securities. This has potential implications for the MMF function of providing short-term funding to NFCs. However, if MMFs aim to keep their overall risk-return profile relatively constant following the reforms, they would aim to meet their public debt quota by reducing lower-yielding assets, such as bank debt, rather than higher-yielding assets, such as NFC debt. Specifically, given that the return on bank certificates of deposit (CDs) is around 20 basis points lower than that on NFC CP,[4] MMFs would have an incentive to rebalance mainly via bank debt rather than NFC debt. While MMF funding of bank short-term debt securities is useful in providing liquidity in normal times, it has proven to act as a stress amplification channel during crises, owing to the excessive footprint of MMFs in these markets (Chart 3, panel a). When analysing the potential impact of the proposed reforms on the structure of short-term funding markets, it is important to evaluate the impact during bad times as well as good. In March 2020 MMFs reduced their exposures to banks, causing significant disruptions in bank unsecured funding markets, as reflected in the euro interbank offered rate (EURIBOR), which contributed to the need for significant central bank interventions.[5]
Chart 3
MMF funding to banks is unstable, while the impact on yields would be moderate

Sources: Securities Holdings Statistics (SHS), ECB Statistical Data Warehouse (SDW), Banque de France, Crane and ECB calculations.
Notes: Panel a shows the change in holdings of euro area banks’ short-term debt securities by different sectors in the euro area between December 2019 and March 2020, including a significant reduction in MMF holdings of bank CDs. Panel b shows the estimated impact of the introduction of a public debt quota on the yields of the underlying portfolio returns on assets of euro-denominated MMFs, using the average difference between September 2020 and September 2021 in euro area yields on government debt, bank CDs and NFC short-term securities. The effect is larger for VNAV funds because they currently have a lower holding of public debt and a higher share of NFC funding in their portfolios. We estimate the current public debt holdings by MMF type using a combination of Crane and Banque de France data, thereby covering around 80% of the euro-denominated MMF sector. For the yields of euro area public debt, we use a weighted average (by outstanding amount) of all issuers from the SDW; for bank debt we use the three-month EURIBOR; and for NFCs we use Banque de France NEU data. IFs = investment funds; ICPFs = insurance corporations and pension funds.
Assessing possible costs in terms of MMF attractiveness
The overall impact on MMF attractiveness is ambiguous owing to the trade-off for investors between the reduction in yields (investment-like function) and the potential increased safety and liquidity benefits of strengthened liquidity requirements (cash-like function). Chart 3, panel b, shows the change in the yields of the underlying portfolios under different public debt holding scenarios. It assumes that MMFs would increase their holdings of public debt assets by reducing their holdings of bank and NFC securities in proportion to their respective size in the MMF’s portfolio. The impact on the overall return of the underlying portfolio is calculated by multiplying the difference in yields between short-term private debt (bank and NFC) and public debt by the change in the share of public debt in the portfolio. The impact on yields of a public debt quota ranging from 10% to 20% would range from about 0.7 basis points to just over 2 basis points for VNAV funds, and up to around 1.5 basis points for LVNAV funds. In principle, this has the potential to reduce the attractiveness of the MMF sector to some extent. However, attractiveness is driven not only by yields but also by capital preservation and liquidity. The experience of the US reform in 2016 suggests that reforms which reduce the cash-like function of MMFs can have a significant negative impact on their attractiveness.[6] Following those reforms, there was a sizeable switch from prime MMFs to public debt MMFs, with investors willing to pay a significant premium for the cash-like qualities of the latter. So, while the proposed public debt quota would slightly lower the gross (non-risk-adjusted) returns of private debt MMF funds, it should make them more attractive to investors who value their cash-like function.
Feasibility in terms of supply of public debt
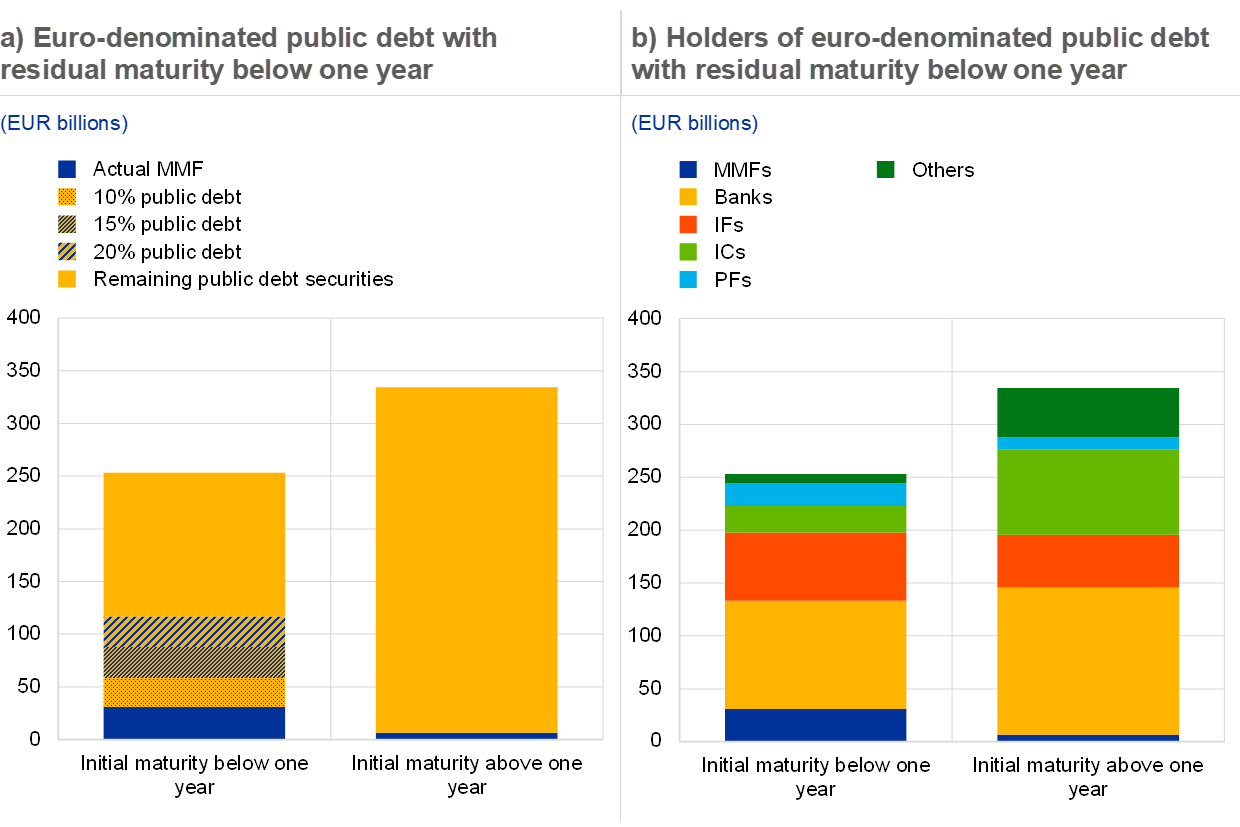
A public debt quota would increase the footprint of MMFs in short-term public debt markets, but outstanding amounts should be sufficient to meet increased demand. The outstanding amount of euro-denominated short-term public debt should be sufficient to absorb the expected increased demand from a 10%-20% public debt quota. The shaded areas in Chart 4, panel a, show the additional public debt euro-denominated MMFs would need to hold if a mandatory 10%, 15% or 20% public debt quota was implemented. The left bar of Chart 4, panel a, shows the outstanding amount of public debt with a residual maturity less than one year that was short-term at issuance, while the right bar shows the amount of public debt with a residual maturity of less than one year that was long-term at issuance. Panel a suggests that MMFs currently purchase short-term government debt mainly on the primary market (left bar) rather than via secondary markets (right bar), but there would continue to be scope for this under the proposed requirements. While it would be feasible for MMFs to make the transition by increasing their holdings of securities that are short-term at issuance (left bar), it would be further facilitated if they increase their holdings of low residual maturity (long-term at issuance) bonds from the secondary market (right bar). Chart 4, panel b, shows the breakdown of the holdings of low residual maturity public debt by sector, which helps identify which sectors may be affected by an increase in demand from MMFs. Banks currently hold the largest share of securities issued with an initial maturity below one year. In principle, if a part of banks’ holdings is to play a stabilising role in sovereign debt markets, then the issue of crowding-out may be less pronounced.[7]
Chart 4
Feasible in terms of supply of euro area public debt

Sources: SHS, Banque de France, Lipper and ECB calculations
Notes: Panel a shows MMF holdings of euro area government debt (euro-denominated) with a residual maturity below one year and an investment grade rating. The shaded part of the left bar shows the additional public debt that euro-denominated MMFs would hold under different quotas (10%, 15% or 20%). To compute the prospective holdings, we calculate the total size of the euro-denominated sector using a combination of Banque de France and Lipper data. Panel b shows which sectors currently hold these public debt securities. IFs = investment funds; ICs = insurance corporations; PFs = pension funds.
References
Banque de France, (2021), Statistical reports and analysis.
Capotă, L.D., Grill, M., Molestina Vivar, L., Schmitz, N. and Weistroffer, C. (2021), “How effective is the EU Money Market Fund Regulation? Lessons from the COVID 19 turmoil”, Macroprudential Bulletin, Issue 12, ECB, April.
Cipriani, M. and La Spada, G., (2021), “Investors’ Appetite for Money-Like Assets: The Money Market Fund Industry after the 2014 Regulatory Reform”, Journal of Financial Economics, Volume 140, Issue 1, April 2021, Pages 250-269.
European Central Bank, (2021), “Money Market interest rates”, Statistics Bulletin, ECB.
Grill, M., Molestina Vivar, L., Mücke, C., O’Donnell, C., O’Sullivan, S., Wedow, M., Weis, M. and Weistroffer, C., (2022), “Mind the liquidity gap: a discussion of money market fund reform proposals”, Macroprudential Bulletin, Issue 16, ECB, January.
See Capotă et al. (2021) for a description of the dataset used. To calculate the interaction between public debt and WLA, we compute WLA as assets that mature within one week, plus up to 17.5% of the portfolio for LVNAV funds, in line with the MMF Regulation. It is worth noting, however, that VNAV funds are underrepresented in the dataset, especially given that no French standard VNAV funds are included in the sample. Standard VNAV funds tend to hold longer maturity assets than short-term VNAV funds. In addition, French standard VNAV funds, which hold the majority of assets in the French MMF sector, had substantially higher outflows in March 2020 than short-term VNAV funds. Given that standard VNAV funds are more vulnerable than short-term VNAV funds, it is likely that the analysis represents a lower bound for VNAV funds.
This does not apply if the amount of public debt is equal to the amount of outflows to be met with public debt.
For a discussion of the reform proposals, see Grill et al. (2022).
See Banque de France (2021) historical statistical reports and analysis on NEU CP-NEU MTN and ECB (2021) on EURIBOR 3-month historical rate.
Furthermore, policies aimed at increasing the attractiveness of euro area short-term funding markets, such as increased standardisation and transparency, can help to bring in other investors, thereby diversifying the overall investor base and increasing the overall resilience of these markets.
See Cipriani and La Spada (2021).
It is generally accepted that banks have incentives (e.g. moral suasion; the desire to support their funding conditions or valuation of their sovereign debt portfolio) to act as a residual buyer of sovereign debt and help stabilise markets.


