Investment funds’ procyclical selling and cash hoarding: a case for strengthening regulation from a macroprudential perspective
Published as part of the Financial Stability Review, May 2021.
During the March 2020 market turmoil, investment funds shed assets on a large scale – but was this selling commensurate with the outflows they faced or was it much larger? This box finds evidence of the latter, highlighting that the less regulated non-UCITS funds tended to engage in more procyclical selling and cash hoarding than UCITS funds.[1] While it can be rational for fund managers individually to sell assets in excess of current outflows when uncertainty about future redemptions is high, such cash hoarding may be detrimental to the stability of financial markets from a macroprudential perspective.[2]
To estimate the extent of excess selling by the investment fund sector, this box introduces a new measure of transactions relative to outflows – a “flow multiplier”. The flow multiplier is defined as the ratio between the fund sector’s (net) transactions in securities and the (net) in/outflows to/from the sector of “external investors” (i.e. investors outside the universe of funds under consideration). If this ratio significantly exceeds one, the procyclical investment behaviour of investment funds is deemed excessive. To account for the fund sector’s buying or selling of shares issued by other funds (“circular investment fund transactions”), the box proposes two versions of the flow multiplier – a narrow and a broad multiplier. The former ignores these intra-fund sector transactions, while the latter includes them in the numerator of the ratio.
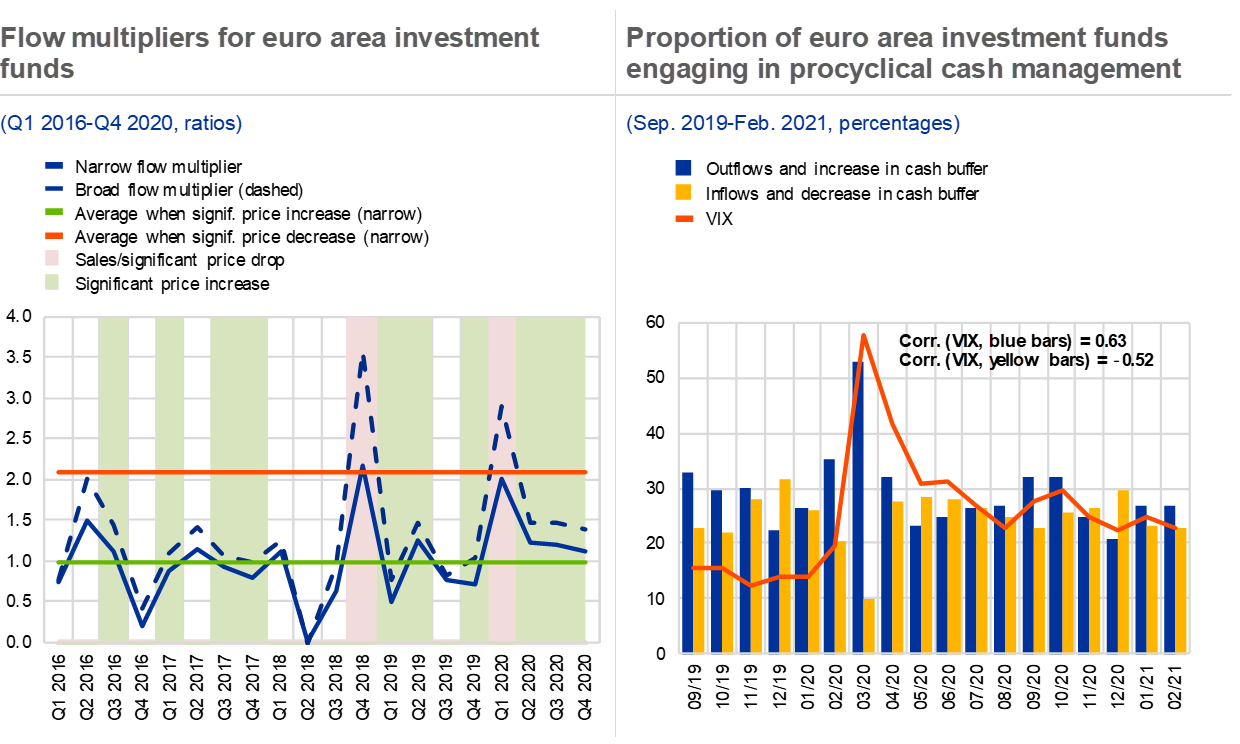
The flow multiplier for euro area investment funds is, on average, close to 1 in good times, but takes on values of between 2 and 3.5 in stressed periods (see Chart A, left panel). This suggests that euro area funds tend to sell up to 3.5 times the volume of securities which investors redeem when markets are stressed. For example, euro area investment funds sold securities worth around €270 billion (including shares issued by other investment funds; see Chart 5.2) in the first quarter of 2020, even though external investors only redeemed around €85 billion.[3]
The excess selling behaviour of funds in market downturns goes hand in hand with procyclical cash hoarding. In the first quarter of 2020, euro area investment funds increased their cash holdings by around €85 billion.[4] Based on a limited sample of funds where daily data on cash holdings are available, more than half of funds increased rather than decreased their cash positions in response to outflows in March 2020, thus amplifying sales in the markets (see Chart A, right panel). By contrast, in times of low market volatility, such as towards the end of 2019, a large proportion of investment funds instead tended to reduce their cash positions amid an increase in inflows. This suggests that funds also engage in procyclical cash management in good times, which can imply a build-up of liquidity risks in such periods (see Section 4.2). In general, procyclical cash hoarding behaviour is highly correlated with financial market uncertainty and volatility as measured by metrics like the VIX.
Chart A
Asset sales and cash hoarding by investment funds during market downturns

Sources: ECB securities holdings statistics by sector, ECB money market statistical reporting (MMSR) dataset, IVF statistics, Refinitiv, Bloomberg L.P. and ECB calculations.
Notes: Left panel: securities include listed equity, debt securities, investment fund shares and MMF shares. Ratios are between total net transactions in securities by euro area investment funds and total net transactions of euro area fund shares by other sectors (“external investors”). Other sectors refer to all non-euro area investors and euro area sectors except the fund sector. The (narrow) broad multiplier (does not include) includes transactions in shares issued by euro area funds in the numerator of the ratio. Price increases/decreases are considered significant when the absolute quarterly price change of euro area investment fund portfolios (excluding euro area fund shares) exceeds 2%. Right panel: the sample of funds is restricted to up to 652 bond, equity and mixed funds which place their cash holdings with the banks reporting MMSR data and are available in the Refinitiv Lipper database. The spike for the March turmoil period can be observed for all three different fund types individually. Cash holdings mainly consist of deposits, call accounts, call money and repos. VIX: CBOE Volatility Index.
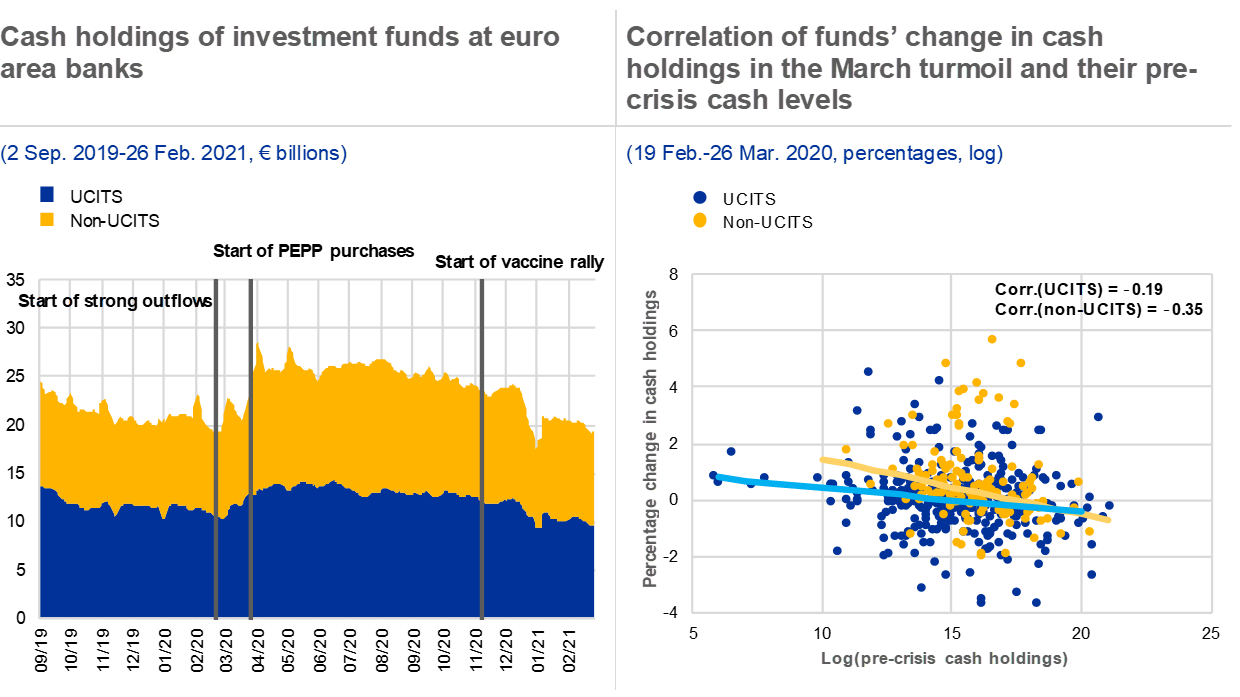
Investment fund cash hoarding during the March 2020 market turmoil was largely driven by the less regulated non-UCITS funds and those with smaller cash positions going into the crisis (see Chart B). Overall, cash placed with selected euro area banks by a sample of around 1,500 funds increased from approximately €20 billion to around €28 billion between mid-February and the end of March 2020.[5] Non-UCITS funds increased their cash holdings by 64%, compared with a more muted increase of 19% for UCITS funds (see Chart B, left panel). In addition, smaller pre-crisis cash positions were correlated with stronger cash hoarding, with the relationship being stronger for non-UCITS funds (see Chart B, right panel).[6]
Chart B
Cash hoarding behaviour during the March market turmoil was more prevalent among less regulated non-UCITS funds, while funds with higher pre-crisis cash positions behaved less procyclically

Sources: ECB money market statistical reporting (MMSR) dataset, IVF statistics and ECB calculations.
Notes: Cash holdings mainly consist of deposits, call accounts, call money and repos. The sample of funds is restricted to bond, equity and mixed euro area funds which place their cash holdings with the banks reporting MMSR data. Left panel: the sample consists of around 1,500 mostly open-ended funds (coverage differs slightly by date). Overall developments in cash holdings are a good match with those of the wider universe (see Chart 4.5, left panel). Funds for which information on regulation is missing are excluded. The dynamics in cash holdings are driven by bond and mixed funds. A five-day moving average is applied for smoothing purposes. Right panel: the percentage change in cash holdings is calculated for the period between 19 February and 26 March 2020, while for pre-crisis cash holdings it is calculated on 19 February 2020. The regression lines and correlations shown in the chart are calculated based on the actual data. Start and end point of the lines are indicative. The dots display randomly drawn data points based on the actual data distributions and were added for illustrative purposes due to confidentiality restrictions of the actual data. The differences in correlations between UCITS and non-UCITS funds are robust for the three different fund types. The sample consists of 524 funds. PEPP: pandemic emergency purchase programme; UCITS: undertakings for collective investment in transferable securities.
These findings suggest the need to consider a macroprudential approach to mitigate risks arising from such procyclical behaviour. This box shows that investment funds generally behave procyclically through excess asset selling and cash hoarding in periods of market stress. Funds with relatively high cash positions tend to hoard less cash amid market turmoil. Moreover, the degree of cash hoarding differs across regulatory fund types: UCITS funds engaged in relatively less procyclical cash hoarding than non-UCITS funds. To the extent that such procyclical behaviour generates significant wider spillovers, these results strengthen the case for considering enhanced liquidity requirements for investment funds from a macroprudential perspective (see also Section 5.2).[7] Further analysis would be required, for instance, to identify the extent to which structural factors such as the differences in the portfolio composition or leverage of UCITS and non-UCITS funds influence their procyclicality, and to consider the potential costs and unintended consequences of possible regulatory measures.
- The classification of funds as UCITS and non-UCITS depends on whether they fall under the EU Directive on undertakings for collective investment in transferable securities (UCITS). UCITS funds are mutual funds that can be sold to retail investors and are perceived as non-speculative, diversified and well-regulated investments.
- Morris, S., Shim, I. and Shin, H.S., “Redemption risk and cash hoarding by asset managers”, Journal of Monetary Economics, Vol. 89, April 2017, pp. 71-87, show that cash hoarding behaviour is pervasive among fund managers when they face redemptions. For more recent evidence, see also Schrimpf, A., Shim I. and Shin, H.S., “Liquidity management and asset sales by bond funds in the face of investor redemptions in March 2020”, BIS Bulletin, No 29, Bank for International Settlements, March 2021.
- The category of external investors refers to all sectors except for euro area investment funds. The amount is calculated as the sum of sales of euro area investment fund shares by non-euro area investors (€62 billion), euro area insurance corporations and pension funds (€19.5 billion) and other euro area sectors (€3.5 billion). The sector breakdown of non-euro area investors is not available.
- As derived from ECB investment funds balance sheet (IVF) statistics.
- It should be noted that due to differences in samples and reference periods, the increase in cash cannot be compared with the excessive selling described above.
- Schrimpf, A., Shim, I. and Shin, H.S., “Liquidity management and asset sales by bond funds in the face of investor redemptions in March 2020”, BIS Bulletin, No 39, Bank for International Settlements, March 2021 have a related finding for US corporate bond funds and euro area government bond funds.
- See also, for example, “The Behavior of Fixed-income Funds during COVID-19 Market Turmoil”, Global Financial Stability Notes No 2020/02, International Monetary Fund, December 2020, and “Holistic Review of the March Market Turmoil”, Financial Stability Board, November 2020.


