Backcasting real rates and inflation expectations – combining market-based measures with historical data for related variables
Published as part of the ECB Economic Bulletin, Issue 2/2023.
Markets for financial products linked to inflation in the euro area offer valuable insights into market participants’ expectations for inflation and real interest rates, but these financial instruments have only been available since the early 2000s. The yields on inflation-linked bonds (ILBs) and the interest rates on inflation-linked swaps (ILSs) incorporate market participants’ expectations for inflation and real interest rates over periods from one to 30 years. From a central bank’s perspective, the information extracted from these instruments can help to assess the effectiveness of its monetary policy decisions and guide the future course of monetary policy. In the euro area, however, the history of these data spans a very limited number of policy and business cycles, as markets for euro area inflation-linked products emerged only in the early 2000s. This limits the analysis of structural economic relationships.[1]
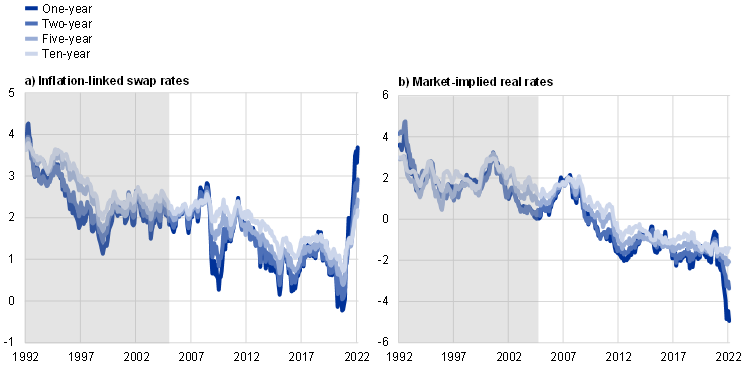
However, the correlation between market-based measures on one side and various economic variables on the other makes it possible to estimate time series for ILS rates and market-implied real rates stretching further back in time, or “backcast” them. These longer time series are constructed by estimating the relationship between ILS rates or market-implied real rates and longer time series of statistical data for variables such as inflation or indicators of economic activity. The starting point for the backcasting exercise is a set of 108 variables, dating back to at least 1992, that may provide information about inflation compensation and real rates.[2] On the basis of a statistical model[3] and economic judgement, the time series deemed most useful for generating the historical proxies are selected from the pool. These include year-on-year inflation in the euro area, growth in industrial production, observed short-term real rates (nominal short-term rates minus realised inflation), a measure of the output gap, survey information on inflation and real rate expectations, several bond yields and indicators of economic policy uncertainty. By assuming (and testing) that the statistical relationship between these times series and ILS rates or market-implied real rates is stable over time, the latter can be backcasted, i.e. an estimate of their values produced for periods before they were available.[4] Results from this exercise are shown in Chart A. The backcasted series indicate the broad contours of inflation compensation and real rates for various maturities over a period where real-time market-based measures were not yet available. This could shed light, for example, on whether trends observed when market-based indicators were available were already in place in the past. More generally, the long estimated time series for inflation compensation and real rates can be used as input into econometric analysis and for illustrating stylised facts and historical patterns. At the same time, the “quasi-historical” time series should be interpreted with care, and small fluctuations over short time periods should not be overinterpreted.
Chart A
Backcasted euro area inflation-linked swap rates and market-implied real rates
(percentages per annum)
Sources: Refinitiv, Bloomberg, OECD, Consensus Economics, Eurostat, Baker, Bloom and Davis[5], and ECB calculations.
Notes: The data series show fitted values. The shaded areas mark the period for which euro area ILS rates and real rates have been backcasted (January 1992 to March 2005). The latest observations are for February 2022.
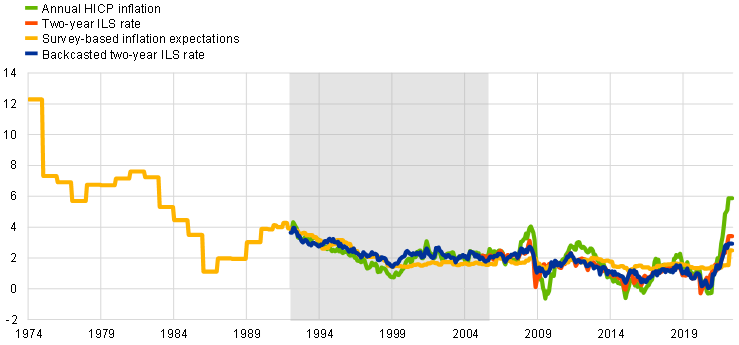
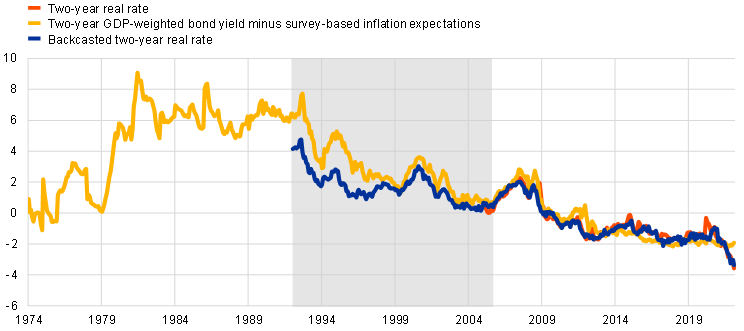
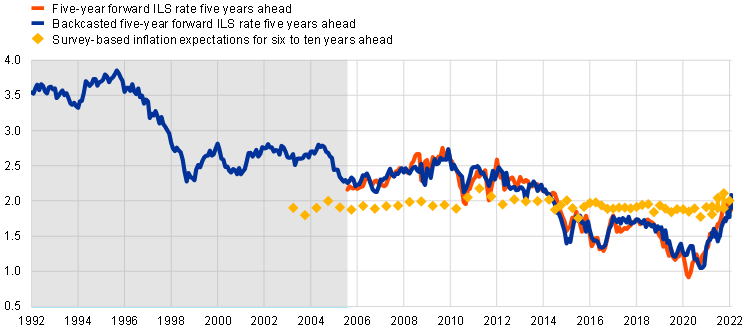
The ILS and real rate series implied by models fit observed time series reasonably well (Charts B and C). Moreover, for shorter swap maturities, backcasted ILS rates are broadly in line with survey-based measures of inflation expectations obtained from Consensus Economics as well as from the OECD Economic Outlook, i.e. backcasted dynamics appear plausible against these yardsticks (Chart B).[6] At longer maturities the backcasted series deviate considerably from survey-based measures of inflation expectations (Chart C). This is not per se an indication of a misfit, however, and is in line with results in the literature suggesting that long-term market-based measures of inflation expectations include a sizeable risk premium.[7] Survey information is, by contrast, generally considered to exclude risk premia.[8] The results for backcasted market-implied real rates fit observed series equally well. Here too, shorter maturities are broadly in line with measures of inflation expectations obtained from survey data in combination with nominal yield data.
Chart B
Fit of two-year euro area inflation-linked swap and market-implied real rates with survey-based inflation expectations
a) Inflation compensation
(percentages per annum)
b) Real rates
(percentages per annum)
Sources: Refinitiv, Bloomberg, OECD, Consensus Economics, Eurostat, Baker, Bloom and Davis, and ECB calculations.
Notes: The shaded areas mark the sample for which euro area ILS rates and real rates have been backcasted (January 1992 to March 2005). Survey-based inflation expectations are from the OECD Economic outlook and Consensus Economics. The latest observations are for February 2022.
Chart C
Fit of euro area five-year forward inflation-linked swap rate five years ahead with survey-based inflation expectations
(percentages per annum)
Sources: Refinitiv, Bloomberg, OECD, Consensus Economics, Eurostat, Baker, Bloom and Davis, and ECB calculations.
Notes: The shaded area marks the sample for which euro area ILS rates and real rates have been backcasted (January 1992 to March 2005). Survey-based inflation expectations are from Consensus Economics. The latest observations are for February 2022.
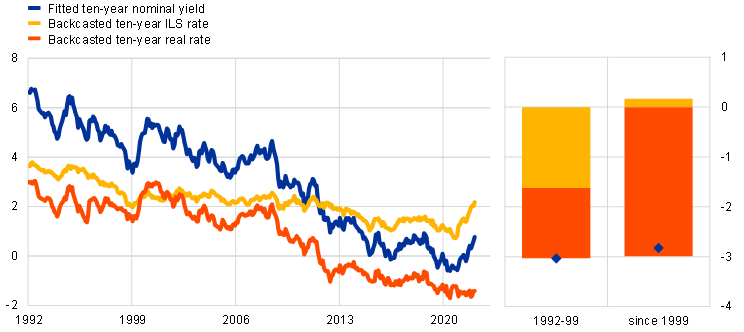
Backcasted series suggest that the observed trend decline in long-term nominal risk-free rates in the run-up to the introduction of the euro in 1999 reflected both lower inflation compensation and lower market-implied real rates, which later explain most of the decline in nominal rates since 1999 (Chart D). The decline in the backcasted ILS rates in the 1990s is in line with the decrease in headline inflation across countries that would later be part of the euro area. However, lower and at the same time more stable inflation was also a global phenomenon observed in the context of the Great Moderation that is often linked to more effective monetary policy.[9] These developments were accompanied by a broad decline in nominal interest rates in the future euro area in the run-up to the creation of the euro, which according to the backcasted series of ILS and market-implied real rates reflected lower inflation compensation and lower real rates in equal parts. During the early years after the inception of the euro, both the backcasted ILS rates and backcasted market-implied real rates remain fairly stable, but subsequently decline significantly further: first in 2008 in the context of the global financial crisis and then during the low inflation period between 2013 and the pandemic crisis in 2020-21. However, while ILS rates have now recovered from their declines and returned to levels closer to 2%, implied real rates remain at historically low levels, in line with a more permanent decline in the natural rate of interest.[10]
Chart D
Decomposition of the nominal ten-year euro area risk-free yield into an inflation component and real rates
(percentages per annum)
Sources: Refinitiv, Bloomberg, OECD, Consensus Economics, Eurostat, Baker, Bloom and Davis, and ECB calculations.
Notes: The fitted nominal risk-free yield is computed as the sum of the backcasted and fitted series of the ten-year ILS rate and the backcasted and fitted series of the ten-year market-implied real rate. Ten-year ILS rates and ten-year real rates have been backcasted for the sample January 1992 to March 2005. The change bars in the right-hand panel depict the decomposition of the change in the fitted nominal ten-year yield into an inflation and real rate component for the respective time span. The latest observations are for February 2022.
The analysis in the box is based on euro area ILS rates. While the market for these instruments has existed since the early 2000s, the analysis builds on a sample starting in 2005 only, a time by which the market is considered to have been fully developed. See e.g. Neri, S., Bulligan, G., Cecchetti, S., Corsello, F., Papetti, A., Riggi, M., Rondinelli, C. and Tagliabracci, A., “On the anchoring of inflation expectations in the euro area”, Questioni di Economia e Finanza, No 712, Banca d’Italia, September 2022.
In the case of financial variables, rather than using aggregates based on data for all euro area countries before 1999, the set of variables builds mainly on series for Germany and France.
For a given variable (ILS or real rate for a specific maturity) the selection is based partly on a sequential application of a least absolute shrinkage and selection operator (LASSO) regression.
This approach follows the analyses conducted in Groen, J. and Middeldorp, M., “Creating a History of U.S. Inflation Expectations”, Liberty Street Economics, Federal Reserve Bank of New York, 21 August 2013 and Marshall, W., “Introducing a backcast history of traded inflation”, Global Rates Notes, Goldman Sachs, 2020.
Baker, S.R., Bloom, N. and Davis, S.J., “Measuring Economic Policy Uncertainty”, The Quarterly Journal of Economics, Vol. 131, No 4, November 2016, pp. 1593-1636.
In part, this is of course by construction, since these surveys are also contained in the set of explanatory variables.
See the box entitled “Decomposing market-based measures of inflation compensation into inflation expectations and risk premia”, Economic Bulletin, Issue 8, ECB, 2021.
Moreover, inflation expectations gauged from surveys may in any case differ from those embedded in financial market prices.
See Bernanke, B.S., “The Great Moderation”, in Koenig, E.F., Leeson, R. and Kahn, G.A. (eds.), The Taylor Rule and the Transformation of Monetary Policy, Chapter 6, Hoover Institution Press, Stanford, California, June 2012.
For estimates and a discussion of the drivers of the natural rate of interest, see Brand, C., Bielecki, M. and Penalver, C., “The natural rate of interest: estimates, drivers, and challenges to monetary policy”, Occasional Paper Series, No 217, ECB, December 2018.


