
Market infrastructures form the backbone of the financial system. They provide the networks through which financial institutions and financial markets are connected and financial transactions are cleared and settled. Therefore, it is essential to ensure that market infrastructures are secure and efficient, and that they foster a stable and well-functioning economy. The Eurosystem is closely involved in this work as the conduct of monetary policy depends on the availability of reliable and effective financial market infrastructures, such as TARGET2 (the Trans-European Automated Real-time Gross settlement Express Transfer system for large-value payments), TARGET2‑Securities (for the settlement of securities transactions) and TARGET Instant Payment Settlement (TIPS).
TARGET2‑Securities (T2S) resulted from an initiative to address the highly fragmented securities settlement landscape in Europe. Launched in June 2015 as an integrated platform for processing securities against central bank money, T2S revolutionised securities settlement in Europe by bringing to an end complex cross-border settlement procedure and the difficulties caused by different settlement practices among countries.
Nowadays T2S provides harmonised and commoditised securities settlement to central securities depositories (CSDs) and applies a single set of rules, standards and tariffs to all participant CSDs. The securities settlement platform thereby lays the foundations for a single market for securities settlement and, as a result, contributes to achieving greater integration of Europe’s financial market. Today the T2S platform connects 21 CSDs from 20 European markets and processes on average almost 700,000 securities transactions per day against both euro and Danish krone.
The report and its structure
This is the tenth edition of the TARGET2‑Securities Annual Report, covering the third full year after the end of the T2S migration period. The first edition was published in 2011, a pivotal year for the finalisation of the legal and technical documentation of T2S and for the CSDs’ preparation of their T2S adaptation plans.
This year the report presents the evolution of T2S settlement data, while confirming the continuity of operational stability and efficiency. It also describes the developments which took place in T2S in the course of 2020, as well as some of the main incidents affecting the platform throughout the year. The report is mainly addressed to decision-makers, financial experts, lawyers and academics wishing to acquire an in-depth understanding of T2S and its functioning. It will hopefully also appeal to the general public with an interest in market infrastructure issues and T2S in particular.
In addition to the core content, and in line with previous reports, three boxes are also included that provide detailed information on topics of relevance in 2020. The boxes focus on the topics relevant to T2S discussed in the Market Settlement Efficiency Workshop IV, the impact of change request CR 691 (“Recycling period of 60 business days for matched instructions”) on T2S traffic and the latest changes in T2S in view of the CSDR[1] settlement discipline regime, which is expected to enter into force in February 2022.
TARGET2-Securites activity
As anticipated in last year’s report, 2020 saw the introduction of the new T2S statistical framework.[2] The new framework aims at providing more business-oriented indicators while:
- excluding transactions automatically generated by the system (such as realignment instructions) from the calculation of the traffic figures;
- excluding liquidity transfers, including those from and to the real-time gross settlement (RTGS) dedicated cash accounts (DCAs), from the calculation of the traffic figures and from the settlement efficiency indicator;
- excluding transactions related to corporate actions from the calculation of the settlement efficiency indicator;
- but including party-on-hold transactions in the calculation of the settlement efficiency indicator.
This therefore makes it difficult to compare 2019 and 2020 figures for T2S and explains possible gaps between the two sets of data.
In 2020 T2S settled a total of 176,681,247 transactions, which corresponds to an average of 687,476 transactions per day. These figures are 14.16% higher compared with 2019. The highest T2S daily volume of the year was registered on 16 March 2020, when 1,088,815 transactions were processed; conversely, the lowest T2S daily volume was registered on 3 January 2020 with a total of 258,725 transactions. In terms of value, T2S settled transactions with a total value of €172,840.86 billion in 2020, which corresponds to a daily average value of €672.53 billion. The decrease of 38.72% compared with the previous year can be directly attributed to the change to the statistical framework, as it excludes liquidity transfers which are low in volume but relatively high in value.
In 2020 the share of transactions settled during night-time settlement (NTS) was 52.96% in volume terms and 38.33% in value terms. Transactions settled during real-time settlement (RTS)accounted for 47.02% in terms of volume and 61.67% in terms of value.
The most prevalent form of transaction settled on the platform is delivery-versus payment (DVP), which accounted for 72.34% of the total traffic and a daily average of 497,348 transactions in 2020. DVP also leads the rankings in terms of value with 96.38% of the total traffic and a daily average of €648.20 billion.
T2S volume and value developments in 2020
Charts 1 and 2 show the volume and value of T2S traffic over the last five years. Compared with 2019, average monthly volumes were 14.16% higher in 2020, while the average monthly value decreased by 38.72%. This was in part due to the aforesaid change to the methodology, but a huge impact was also observed at the beginning of the coronavirus (COVID-19) pandemic (in March 2020): despite the increase in the total number of transactions, the average value of each transaction declined considerably, reflecting both the impact of the new methodology and the turbulence in the securities market caused by the global pandemic. Indeed, monthly volumes reached new record highs in 2020, with a peak of over 20 million transactions in March – more than one-third higher than the peak reached in 2019 (which was around 14 million transactions in May).
Chart 1
Evolution of volume in T2S
(left-hand scale: number of transactions (millions), monthly totals; right-hand scale: settlement efficiency in percentages)

Notes: Migration wave 1 refers to 22 June‑31 August 2015; wave 2 refers to 29 March 2016; wave 3 refers to 12 September 2016; wave 4 refers to 6 February 2017; and final wave refers to 18 September 2017. NCDCP (Slovakian CSD) joined on 27 October 2017; settlement in Danish kroner (DKK) available and ID2S (French CSD) joined on 29 October 2018.
Chart 2
Evolution of value in T2S
(left-hand scale: EUR trillions, monthly totals; right-hand scale: settlement efficiency in percentages)

Notes: For details, see the notes to Chart 1. Migration wave 1: 22 June-31 August 2015; wave 2: 29 March 2016; wave 3: 12 September 2016; wave 4: 6 February 2017; final wave: 18 September 2017; NCDCP: 27 October 2017; DKK, ID2S: 29 October 2018.
1 Evolution of T2S settlement data in 2020[3]
Table 1 provides an overview of traffic developments in T2S in 2020 compared with 2019. The introduction of the new statistical framework for T2S in 2020, which excludes, among others, transactions automatically generated by the system and liquidity transfers (see Box 1 of the 2019 Report), influences the data comparison between 2020 and previous years.
Table 1
Evolution of T2S settlement data and settlement efficiency

Notes: There were 255 operating days in 2019 and 257 operating days in 2020. Settlement efficiency is computed for 2019 using the platform settlement efficiency methodology and for 2020 using the Data Access Task Force (DATF) methodology.
In 2020 T2S settled 176,681,247 transactions, with a total value of €172.84 trillion. This corresponded to a daily average of 687,476 transactions, with a daily average value of €672.53 billion. Compared with the previous year, there was a decrease of 38.72% in terms of value, mainly because of the impact of the exclusion of liquidity transfers on T2S volumes and values. At the same time, there was an increase of 14.16% in terms of volume, mainly driven by a higher traffic of data during the first months of the COVID‑19 pandemic.
Settlement efficiency reached an average of 94.35% in terms of value and 94.51% in terms of volume in 2020. This represented a decrease of 3.36 percentage points in terms of value and 2.50 percentage points in terms of volume compared with 2019. The decrease is mainly attributable to instructions put on hold by the participants (“party-on-hold” transactions) being included as unsettled transactions in the calculation of settlement efficiency, as part of the changes to the statistical framework.[4] The traffic developments at the beginning of the COVID‑19 pandemic further contributed to the overall decrease.
1.1 Volume of settlements in T2S
In 2020 T2S settled on average 687,476 transactions per day. Chart 3 shows the evolution of daily average T2S traffic in volume terms. The daily average volume per month ranged from 585,720 (in January) to 919,660 (in March). The highest daily volume settled was on 16 March (1,088,815 transactions) and the lowest was on 3 January (258,725 transactions). The daily average settled volume reached an all-time high in March as a result of the outbreak of the COVID-19 pandemic worldwide. The impact is visible in many of the statistics presented in this report.
Chart 3
Volumes of settled T2S transactions in 2020
(number of transactions (thousands), daily averages)

Real-time settlement and night-time settlement
In T2S the new business day starts at 18:45 CET in the evening of the previous day with the preparation for NTS. NTS processing starts at 20:00 CET and runs on average until 22:00 CET. It consists of two cycles. The first cycle is subdivided into five sequences and the second cycle into four sequences. Within the different sequences certain transaction or instruction types are settled. At the end of the second cycle T2S submits, for partial settlement, all eligible transactions for which settlement failed in an earlier attempt in the same evening.
After the end of NTS there is a short preparation period for RTS, followed by the first RTS phase that runs until the opening of the daily (or weekly on Saturdays) technical maintenance window. The window is open from 03:00 CET to 05:00 CET. During this time T2S is closed for all settlement activities.
The closing of the technical maintenance window is followed by a second RTS phase, which includes five partial settlement windows, at 08:00 CET, 10:00 CET, 12:00 CET, 14:00 CET and 15:45 CET. In each partial settlement window, T2S partially settles new settlement instructions arriving in T2S that are eligible for partial settlement, as well as previously unprocessed or partially processed settlement instructions eligible for partial settlement. The first at 08:00 CET and last partial settlement windows at 15:45 CET have a duration of 30 minutes each, while the others each have a duration of 15 minutes. RTS is concluded with the end of RTS at 18:00 CET.
In 2020 there were 14,723,437 transactions settled on average each month. Chart 4 shows total monthly traffic in volume terms, broken down by NTS and RTS. The total monthly traffic ranged between a low of 12,487,334 transactions in August and a high of 20,232,528 transactions in March.
Chart 4
NTS and RTS volumes in 2020
(number of transactions (millions), monthly totals)

As depicted in the chart, there is little variation in the share of the total volume settled in NTS and RTS each month in 2020. NTS accounted for 52.98% of the overall volume, while RTS accounted for 47.02%. In 2019 monthly traffic was slightly more evenly distributed between NTS (49.97%) and RTS (50.03%). In absolute terms, the monthly volumes settled in NTS and RTS both reached a peak in March, with 10,883,620 and 9,348,908 transactions respectively. Conversely, in percentage terms, the peak volume settled in NTS was in October (53.89%), whereas the peak volume settled in RTS was in June (49.09%). In volume terms, DVP transactions, which account for the majority of T2S traffic, were settled mostly during the NTS cycles (61.95%).
Five transaction categories make up the T2S volumes: DVP, free-of-payment (FOP), payment-free-of-delivery (PFOD), settlement restriction on securities (SRSE) and delivery-with-payment (DWP).[5] Chart 5 displays the T2S total traffic broken down by transaction type.
Chart 5
Settlement volume by transaction type in 2020
(percentages, yearly totals)

Note: The category “Other” includes PFOD, SRSE and DWP.
In 2020 DVP and FOP transactions were the largest contributors to T2S traffic, together representing around 97.24% of the T2S total settled volumes. DVP transactions accounted for most of the total T2S volumes, with 72.34% (corresponding to a daily average of 497,348 transactions). FOP transactions represented 24.89% of the total T2S volumes (corresponding to a daily average of 171,128 transactions). PFOD transactions, SRSE transactions and DWP transactions together accounted for 2.76% of the total volumes (corresponding to a daily average of 18,999 transactions). The percentage contribution of each transaction type relative to the overall volume is consistent with the pattern observed in previous years.
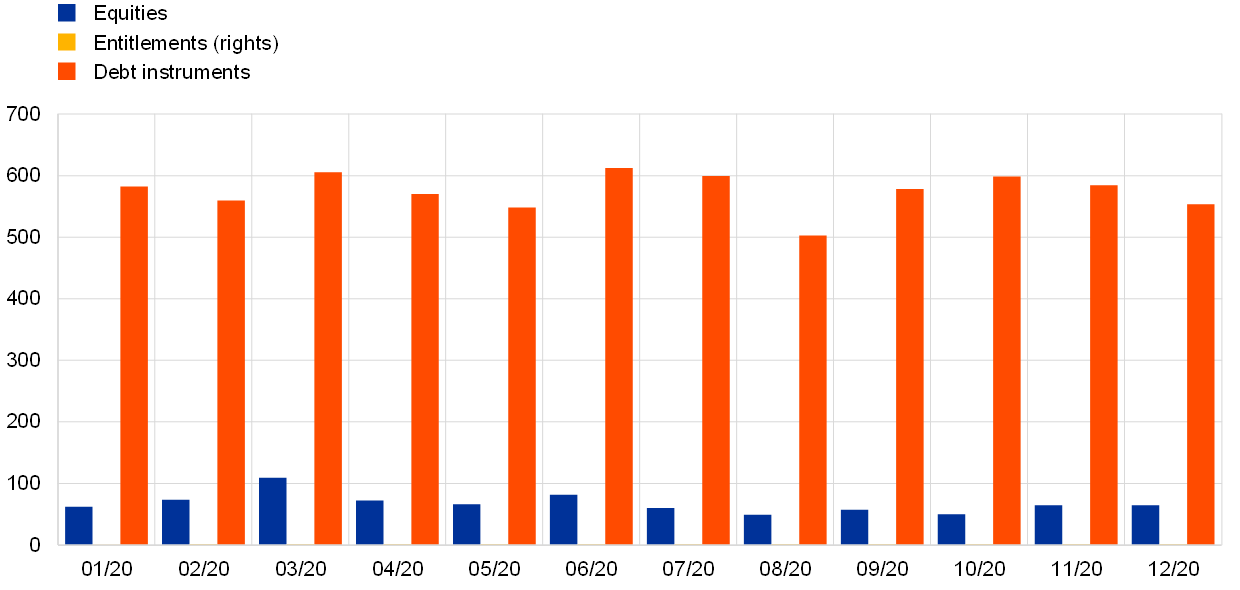
The three largest securities categories contributing to T2S traffic in terms of volume are equities, entitlements (rights) and debt instruments. Chart 6 shows the daily average volume settled for each of these three categories. In line with previous years, in 2020 equities represented the largest share of overall T2S traffic with a daily average volume of 402,318 transactions (58.52%), followed by entitlements (rights) with 180,551 (26.26%) and debt instruments with 65,782 (9.57%). The remaining share (5.65%) is attributable to other types of security.
Chart 6
Volume by securities category in 2020
(number of transactions, daily averages)

The daily average volume of equity transactions in 2020 ranged between a low of 345,463 (in October) and a high of 546,598 transactions (in March). The daily average volume of entitlements (rights) ranged between 131,390 transactions (in January) and 254,795 (in March). The daily average volume of debt instruments ranged between 53,683 transactions (in August) and 81,108 (in May). Throughout the year equities consistently accounted for by far the largest volume, followed by entitlements and then debt instruments.
1.2 Value of settlements in T2S
In 2020 T2S settled an average of €672.53 billion per day. Chart 7 shows the evolution of daily average T2S traffic in value terms.[6]
Chart 7
Values of settled T2S transactions in 2020
(EUR billions, daily averages)

August was the month with the lowest daily average value at €567.31 billion, which was 15.65% lower than the annual average. The highest daily value was recorded on 1 October (€931.42 billion) and the lowest on 29 December (€411.37 billion). Comparing Chart 7 with Chart 3, the month in which the highest daily traffic occurred is different for volume (March) and value (October). This is also the case for the month in which the lowest daily traffic occurred (January for volume and December for value).
In 2020 T2S settled transactions with an average monthly value of €14,403.40 billion. Chart 8 depicts total monthly traffic in terms of value, broken down by NTS and RTS. Total monthly traffic ranged between a low of €11,913.59 billion in August and a high of €16,784.02 billion in March.
Chart 8
NTS and RTS values in 2020
(EUR billions, monthly totals)

On average, traffic settled in RTS accounted for 61.67% of overall traffic in value terms in 2020, compared with 38.33% settled in NTS. As can be seen in Chart 4, settlement was more balanced between RTS and NTS in volume terms (47.02% and 52.98%, respectively). This indicates that the RTS phases were more value-intensive than volume-intensive and characterised by transactions with a higher average value than in the NTS cycles. In contrast, the NTS cycles were more volume-intensive than value-intensive.
In absolute terms, the monthly values settled in both NTS and RTS in 2020 reached their peak in March, at €6,492.56 billion and €10,291.46 billion respectively. As a percentage of the total monthly value, the peak value settled in NTS was in January (40.81%), whereas the peak value settled in RTS was in November (63.37%). 61.65% of the total value of DVP transactions, which represented the majority of overall T2S traffic, was settled in RTS.
Three transaction categories make up settlement values in T2S, namely DVP, DWP and PFOD, compared with five categories for volumes.[7] Chart 9 illustrates the total value settled in T2S by transaction type in 2020.
Chart 9
Settlement value by transaction type in 2020
(percentages, yearly totals)

Note: The category “Other” includes PFOD and DWP.
As with volumes (see Chart 5), DVP represented the largest transaction type in value terms in 2020. DVP transactions were on average the largest contributor to the T2S traffic, accounting for 96.38% (corresponding to a daily average of €648.20 billion). PFOD and DWP transactions together accounted for only 3.62% (corresponding to a daily average of €24.33 billion) of the total value settled.
As in the case of volumes, the three largest securities categories contributing to T2S traffic in terms of value are equities, entitlements (rights) and debt instruments. Chart 10 shows the daily average value settled for these three types of security in 2020. Debt instruments were by far the largest securities category in overall T2S traffic in value terms, with a daily average of €575.32 billion (85.55%), followed by equities with €67.41 billion (10.02%) and entitlements (rights) with €1.01 billion (0.15%). The remaining share (4.28%) is attributable to other types of security.
Chart 10
Value by securities category in 2020
(EUR billions, daily averages)
Note: Owing to the much lower values of entitlements (rights) settlements compared with the other two categories, the amounts are barely visible on the chart.
Unlike in Chart 6, where equities are the largest securities category in volume terms, they are only the second largest in value terms, whereas debt instruments are by far the largest category in value terms but are only the third largest in volume terms. This suggests that, on average, equity transactions have a much lower average value than debt instrument transactions. Like equities, entitlements (rights) also contribute far more to settlement volumes than to values.
1.3 Settlement efficiency
Settlement efficiency measures the efficiency of the settlement engine of the T2S platform. It compares the volume (or value) of transactions that are settled on a given day to the total volume (or value) of transactions eligible for settlement on that day. Until December 2019 settlement efficiency was computed in terms of platform settlement efficiency. The platform settlement efficiency indicator (PSEI) focused on the ability of the T2S platform to process transactions and helped determine whether T2S was performing as expected in terms of system configuration and performance of the optimisation algorithms. It thus comprised all settlement activities, including those automatically generated by T2S. Starting in January 2020 settlement efficiency is computed in terms of market settlement efficiency. The market settlement efficiency indicator (MSEI) aims at capturing the behaviour of T2S participants. Consequently, it mainly excludes transactions that are internally generated by T2S, transactions related to corporate actions and liquidity transfers from the calculation; however, it does include party-on-hold transactions).
Charts 11 and 12 show the evolution of the MSEI in 2020, at end-of-day (EOD) and after NTS respectively.
Chart 11
Settlement efficiency at end-of-day in 2020
(percentages, at end-of-day)
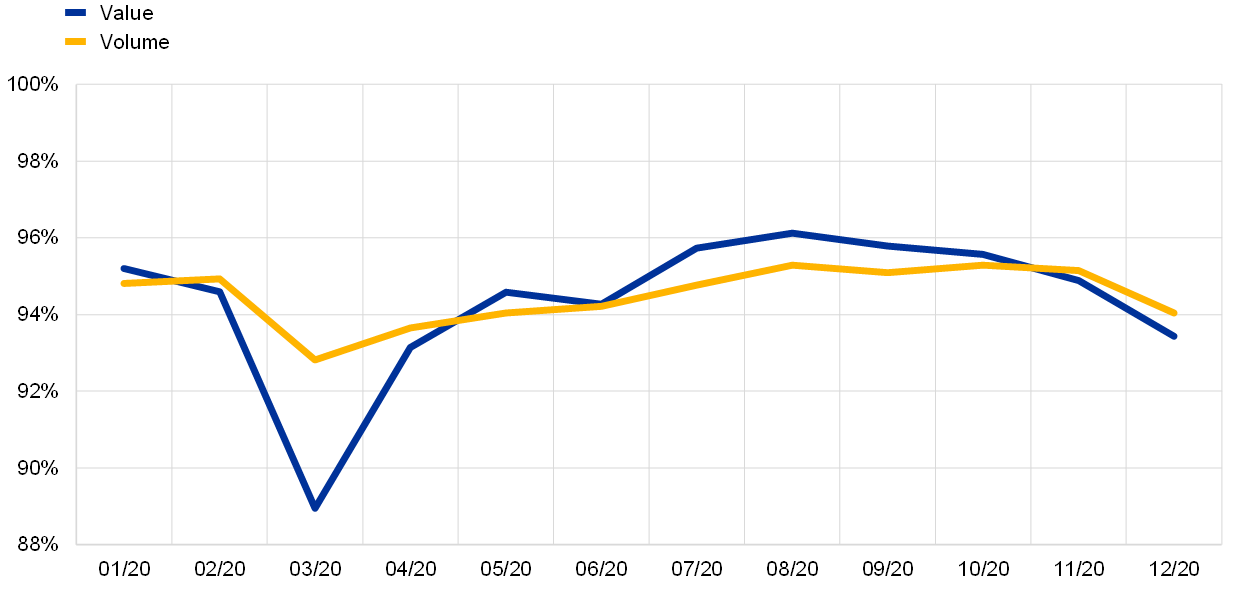
In 2020 settlement efficiency at end-of-day in volume terms ranged between 92.81% and 95.29%, as illustrated in Chart 11. In value terms, it displayed more volatility, ranging between 88.95% and 96.12%. This is in line with the 2019 calculation when MSEI at end-of-day averaged 93.27% in volume terms and 93.44% in value terms. With the beginning of the COVID-19 pandemic, settlement efficiency plunged to 88.95% in value terms and 92.81% in volume terms in March, followed by 93.14% in value terms and 93.65% in volume terms in April. These results were mainly due to a significant increase in the total value (+10%) and volume (+30%) of unsettled transactions in T2S in March 2020 compared with February 2020.
Chart 12
Settlement efficiency after NTS in 2020
(percentages, after NTS)

In 2020 the average settlement efficiency after NTS reached 67.85% in volume terms and 46.75% in value terms (see Chart 12). The lowest value of settlement efficiency after NTS was observed in March, when it reached 43.57% in value terms.
Box 1
Market Settlement Efficiency Workshop IV
The analysis of settlement efficiency topics continued in 2020. A fourth dedicated workshop took place in October. One of the aims was to discuss a measure of settlement efficiency in line with the CSD Regulation (CSDR) settlement discipline regime, which intends to introduce harmonised measures at the EU level to address settlement fails. To support CSDs in their preparations, a settlement efficiency indicator in line with the CSDR guidelines was designed and compared with the platform settlement efficiency indicator (PSEI) and the market settlement efficiency indicator[8] (MSEI) for the reference month of February 2020. Using the CSDR methodology, all on-hold transactions[9] and late matching transactions in T2S were included in the calculation of this new indicator, which was moreover computed by asset class.
The on-hold functionality is a risk management tool available to T2S actors to ensure that the resources are available for settlement before releasing a settlement instruction. When a transaction is on hold, T2S does not attempt to settle it until it is released. On-hold transactions are expected to have a negative impact on settlement efficiency, because they count as unsettled transactions.
Late matching transactions (LMT) are transactions that are matched either after their cut-off on the intended settlement day (ISD) has been reached or after their ISD. The delay is measured in terms of the number of business days between the matching timestamp and the ISD. In the reference month of February 2020 most transactions in T2S matched within the first five business days after their ISD, with 60% being matched one day after their ISD. Similar to on-hold transactions, late matching transactions are considered unsettled, thus having a negative impact on settlement efficiency.
The settlement efficiency rate computed in accordance with the CSDR guidelines is lower than the PSEI and the MSEI indicators. Chart A shows the evolution of the PSEI, the MSEI, the CSDR indicator including on-hold transactions only (“CSDR”) and the CSDR indicator including both on-hold and late matching transactions (“CSDR incl. LMT”), in volume and value terms, in February 2020. As can be seen, the PSEI stood at 97.08% in volume terms and 97.57% in value terms on average. In volume terms, the MSEI stood at 94.93%, whereas the CSDR indicator stood at 90.75%. This is due to the inclusion of a broader set of on-hold transactions in the CSDR indicator compared with the MSEI. In volume terms, this translates to a downward shift, as the denominator of the CSDR indicator is larger since it includes in addition all on-hold transactions. The CSDR indicator reached an average of 89.21% when late matching transactions were also included. In value terms, the MSEI and the two CSDR indicators display less heterogeneity. The MSEI stood at 94.59% on average, compared with 94.29% for the CSDR rate including on-hold transactions only and 93.81% for the CSDR rate including both on-hold and late matching transactions. The reason for this is that on-hold transactions are mainly represented by FOP transactions, which do not imply a cash movement on a DCA and consequently do not contribute to the calculation of value-based statistics.
Chart A
Settlement efficiency rates in volume and value terms by methodology in 2020
(left-hand panel: percentages, daily volumes; right-hand panel: percentages, daily values)

Note: The indicators are computed at end of day.
The breakdown of settlement efficiency by asset class makes it possible to detect whether some structural differences exist between the different types of asset class. Chart B shows the CSDR settlement efficiency rate of the three main types of asset class by settled volumes in T2S, namely equities, debt and entitlements (rights), for the reference month of February 2020. In volume terms, the settlement efficiency of the selected asset classes was rather stable, standing at 87.7% for equities, 92.01% for debt and 97.87% for entitlements. In value terms, the settlement efficiency rate was quite stable throughout the month for equities and debt (at 82.59% and 94.29% on average respectively), whereas it showed a more erratic pattern for entitlements, ranging between 42.31% and 67.82%.
Chart B
CSDR settlement efficiency rate in volume and value by asset class in 2020
(left-hand panel: percentages, daily volumes; right-hand panel: percentages, daily values)

Notes: the indicators are computed at the end of the day.
Overall, the inclusion of on-hold and late matching transactions has a negative impact on settlement efficiency, leading to a reduction of between 4.18 and 5.72 percentage points in volume terms and between 0.31 and 0.79 percentage points in value terms. The workshop provided market participants with an estimation of the expected decrease in settlement efficiency stemming from the CSDR settlement discipline regime, highlighting existing structural differences in the settlement efficiency of certain asset classes. The methodology will be further refined in the course of 2021.
1.4 Unsettled transactions
Not all transactions offered for processing in T2S are settled on the intended settlement day. This may be, for example, because the resources (cash and securities) needed for settlement are not available or because one of the two instructions underlying the transaction is set to on-hold.
Chart 13 illustrates the daily average volume of unsettled transactions in T2S at the end of the day in 2020. DVP, DWP, PFOD, FOP and SRSE transactions are included in the calculations.
Chart 13
Volume of unsettled transactions in 2020
(number of transactions, daily averages)

In 2020 the daily average number of unsettled transactions reached on average 14,418 transactions. This means that, on a daily average basis, out of the total number of transactions processed by T2S, 5.49% were unsettled at the end of the day. Unsettled transactions reached a high of 23,578 in March, in line with the higher settled volumes observed as a result of the COVID-19 outbreak, whereas they reached a low of 9,377 in October following the implementation of a change request aimed at deleting long-standing unsettled transactions in T2S (see Box 2). DVP and FOP represented around 96.11% of all unsettled transactions in volume terms.
Chart 14 shows the daily average value of unsettled transactions in T2S in 2020. The transaction types contributing to the value are DVP, DWP and PFOD.
Chart 14
Value of unsettled transactions in 2020
(EUR billions, daily averages)

The daily average value of unsettled transactions in T2S in 2020 ranged between €22.49 billion in October and €63.92 billion in March. In line with the developments in volume terms, the highest unsettled values were reached in March, during the first phase of the COVID-19 outbreak, whereas the lowest unsettled values in October are related to a new functionality implemented in the system (see Box 2). DVP represented 82.46% of all unsettled transactions in value terms, followed by PFOD with 17.54%.
At the end of each day the unsettled transactions are not deleted, but automatically postponed by T2S (in technical terms recycled) to the following business day(s). T2S attempts to recycle them for settlement for a period of time known as the recycling period. In other words, the recycling period can be defined as the number of days during which a transaction remains unsettled. Chart 15 shows the share of unsettled transactions and the recycling days required before settling.
Chart 15
Average unsettled transactions per number of recycling days in 2020
(percentages, number of recycling days)

Chart 15 shows that on average 26.28% of unsettled transactions sent for recycling were settled on the following business day in 2020 (first column) and less than half of those (or 12.51% altogether) remained pending for two days before settlement. Only 1.16% remained pending for 16 days (last bar).
Box 2
The impact of change request 691 on T2S traffic
On 5 October 2020 change request 691 (CR 691) was implemented in production in T2S, leading to a maximum recycling period of 60 business days for matched settlement instructions. Until then, the recycling period for matched settlement instructions had been unlimited. Over time, this had led to the accumulation of a large number of transactions that remained unsettled for long time periods (referred to as aged transactions). This in turn negatively affected settlement efficiency. With CR 691, matched settlement instructions that are recycled for 60 business days are automatically cancelled by the system. The recycling period starts on the ISD or on the date of the last status change.
Aged transactions were first cancelled during the NTS phase of 5 October 2020. Chart A shows the evolution of unsettled and on-hold transactions between September and October 2020. As expected, on-hold volumes experienced a sharp decrease from 48,988 transactions on 2 October to 37,814 transactions on 5 October. Relative to the total T2S traffic, on-hold transactions decreased from an average of 7.89% between 1 September and 2 October, to 5.92% between 5 and 30 October. Unsettled transactions decreased as well, although to a lesser extent than on-hold transactions, falling from 11,668 transactions on 2 October to 9,677 transactions on 5 October. In relative terms, this translates to a decrease from 1.88% before the implementation of CR 691 to 1.42% after its go-live.
Chart A
Unsettled and on-hold transactions in T2S before and after CR 691
(left-hand scale: on-hold and unsettled transactions; right-hand scale: total number of transactions, at end-of-day)

The impact of CR 691 on settlement efficiency can be estimated by computing the MSEI and the CSDR settlement efficiency rate developed in the context of the Market Settlement Efficiency Workshop IV (see Box 1) before and after CR 691. The MSEI stood at 95.08% on 2 October 2020 and increased to 95.20% on 5 October, whereas the CSDR indicator increased from 90.00% to 92.57%. The reason for the asymmetric impact of the cancellation of aged transactions is that the MSEI considers only party-on-hold transactions, whereas the CSDR indicator includes all on-hold transactions.
In conclusion, the implementation of CR 691 has led to an improvement in the settlement efficiency of T2S and is expected to ensure that the amount of aged transactions in the platform is limited.
1.5 Use of auto-collateralisation
Auto-collateralisation in T2S is an intraday credit operation granted by a central bank that is triggered when a T2S DCA holder does not have enough funds to settle securities transactions. Its ultimate purpose is to improve the buyer’s cash position and secure the funds necessary to settle the transaction. Auto-collateralisation is an automatic process which is aimed at facilitating smooth real-time DVP settlement in central bank money.
Two types of auto-collateralisation are available in T2S:
- Auto-collateralisation on-flow refers to the use of the securities which are about to be purchased as collateral to secure the necessary credit to complete the transaction.
- Auto-collateralisation on-stock is the use of other securities already held by the buyer as collateral to complete the transaction.
In 2020 the overall use of auto-collateralisation reached a daily average value of €103.45 billion. Chart 16 shows the daily average value of auto-collateralisation per month, broken down by type. The daily average use of auto-collateralisation ranged between €90.97 billion in August and €112.73 billion in November.
Chart 16
Auto-collateralisation use by type in 2020
(left-hand scale: EUR billions, daily averages; right-hand scale: number of transactions, daily averages)

Note: The chart shows use of auto-collateralisation by national central banks.
The use of auto-collateralisation largely follows a similar pattern to that observed for the daily DVP transactions settled throughout the year.
On average, 80.13% of the total value of auto-collateralisation was represented by auto-collateralisation on-flow (corresponding to €82.89 billion) and 19.87% by auto-collateralisation on-stock (corresponding to €20.56 billion). In line with 2019, while the use of auto-collateralisation on-stock remained relatively stable in 2020, the use of auto-collateralisation on-flow displayed a more volatile pattern, reaching a peak of €91.63 billion in November. The number of auto-collateralisation transactions ranged between 169,093 (in May) and 237,800 (in March).
In 2020 the overall use of auto-collateralisation on a monthly basis ranged between €1,872.56 billion in May and €2,448.97 billion in October. Chart 17 shows the monthly total value of auto-collateralisation, broken down by RTS and NTS, and the value of auto-collateralisation as a share of DVP transactions.
Chart 17
Real-time and night-time use of auto-collateralisation in 2020
(left-hand scale: EUR billions; right-hand scale: percentages, monthly totals)

Note: The chart shows use of auto-collateralisation by national central banks.
On average, 78.61% of auto-collateralisation was used during RTS (corresponding to €473.96 billion) and 21.39% during NTS (€1,741.50 billion) in 2020. The use of auto-collateralisation in RTS and NTS follows a similar pattern to that of the daily average value of transactions settled in T2S (see Chart 8). Auto-collateralisation use during RTS peaked in October (at €1,924.95 billion), while its use during NTS peaked in June (at €587.93 billion).
In 2020 the use of auto-collateralisation represented on average 15.96% of the total monthly value of DVP transactions settled and remained broadly stable over the year. As the chart shows, auto-collateralisation use as a share of DVP transactions reached its highest point in February (17.20%).
1.6 Other aspects related to settlement in T2S
In order to settle a securities transaction, the delivering and the receiving parties provide the necessary details in the form of settlement instructions. The two settlement instructions have to be compared to ensure that both parties agree on the terms of the transaction. If the comparison is successful, the two settlement instructions are matched, generating a new settlement transaction in T2S. This process can take place either inside T2S in the module performing the validation and matching of individual settlement instructions (life cycle management and matching – LCMM) or outside T2S. In the first case, the settlement instructions are defined as internally matched. In the second case, they are referred to as externally matched.
In 2020 691,990 settlement instructions were matched in T2S on average, compared with 775,020 settlement instructions that were matched outside T2S. Chart 18 compares the number of instructions that were internally and externally matched each month.
Chart 18
Internally and externally matched settlement instructions in 2020
(number of instructions, monthly totals)

Overall, 47.17% of settlement instructions were internally matched, suggesting that slightly more than half (52.83%) reached T2S as already matched.
In T2S there are multiple technical ways in which investors can access different markets linked to T2S. Depending on the number of CSDs involved, it is possible to distinguish between intra-CSD, cross-CSD and external-CSD traffic:
- Intra-CSD traffic refers to securities transfers where the delivering and receiving parties belong to the same CSD.
- Cross-CSD traffic takes place when the delivering and receiving parties belong to different CSDs.
- External-CSD traffic occurs when the delivering and receiving parties belong to different CSDs, one of which is not in T2S.
In T2S, intra-CSD transactions represent most of all settled transactions, in terms of both volume and value.
Chart 19
Intra-CSD settlement in 2020
(percentages, daily averages)

As illustrated in Chart 19, in 2020 the daily average volume of intra-CSD transactions represented 98.63% of all settlement volumes in T2S, while the daily average value of intra-CSD settlement represented 97.26% of all settlement values in T2S.
Only a very small percentage is attributable to cross-CSD traffic. Chart 20 shows the share of cross-CSD transactions compared with total transactions settled in T2S, in terms of daily average volume and value, in 2020.
Chart 20
Cross-CSD settlement in 2020
(percentages, daily averages)
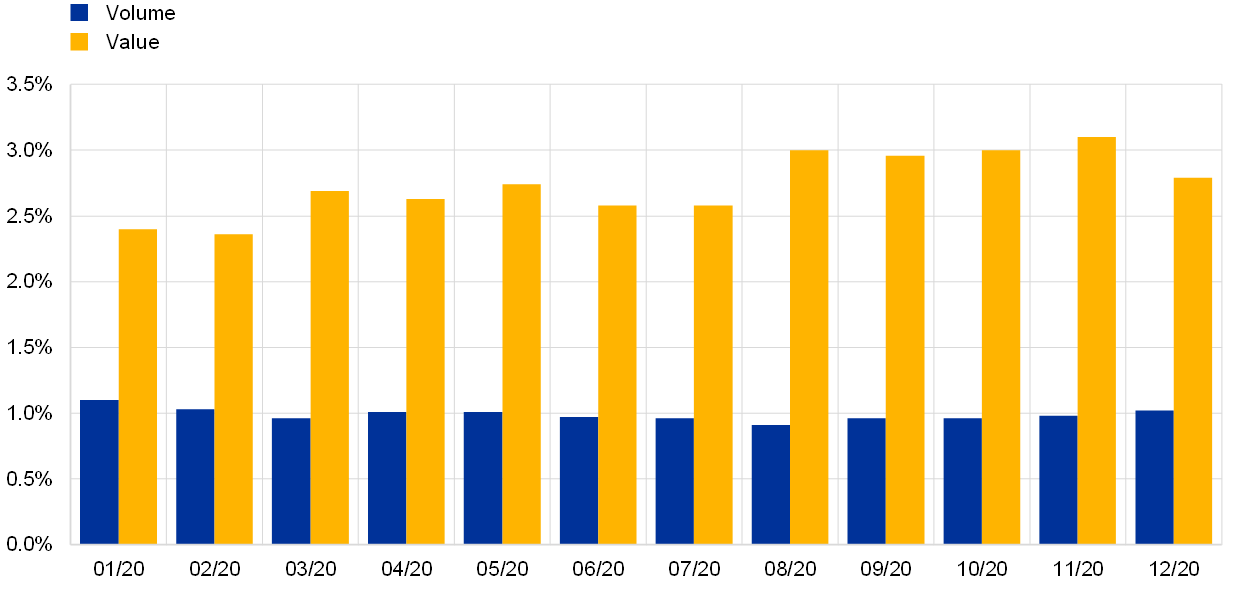
In 2020 the daily average volume of cross-CSD settlement transactions represented 0.99% of all settlement volumes in T2S, while the daily average value of cross-CSD settlement transactions represented 2.74% of all settlement values in T2S.
After further analysis of the low level of cross-CSD market activity in T2S,[10] the following underlying reasons were identified:
- While the consolidation of the domestic markets is still ongoing, the CSDs and their communities have started focusing on other priorities, such as the CSDR. As a result, strategic initiatives, such as developing the use of CSD links or reshaping the operating model for centralising activities for CSD participants, have often slowed or put on hold.
- CSDs currently use T2S to offer an enhanced service to their customers investing across borders. This increases competition and decreases the demand for direct cross-CSD settlement.
Some barriers to cross-border settlement integration remain, but their resolution lies to a great extent outside the competence of T2S stakeholders – e.g. remaining gaps in compliance with corporate action (non-T2S) market standards and lack of harmonisation of withholding tax relief procedures.
Considering that intra-CSD and cross-CSD transactions together accounted for 99.62% of the total volume and 100.00% of the total value, the share of external-CSD settlement was negligible in 2020.
1.7 Interaction between T2S and connected RTGS systems
At the start of each day liquidity is sent from the RTGS accounts in TARGET2 and Kronos2 (see Section 1.7.2) to the DCAs in T2S, while at the end of the day any remaining liquidity on DCAs is returned from T2S to the corresponding RTGS accounts. During the day liquidity can be freely transferred from the RTGS systems to T2S and vice versa.
At the end of the day all T2S DCAs must have a zero balance. Any remaining position is transferred to the respective RTGS accounts via the EOD cash management process (referred to as EOD debits).[11]
Interaction between T2S and TARGET2
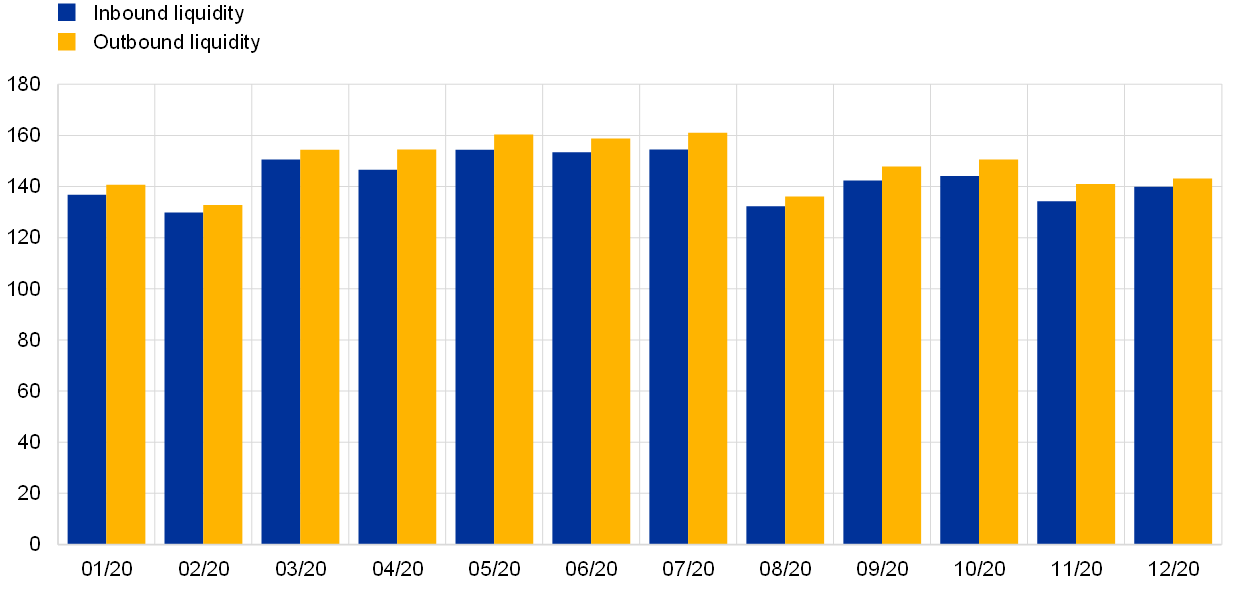
Inbound liquidity transfers are transfers from the TARGET2 RTGS accounts to the T2S DCAs, while outbound liquidity transfers are transfers from the T2S DCAs to the TARGET2 RTGS accounts.
Chart 21 shows the daily average volumes of liquidity transfers between TARGET2 RTGS accounts and T2S DCAs in 2020. The daily average volume of inbound liquidity transfers from TARGET2 was 582, while the daily average volume of outbound liquidity transfers to TARGET2 was 871.
Chart 21
Volume of liquidity transfers between TARGET2 RTGS accounts and T2S DCAs in 2020
(number of transactions, daily averages)
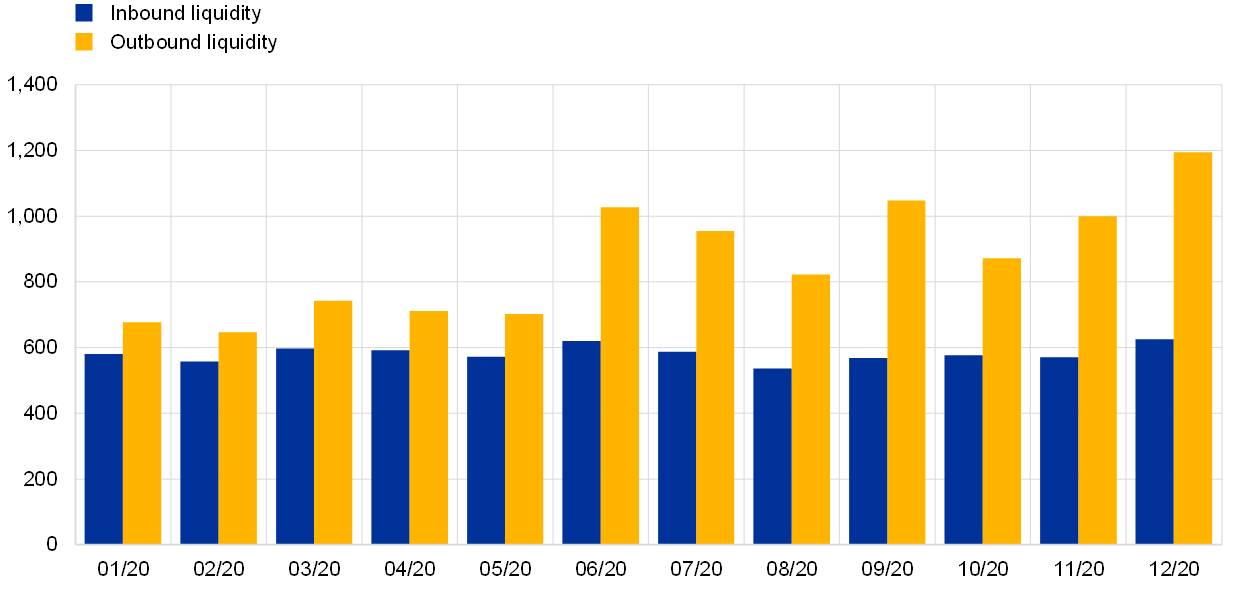
Chart 22 shows the daily average value of liquidity transfers between TARGET2 RTGS accounts and T2S DCAs in 2020. The daily average value of inbound liquidity transfers from TARGET2 was €143.39 billion, while the daily average value of outbound liquidity transfers to TARGET2 was €148.58 billion.
Chart 22
Value of liquidity transfers between TARGET2 RTGS accounts and T2S DCAs in 2020
(EUR billions, daily averages)
At the end of the day any existing difference between inbound and outbound liquidity (see Chart 22) is balanced via the EOD cash management process.
Interaction between T2S and Kronos2
Inbound liquidity transfers are transfers from the Kronos2 RTGS accounts to the T2S DCAs, while outbound liquidity transfers are transfers from the T2S DCAs to the Kronos2 RTGS accounts.[12]
Chart 23 shows the daily average volumes of liquidity transfers between Kronos2 RTGS accounts and T2S DCAs in 2020. The daily average volume of inbound liquidity transfers from Kronos2 was 46 transfers, while the daily average volume of outbound liquidity transfers to Kronos2 was 152 transfers.
Chart 23
Volume of liquidity transfers between Kronos2 accounts and T2S DCAs in 2020
(number of transactions, daily averages)

Chart 24 shows the daily average value of liquidity transfers between Kronos2 RTGS accounts and T2S DCAs in 2020. The daily average value of inbound liquidity transfers from Kronos2 was €2.82 billion, while the daily average value of outbound liquidity transfers to Kronos2 was €2.89 billion.
Chart 24
Value of liquidity transfers between Kronos2 accounts and T2S DCAs in 2020
(EUR billions, daily averages)

As with the interaction between TARGET2 RTGS accounts and T2S DCAs, any difference between inbound and outbound liquidity at the end of the day is balanced via the EOD cash management process.
2 T2S Service level and availability data
2.1 Technical availability
The Eurosystem pays particular attention to the good functioning and operation of the system. The availability of the services is measured continuously and objectively for pre-defined components of T2S, throughout each settlement day, with the exclusion of the maintenance window.
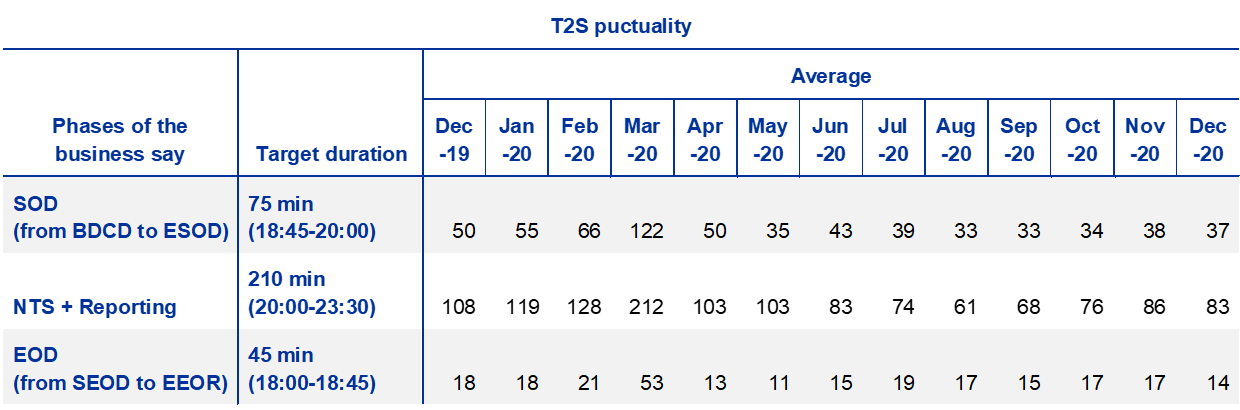
The use of a key performance indicator (KPI) is one of the measures applied to demonstrate how effectively T2S is achieving its punctuality objectives. The punctuality of T2S is measured by calculating the actual duration of three defined phases of the business day and comparing these results against the expected target durations.
The following three phases of the business day are relevant for the calculation of the KPI for duration:
- Start of day (SOD) – that measures the elapsed time between the start-of-day phase (event BDCD) until the end of start of day (event ESOD);
- Night-time settlement including reporting (NTS+reporting) – that measures the elapsed time between the start of NTS (event C1P0) until the end of the NTS reporting (event ENTS);
- End of Day (EOD) – that measures the elapsed time between the start of the end of day phase (event SEOD) until the end of day reports (event EEOR).
Table 2 summarises the actual average duration on a monthly basis of the different phases in a business day, in parallel to the respective target durations. The figures show that the platform operated within the target expectations, except in March 2020 for which the indicators for the SOD, NTS+reporting and EOD show a delay of 47, 2 and 8 minutes respectively.
Table 2
Punctuality
Actual average duration of the three phases on a monthly basis
2.2 Incidents in T2S
The European Central Bank (ECB) is dedicated to ensuring the smooth functioning of the T2S system during normal operations and to steering activities aimed at restoring the proper functioning of the T2S services by mitigating the effects of incidents.
In 2020 the T2S platform experienced 21 major incidents, described as unplanned interruptions or reductions in the quality of an agreed service for which a Crisis Managers’ conference call was required. Among those incidents, eight were related to a delay request from a T2S actor. Each of the incidents was followed up with a detailed report, which serves as input for continuously improving the service and for reinforcing adequate capabilities for preventing or mitigating such incidents in future. In paragraphs 2.2.1‑2.2.4, more details are provided for four of the major incidents that occurred in 2020.
In comparison, in 2019 the T2S platform registered only six major incidents.
Chart 25
T2S service level indicator in 2020
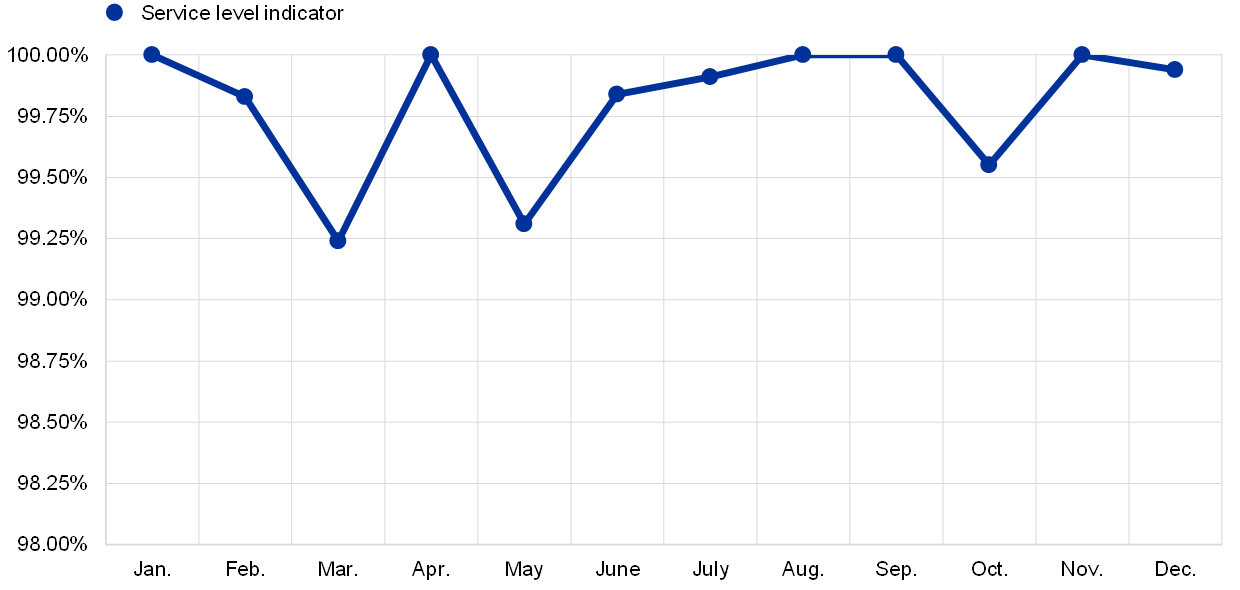
As illustrated in Chart 25, the service level indicator, computed as the weighted average performance of the platform services, fell below the committed KPI value of 99.7% three times in 2020 (in March, May and October). While in March market turbulence related to the COVID‑19 outbreak resulted in an unprecedented increase in volume (+52.71% in March 2020 compared with March 2019) and capacity-related incidents, breaches in May and October 2020 were linked to TARGET2 incidents which had an impact on T2S as well. Nonetheless, the overall results demonstrate a consistently high performance of the platform during the rest of 2020.
Incident on 25 May 2020
On 25 May 2020 T2S faced a major incident in production. The incident had its origin in a settlement algorithm that, during the last cycle of the NTS, showed a long duration and prevented the sequence from closing normally. In order to unblock the situation and continue the T2S settlement day, the T2S Operator decided to manually close the job linked to the event that was stuck. As a consequence, two main problems occurred (among others):
- 2,116 partial settlement confirmation messages (sese.025) were not created and therefore not sent to the CSDs, causing reconciliation problems; and
- 1,835 securities positions and 22 cash balances were erroneously debited, resulting in negative positions and balances.
While balances and positions were updating, an additional issue affecting the processing of outgoing A2A messages occurred, causing the non-creation of the settlement confirmation messages (sese.025).
Therefore, the T2S Operator committed to providing both the list and details of the missed settlement confirmations and the list of accounts with one or more negative positions, together with the transactions whose settlement had resulted in a negative position/balance. Due to the status of these activities - needed to allow the customers’ reconciliation – a one-hour delay of EUR‑IDVP was requested and applied. As a consequence of the incident, the start of NTS was delayed to 23:00 CET.
As a follow up to the May 2020 incident, a detailed list of actions was prepared in order to i) prevent the recurrence of such an incident in the future, and ii) mitigate the impact in similar situations. The changes applied focus on:
- Fixing identified software defects;
- Improving the consistency checks for early detection of potential negative positions/balances;
- Improving the existing contingency tools for extracting missing data; and
- Enhancing existing operational and communication procedures.
Several changes have already been implemented with past releases (e.g. R4.0 – June 2020 and R4.2 – November 2020), while the remaining ones are planned for the near future (i.e. R5.0 – June 2021, R5.2 – November 2021 and R6.0 – June 2022).
Incident on 11 August 2020
On 11 August 2020, owing to an issue affecting TARGET2, all settlement services – including T2S – became unavailable from approximately 13:10 CET.
After the necessary investigations and several attempts to restore the service from the primary site, the Eurosystem decided to failover to the secondary site in the same region. The failover was initiated at around 15:45 CET and technically completed at around 16:45 CET.
The connection to T2S was available again at 17:54 CET. Nevertheless, some additional corrective actions were still necessary to restore the full set of T2S services, which led to a delayed closure of the settlement day at 20:00 CET.
After further investigations of the root cause, a human error was identified as the source of the incident: work had been carried out almost simultaneously on power supply units that normally provide for redundancy.
Incident on 23 October 2020
Owing to an internal issue affecting the TARGET2 Single Shared platform, all settlement services (including T2S) became unavailable from approximately 14:40 CET. While the settlement of securities transactions remained available, the transfer of liquidity from and to TARGET2 was not available for several hours.
After the necessary investigations, it appeared that neither the failover to the secondary site in the same region nor the opening of the contingency module were possible. To restore normal operations, it was necessary to move the production site to another region. The failover was initiated at around 20:30 CET and technically completed at around 22:30 CET, after which all settlement services were progressively restarted.
As a consequence of the incident, the closing of T2S had to be postponed until 03:30 CET on Saturday, 24 October 2020, and the NTS cycle only started at 06:05 CET on Saturday, 24 October 2020.
The root cause of the incident was found to be a software defect in a third-party network device used in the internal network of the central banks operating the TARGET2 service on behalf of the Eurosystem. Furthermore, it corresponded with maintenance work that was carried out on the network during business hours.
Incident on 13 November 2020
On 13 November 2020 (business day of 16 November) a major incident occurred affecting TARGET2 which prevented the provision of liquidity in T2S prior to NTS cycle. Only liquidity in DKK was injected into T2S and settled during the evening of Friday, 13 November, while liquidity in EUR was re-injected during RTS from Saturday to Monday for a total amount of €118,231,769,733.87. Despite this incident, T2S settlement efficiency remained almost unchanged during the business day, thanks to wide usage of auto-collateralisation which allowed the impact of the incident on T2S operations to be reduced.
As detailed in Table 3 below, the total amount of auto-collateralisation recorded an increase of roughly 150% on the business day of the incident compared with the results of 13 November and 17 November. There was a positive impact on both the first NTS cycle and the last NTS cycle, ensuring a stable result in terms of EOD settlement efficiency over the three business days (see Table 4).
Table 3
Amount of auto-collateralisation on the day of the incident compared with the previous and following business days

Table 4
EOD settlement efficiency in volume and value terms on the day of the incident compared with the previous and following business days

External examiner’s review
TheT2S and TARGET2 incidents in 2020 were highly unusual and in some cases unprecedented. Therefore, the Eurosystem has initiated a number of internal investigations, both as operator of the systems as well as in its oversight capacity. Immediate actions were taken to avoid new occurrences of these incidents. Moreover, the ECB decided to launch an independent review of its market infrastructure operations with the aim of restoring the operational resilience of the systems to the levels expected.
The independent review, which will be carried out by an independent external auditor, will allow the Eurosystem to draw lessons from the incidents and address them. It will investigate the robustness of the business continuity model, the adequacy of the regular recovery tests, the efficiency of the change management procedures and the communication protocols. The main findings of the review will be shared with market participants and made public by the second quarter of 2021.
The Eurosystem is fully committed to restoring the market’s and the public’s confidence in the robustness of T2S and to ensuring that T2S operations remain stable until the current platform is replaced by the T2‑T2S consolidated platform. Furthermore, all lessons learned will be taken into account when preparing for the operational phase of the T2‑T2S consolidated platform.
3 T2S financial performance
3.1 Cost recovery objectives
The financial position of T2S is determined by trends regarding costs and revenues. The platform operates on a full cost recovery basis, meaning that all costs incurred should be covered by the revenues generated. The T2S pricing structure is defined in Schedule 7 of the T2S Framework Agreement and its cost recovery is driven by three factors:
- the transaction volumes that are settled in T2S;
- the fees that are charged to T2S users for using its services; and
- the predefined T2S cost recovery period.
Decision to increase the T2S price from 1 January 2019
In November 2010 the Governing Council decided to set the T2S DVP price at €0.15 per instruction. The price remained fixed at this level from the launch of T2S in June 2015 until December 2018.
In June 2018 the Governing Council approved the new baselines for T2S pricing, in order to continue pursuing full cost recovery while maintaining the pricing structure unchanged in terms of the different weights for the tariff items. This consisted of:
- an increase in the T2S DVP price level from €0.15 to €0.195, with a temporary surcharge of €0.04 to reflect the lower than anticipated volume situation (effective from 1 January 2019); and
- an extension of the T2S cost recovery period from 8.75 to 14.5 years (i.e. until the end of 2029).
Table 5 provides the T2S pricing structure before and after the June 2018 decision of the Governing Council to adjust the price (effective from January 2019).
Table 5
T2S pricing structure

† Two instructions per transaction are charged.
†† Auto-collateralisation with payment bank (i.e. client-collateralisation) is charged in line with the usage of T2S resources; only the collateral provider is charged. One collateralisation item plus both instructions of each auto-collateralisation leg are charged per ISIN and providing account, i.e. X cents * 5 (i.e. 1 collateralisation item + 4 settlement instructions) for each auto-collateralisation service with payment bank, where X is the price of settlement instructions and collateralisation items.
* T2S is sized in accordance with an expected consumption pattern, i.e. the anticipated distribution of settlement volumes during night-/day-time and peak hours. These items were initially set at a zero price, presuming that actual usage of T2S would remain within this expected consumption pattern over time. However, should there be a greater than expected use of T2S resources and the volume distribution pattern were to differ from expected usage, thus adversely affecting T2S performance, the possibility of charging for these items will be reviewed. The Eurosystem regularly reviews the actual volumes against expected patterns for the various items.
** Account management services for securities accounts are set at zero and will not be changed until the end of the cost recovery period, at least.
*** Account management services for T2S DCAs are free of charge, presuming that the actual number and usage of DCAs remains within expected consumption patterns. However, should DCAs involve greater than expected use of T2S resources, thus adversely affecting T2S performance, the possibility of charging for these items will be reviewed. The Eurosystem regularly reviews the matter together with the central banks operating the DCAs.
Key considerations that led into this decision included:
- the latest information on T2S operational costs, including the expected impact of: (a) the additional costs associated with enhancing the T2S platform’s resilience to cyber threats; and (b) the operational savings expected to be made from the ongoing TARGET2/T2S consolidation project, which is foreseen to be concluded in November 2022 according to the latest approved rescheduling;
- the actual T2S traffic and revenues from the service’s first three years of operations (June 2015 to June 2018), which was also affected by the gradual migration of some of the largest T2S markets; and
- the latest update of the assumptions regarding the future evolution of T2S volumes, based on feedback received by the market (AMI‑SeCo)[13].
The T2S DVP price increase is made up of the following elements:
- €0.012 related to cyber resilience enhancement costs;
- €0.008 related to loss of revenues due to delayed migration to the platform;
- €0.025 related to the new cost situation of T2S (including the costs of delayed migration and the anticipated operational savings from the TARGET2/T2S consolidation project); and
- a temporary surcharge of €0.04 owing to the current volume situation, which may be reviewed in the event that T2S volumes grow faster than expected.
3.2 Financial performance of T2S
The overall financial position of T2S is detailed in the annual T2S financial statements, which are prepared in accordance with specific accounting policies established by the Market Infrastructure Board (MIB). In the interests of clarity, the financial information is presented in a similar manner to a profit and loss report (T2S operating statement) and a balance sheet report (T2S financial situation report).
The T2S operating statement shows yearly accumulated revenues (collected on a monthly basis) and yearly operational costs (paid on a quarterly basis). The T2S financial situation report provides a snapshot of relevant items in the asset and liability accounts.
For more information on the T2S financial position, see the latest T2S financial statement for 2019.[14]
3.3 Analysis of revenues collected in 2020
Chart 26 displays the relative split (i.e. in percentage terms) of T2S revenues between settlement services (SETT) and information services (INSV). The SETT revenue derives from the core settlement services that are available continuously during the night-time and day-time settlement periods, except for a short period during the maintenance window. Information services include services related to T2S information items, such as queries and reports. As part of this service, a CSD or a national central bank (NCB) may query any of its assigned accounts, but no others.
As shown in Chart 26 below, in 2020 approximately three-quarters (77.8%) of T2S revenues stemmed from settlement services, while approximately one-quarter (22.2%) of T2S revenues stemmed from information services. The settlement services portion of T2S revenues has been increasing over the years (with a concomitant reduction in the information services portion of T2S revenues), mainly owing to the gradual migration of some of the largest T2S markets in the first years of the platform’s operations, and also owing to the increase in T2S prices, which became effective from January 2019.[15]
Chart 26
Share of T2S revenue between settlement and information services

Table 6 displays the share (in percentage terms) of T2S revenues between settlement services and information services broken down by tariff item. On the one hand, in 2020 the tariff items that contributed the most to the settlement services portion of T2S revenues were DVP (49.1%) and FOP (9.8%). On the other hand, the tariff items that contributed the most to the information services portion of T2S revenues in 2020 were charges related to transmissions (14.4%) and messages bundled into file (4.2%).
Table 6
Share of T2S revenue between settlement and information services by tariff items

4 T2S risk management and compliance
4.1 Risk management
Managing operational and information security risk is a key element of the governance structure of T2S.
The T2S governance is based on the ECB Guideline on T2S,[16] which lays down the responsibilities of the Governing Council and of the MIB concerning T2S, including their risk management-related responsibilities. Thus, the Governing Council decides on the general operational aspects of T2S, including the T2S risk management framework. The MIB’s responsibilities[17] include, among others, preparing proposals for decision – in full respect of the mandates of the European System of Central Bank (ESCB) committees – as regards the T2S risk management framework and implementing and managing the relevant risk management frameworks.
The T2S risk status and assessment, including risk analysis and mitigation measures (if required), are shared on a regular basis with the CSDs and the NCBs via the relevant fora: the Operations Managers Group (OMG), the Project Managers Group (PMG), the CSD Steering Group (CSG) and the Securities Managers Group (SMG). Within the context of their own risk management activities, and complying with their own national regulatory requirements, CSDs and NCBs flag new risks to the relevant T2S governance bodies if they consider the risks relevant.
Following a recommendation from the TARGET2 Overseer (the Eurosystem), a three-lines-of-defence model[18] was adopted for risk management, and a second line of defence – governance – which reports to the MIB and considers the operational risks for all TARGET services, was defined. The second line of defence will be enhanced in an incremental way over the coming years.
4.2 Oversight
The Eurosystem conducts the oversight of T2S as laid down in the Eurosystem oversight policy framework. The ECB has primary oversight responsibility for T2S and leads and coordinates all oversight activities. The T2S oversight is conducted against a subset of the principles for financial market infrastructures (PFMIs) established by the Committee on Payments and Market Infrastructures (CPMI) and the International Organization of Securities Commissions (IOSCO) considered relevant for T2S by the Eurosystem. The PFMIs are the international standards for financial market infrastructures (FMIs), i.e. payment systems, CSDs, securities settlement systems, central counterparties and trade repositories. Although T2S does not fall within the definition of an FMI provided in the PFMI report, the Eurosystem decided to apply the PFMIs to T2S as these principles relate to functions performed by T2S, i.e. the settlement and recording of securities transactions.
In the course of 2018 the ECB oversight function launched the first comprehensive assessment of T2S since its go-live. The T2S comprehensive assessment process is based on the analysis of a self-assessment questionnaire completed by the T2S operation function (or T2S Operator),[19] as well as analysis of the supporting documentation on T2S. The final assessment report, approved by the Governing Council in 2019, presented the oversight function’s view on the extent to which T2S meets the PFMI. The report concluded that T2S is largely compliant with the PFMI. While shortcomings were identified in certain areas, none were assessed to pose a serious risk if not addressed promptly. In response to the request by the ECB’s oversight function, the T2S operation function drew up an action plan to address in a timely manner the recommendations and observations to enhance the safety and efficiency of T2S. The action plan (which included 26 actions) was approved by the MIB in February 2020 and its progress is constantly monitored by the ECB’s oversight function. Some were already completed- in 2020 and the majority of the remaining actions in the plan are expected to be addressed in the course of 2021.
In 2020 the operation function shared the information requested by the ECB’s oversight function to support the continuous conduct of the oversight assessments regarding operational incidents and changes to the system implemented with T2S Releases 4.0 in June 2020 and 4.2 in November 2020. Furthermore, the operation function provided the ECB’s oversight function with aggregated settlement statistics and information on operational and financial performance, as well as on risk management, testing and migration activities, with a view to supporting the oversight function’s monitoring of T2S activities that are relevant from an oversight perspective. With regard to cyber resilience, the ECB published the Cyber Resilience Oversight Expectations (CROE) in December 2018. One of their key purposes is to provide FMIs with detailed steps for fostering improvements and enhancing their cyber resilience over a sustained period. Following a self-assessment exercise against the CROE on TARGET2 conducted by the Operator at the request of the oversight function in the course of 2019, a similar exercise for T2S was initiated in 2020. In 2020 the T2S Operator provided its self-assessment against the CROE domains of “Governance” and “Response and Recovery” which are deemed to be different for T2S in comparison with TARGET2. As for the other six CROE domains (“Identification”, “Protection”, “Detection”, “Testing”, “Situational awareness” and “Learning and evolving”), given that the Operator considered that there are strong similarities between TARGET2 and T2S in those domains, the assessment of TARGET2 will be the basis for the T2S assessment to be drafted in 2021 by the T2S oversight function. To this end, the T2S Operator will stand ready to answer any questions from the T2S oversight function during the assessment process, including the adaptation of the TARGET2 assessment to T2S, or as regards the chapters on “Governance” and “Response and Recovery”.
4.3 External examination
T2S services are performed on a single technical platform integrated with central banks’ RTGS systems for all participating currencies. Under the T2S Framework Agreement, the Eurosystem and the CSDs have agreed that the performance of T2S services shall be subject to technical and operational examinations performed by an external examiner. These examinations provide an independent, third-party assessment to all participating CSDs based on the established industry norm (ISAE 3402). The external examiner must be a reputable, internationally active accounting firm.
The objective of these examinations is to provide the CSDs with reasonable assurance that (a) the organisation set up by the Eurosystem meets the obligations established in the Framework Agreement, and (b) the controls implemented by the Eurosystem are suitably designed, effective, and allow for efficient risk assessments to meet the security objectives.
As required by its statute, the Eurosystem conducted a public tender in 2018 and appointed an external examiner for T2S. The 2018 external examination report and the comprehensive action plan were approved by the Governing Council on 17 April 2020. The second external examination of T2S services took place in 2020, examining T2S services during 2019. Apart from some exceptions, the external examiner confirmed that the examined T2S controls were both suitably designed and implemented and had operated effectively throughout the examination period from 1 January 2019 to 31 December 2019. The findings and recommendations from the 2019 examination report will be addressed via a comprehensive action plan, together with the still open actions from the 2018 action plan.
The external examination covering 2020 will be performed in 2021. These external examinations are a regular yearly exercise.
5 System evolution
5.1 Regular software updates
T2S evolution reflects changes in business needs, regulatory factors and applicable market standards, along with some changes considered to aspects of maintenance. The typical T2S yearly release schedule includes one major release and one minor release, including change requests and production problems, as well as two production problem releases, which only schedule fixes for production problems.
T2S releases in 2020 (R3.3, R4.0, R4.1 and R4.2)
On 15 February 2020 T2S Release 3.3 was deployed to fix 23 know production problems. On 13 June 2020 the major T2S release, Release 4.0, went live with the implementation of six change requests and two editorial change requests (listed in Table 8 below). These changes covered a wide range of functional areas, including enhancements to the T2S settlement module, additions to the information exchanged between T2S users and T2S, and the first deployment of a change request related to the T2‑T2S consolidation project.
A second release (Release 4.1) solely for production problems, initially scheduled for deployment in September 2020, was cancelled to maximise the testing time required for Release 4.2.
The minor release T2S Release 4.2, deployed on 21 November 2020, deployed 14 change requests and one editorial change request (listed in Table 9 below). The changes included the deployment of the T2S penalty mechanism, related to the CSDR (see Box 3), an upgrade of ISO messages and additional deployments related to the T2‑T2S consolidation project.
The numbers of change requests deployed and production problems resolved in 2020 are shown in Table 7.
Table 7
T2S releases in 2020

Table 8
Change requests covered in T2S Release 4.0

Table 9
Change requests of T2S Release 4.2

Future system evolution
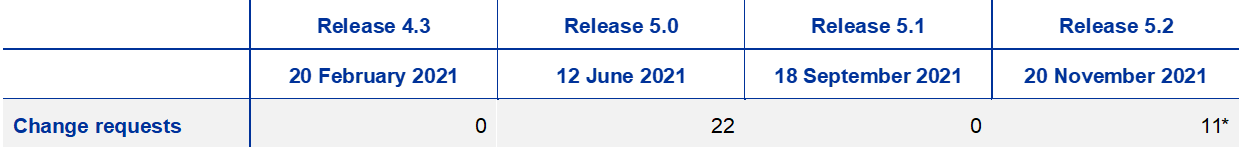
In 2021 changes to T2S will be delivered in two releases: Release 5.0 in June 2021 and Release 5.2 in November 2021. The changes planned for June 2021 will include changes to T2S cash forecasting and further changes related to the T2‑T2S consolidation project. In November 2021 changes related to the auto-collateralisation functionality are planned, as well as new tools to facilitate the recovery from a critical incident or contingency scenario.
In addition to the major and minor releases in 2021, one release solely for production problems (Release 4.3) will be deployed on 20 February 2021. The second release solely for production problems (Release 5.1) will be deployed on 18 September 2021.
Although it is acknowledged that changes to the scope of the planned releases might be proposed in the future, the number of change requests planned for implementation in 2021 are shown in Table 10.
Table 10
T2S releases in 2021
* Acknowledging that changes to the scope might be still possible.
Looking ahead to the following year, in June 2022 further changes related to the T2‑T2S consolidation project will be deployed in anticipation of the go-live date in November 2022, including the implementation of the Eurosystem Single Market Infrastructure Gateway (ESMIG), legal archiving and common billing components.
For further information, a full list of T2S change requests and the detailed contents of each release can be found on the ECB’s website:
Box 3
CSD Regulation (CSDR) settlement discipline regime
The entry into force of the CSD Regulation (CSDR) settlement discipline regime was postponed from September 2020 to February 2022 by the regulatory authorities. In anticipation of this regulatory deadline, in November 2020 the Eurosystem deployed the T2S penalty mechanism, which provides a major set of new functionalities to support T2S CSDs in their compliance with the CSDR settlement discipline regime.
The T2S penalty mechanism offers identification, calculation and reporting of cash penalties to T2S CSDs based on the analysis of failed transactions in T2S, as well as a set of operational tools deemed necessary in this context.
The T2S penalty mechanism was implemented with the go-live of Release 4.2 in November 2020 as a dormant functionality in T2S, i.e. penalty reports are not generated at this stage. Some complementary changes are planned in 2021 to further enhance the already deployed functionality. The Eurosystem is actively monitoring the progress of T2S CSDs in their testing of the T2S penalty mechanism ahead of the entry into force of the settlement discipline regime.
5.2 On-boarding of new CSDs
The system has also been constantly evolving in terms of participants. The following CSDs are currently working towards joining the T2S platform:
- Euroclear Finland: this CSD is aiming to migrate to T2S in September 2023 in accordance with its request to the MIB on 13 November 2020. It postponed its migration to T2S in 2017 as part of the final wave, and, as an end-investor market, is expected to bring more than 2 million securities accounts and additional volumes to T2S;
- Euroclear Bank: in accordance with its public announcement,[20] Euroclear Bank intends to join T2S in order to offer central bank money settlement to its clients. It has already formally expressed to the MIB its intention to migrate to T2S. The exact date of migration remains to be formally requested by Euroclear Bank;
- Središnje klirinško depozitarno društvo (SKDD): in the context of Croatia’s national plan for the changeover from the Croatian kuna to the euro (planned for 1 January 2023), the ECB team has been supporting Hrvatska narodna banka (the Croatian national central bank) and SKDD with their preparations to join T2S. SKDD has formally informed the MIB accordingly. The formal announcement regarding confirmation of the date of the introduction of the euro in Croatia is expected to take place in mid‑2022.
5.3 Consolidation of TARGET2 and T2S
The T2‑T2S consolidation project aims to replace the current TARGET2 with a new RTGS system, by introducing a centralised tool for liquidity management (CLM) across all TARGET services (T2, T2S, TIPS and ECMS).
Following the publication of the User Detailed Functional Specifications (UDFS) in 2019, the functional specification phase of the project ended in 2020, with the publication of the first version of the User Handbooks (UHB).
The UHB are the result of more than two years of work involving the service provider, Eurosystem central banks and the market. They provide details on the graphical user interface screens as well as the interaction between the new T2 service and its users.
With the end of the specification phase, the UDFS and the UHB are stable and expected to change very little. Planned future versions of those deliverables aim only to include potential corrections and relevant changes. Through the publication of any approved change request on the ECB’s website, the Eurosystem will allow market participants to obtain an overview of any such corrections and changes at an early stage, without having to wait for the next version of the UDFS or the UHB.
Revised project timeline
In July 2020 the Governing Council decided to reschedule the timeline of the T2‑T2S consolidation project by one year with a new go-live date scheduled for November 2022 instead of November 2021. This decision resulted from a formal request from the European banking community motivated by the adverse impact of (i) the COVID-19 pandemic, and (ii) the postponement of the SWIFT ISO20022 cross-border migration to November 2022. Having considered the challenge posed by the COVID-19 pandemic to the readiness of banks and the need to let participants benefit from synergies between the SWIFT and T2 ISO20022 migrations, the Governing Council approved this request and extended the project timeline by one year.
Migration, testing and readiness
The T2‑T2S consolidation project will go live in November 2022, following a “big bang” migration approach. This means that the current TARGET2 Single Shared Platform will be discontinued simultaneously with the launch of the new T2 service. Transition in stages is not possible because the current SWIFT FIN Y-copy message flow used in TARGET2 cannot co-exist with the V-shape message flow that will be employed by the new T2 service. The V-shape set-up provides for “network-agnostic” connectivity and enhanced information security.
The Eurosystem amended the due dates of the “Overall key milestones to ensure a successful “big bang” migration in November 2022” to take account of the new timeline. The revised document was published on the ECB website.
The Eurosystem acceptance testing continued throughout 2020. This collaboration between the central banks allows for a thorough quality assessment in advance of the start of central bank testing in June 2021.
The process of migration will be intensively practiced in a set of go-live rehearsal tests during 2022, some of which will include the whole TARGET community.
The Eurosystem will provide a pre-production test environment for T2 users to carry out their testing as well as to participate in tests coordinated by the ECB and in the aforementioned go-live rehearsal tests.
The Community Readiness Reporting process follows the Community Readiness Framework, which is outlined in the Migration, Testing and Readiness strategy document. The readiness of the community to migrate in November 2022 will be assessed against these milestones throughout 2021 and 2022 in quarterly cycles.
Further details on the T2‑T2S consolidation project are available on the T2‑T2S consolidation page on the ECB’s website.
5.4 Eurosystem Collateral Management System
The Eurosystem Collateral Management System (ECMS) will be a single collateral management system used to manage eligible assets mobilised as collateral in Eurosystem monetary policy operations, replacing the current local collateral management systems.
The ECMS will interact with the centralised liquidity management module within T2 in order to ensure the settlement of payments stemming from monetary policy operations, corporate actions and fees, and to update the relevant credit line.
In addition, the ECMS will interact with T2S for the settlement of securities and the management of the auto-collateralisation process. The resulting synergies are expected to benefit NCBs and all other ECMS players in their communities – counterparties, CSDs and tri-party agents (TPAs) – by contributing to the efficient exchange of securities, collateral and liquidity within the Eurosystem. It will be accessible via a single common interface across jurisdictions and will facilitate the mobilisation of cross-border collateral.
In 2020, prompted by the decision to reschedule the T2‑T2S consolidation project, the go-live date of the ECMS project was extended by one year to November 2023. The project milestones and the key project phases for development, testing and readiness were re-planned accordingly.
The focus in 2020 was on communication with the ECMS stakeholders. A set of information packages on the ECMS was published at the beginning of the year for NCBs to use in their information sessions with counterparties. A series of workshops with CSDs and TPAs was organised to provide an ongoing two-way communication stream to ensure that these important stakeholders get the information they need to fully understand how the ECMS will change the way in which collateral is managed by the Eurosystem.
Further details on the functions and features of the ECMS are available on the ECMS – professional use page on the ECB’s website.
© European Central Bank, 2022
Postal address 60640 Frankfurt am Main, Germany
Telephone +49 69 1344 0
Website www.ecb.europa.eu
All rights reserved. Reproduction for educational and non-commercial purposes is permitted provided that the source is acknowledged.
For specific terminology please refer to the ECB glossary (available in English only).
PDF ISBN 978‑92‑899‑4730‑5, ISSN 2599‑9257, doi:10.2866/574107, QB‑CH‑21‑001‑EN‑N
HTML ISBN 978‑92‑899‑4731‑2, ISSN 2599‑9257, doi:10.2866/248195, QB‑CH‑21‑001‑EN‑Q
Regulation (EU) No 909/2014 of the European Parliament and of the Council of 23 July 2014 on improving securities settlement in the European Union and on central securities depositories, OJ L 257.
See Box 1, entitled “Changes in the T2S statistical framework” in the T2S Annual Report 2019.
All figures in the chapter do not include data for 1 May. On this day T2S is only open for the settlement of free-of-payment (FOP) transactions.
For further details on the definition of settlement efficiency, see Section 1.3.
Liquidity transfers (LQT) are excluded from the reported statistics, following the changes to the T2S statistical framework.
From 29 October 2018 all the charts related to settled values include transactions settled in Danish krone. The traffic in Danish krone is converted into euro at an exchange rate of EUR 0.13 to DKK 1.
As SRSE and FOP transactions do not imply a cash movement on a DCA, these two transaction types do not contribute to the calculation of value-based statistics. Liquidity transfers (LQT) are excluded from the reported statistics, following the changes to the T2S statistical framework.
The PSEI was used until the end of 2019 while the MSEI was adopted for use from 2020, as part of the changes to the T2S statistical framework. See Box 1, entitled “Changes in the T2S statistical framework”, in the T2S Annual Report 2019.
On-hold transactions include several types of instruction put on hold, such as party-on-hold, CSD-on-hold, CSD-validation-on-hold and CoSD (conditional securities delivery)-on-hold.
See the report of November 2017 on cross-CSD market activity in T2S by the Advisory Group on Market Infrastructures for Securities and Collateral (AMI‑SeCo).
EOD debits represent the return of liquidity from T2S back to TARGET2 and are not included in the calculations to avoid double-counting.
Kronos2 is the RTGS system of Danmarks Nationalbank. The traffic in Danish krone is converted into euro at an exchange rate of EUR 0.13 to DKK 1.
See the following documents for further information: 2018‑05‑22 Letter to the MIB: Market advice on T2S pricing review; 2018‑05‑17 Ad hoc meeting on T2S pricing review-outcome; 2018‑11‑20 Ami-SeCo-outcome.
The T2S financial statement for 2020 will be made public in June 2021. Further to its publication, the T2S Annual Report will be updated to include the link to the latest financial statement.
See Section 3.1 for more information on the T2S price increase.
2012/473/EU: Guideline of the European Central Bank of 18 July 2012 on TARGET2‑Securities (ECB/2012/13) (OJ L 215, 11.8.2012, p. 19).
See the IIA Three lines of defence position paper, Institute of Internal Auditors, January 2013.
The T2S Operator comprises the four central banks responsible for operating T2S (the Deutsche Bundesbank, the Banca d’Italia, the Banco de España and the Banque de France) and the ECB.
Euroclear Bank intending to join ECB's Target2‑Securities platform, press release.