


The ECB Survey of Professional Forecasters - Third quarter of 2026
Summary
In the ECB’s Survey of Professional Forecasters (SPF) for the third quarter of 2026, headline HICP inflation expectations were broadly unchanged from the previous round, while expectations for core inflation, as measured by the HICP excluding energy and food (HICPX), were revised upwards only for 2026.[1]
Headline inflation was expected to decrease from 2.7% in 2026 to 2.2% in 2027 and 2.0% in 2028 (Table 1), with expectations unrevised for 2026 and 2028 and an upward revision of 0.1 percentage points for 2027. Longer-term HICP inflation expectations (for 2031) were unchanged at 2.0%. HICPX was expected to stand at 2.4% in 2026, 2.2% in 2027 and 2.1% in 2028, with an upward revision of 0.2 percentage points for 2026, in line with the latest available data and bringing the forecast closer to the June 2026 Eurosystem staff macroeconomic projections for the euro area. A special question on the war in the Middle East suggested limited expected indirect and second-round effects, which were concentrated in 2026. Respondents expected real GDP growth of 0.6% in 2026, 1.2% in 2027, 1.3% in 2028 and 1.2% in 2031. These figures imply downward revisions of 0.4 and 0.1 percentage points for 2026 and 2027 respectively. Unemployment rate expectations were revised slightly upwards, to 6.3% in 2026 and 2027, 6.2% in 2028 and 6.1% in 2031. For inflation, the balance of risks was tilted somewhat to the upside in 2026 and more balanced thereafter.
Table 1
Results of the SPF in comparison with other expectations and projections
(annual percentage changes, unless otherwise indicated)
Survey horizon | ||||
|---|---|---|---|---|
2026 | 2027 | 2028 | Longer term1) | |
HICP inflation | ||||
SPF Q3 2026 | 2.7 | 2.2 | 2.0 | 2.0 |
0.0 | 0.1 | 0.0 | 0.0 | |
Eurosystem staff macroeconomic projections (June 2026) | 3.0 | 2.3 | 2.0 | - |
Consensus Economics (June 2026) | 2.9 | 2.3 | - | 2.0 |
HICP inflation excluding energy, food, alcohol and tobacco | ||||
SPF Q3 2026 | 2.4 | 2.2 | 2.1 | 2.0 |
Changes from the previous SPF (Q2 2026) | 0.2 | 0.0 | 0.0 | 0.0 |
Eurosystem staff macroeconomic projections (June 2026) | 2.5 | 2.5 | 2.2 | - |
Consensus Economics (June 2026) | 2.4 | 2.3 | - | - |
Real GDP growth | ||||
SPF Q3 2026 | 0.6 | 1.2 | 1.3 | 1.2 |
Changes from the previous SPF (Q2 2026) | -0.4 | -0.1 | 0.0 | -0.1 |
Eurosystem staff macroeconomic projections (June 2026) | 0.8 | 1.2 | 1.5 | - |
Consensus Economics (June 2026) | 0.6 | 1.2 | - | 1.2 |
Unemployment rate2) | ||||
SPF Q3 2026 | 6.3 | 6.3 | 6.2 | 6.1 |
Changes from the previous SPF (Q2 2026) | 0.0 | 0.1 | 0.1 | 0.0 |
Eurosystem staff macroeconomic projections (June 2026) | 6.3 | 6.2 | 6.0 | - |
Consensus Economics (June 2026) | 6.3 | 6.3 | - | - |
Wage growth | ||||
SPF Q3 2026 | 3.2 | 3.0 | 2.8 | 2.9 |
Changes from the previous SPF (Q2 2026) | -0.1 | -0.1 | -0.1 | 0.1 |
Eurosystem staff macroeconomic projections (June 2026) | 3.2 | 3.2 | 3.2 | - |
Consensus Economics (June 2026) | 3.1 | 3.2 | - | - |
1) Longer-term expectations refer to 2031. In the SPF for the second quarter of 2026 they referred to 2030. Longer term expectations from Consensus Economics come from the April 2026 survey.
2) As a percentage of the labour force.
Box 1
Assessment of indirect and second-round effects of the energy shock linked to the war in the Middle East
In this round, SPF respondents were asked special questions related to the possible indirect and second-round effects of the energy shocks linked to the war in the Middle East. First, they were asked to indicate, for each calendar year horizon from 2026 to 2028 and for 2031, what indirect and second-round effects they had incorporated into their baseline expectations for headline inflation.[2] Second, with regard to their wage forecasts, they were asked to assess the relevance of a number of factors that might give rise to a different impact of the Middle East shock on wages compared with the 2022 shock.[3] Third, they were asked to provide a qualitative assessment of the risks surrounding their baseline inflation forecasts.[4]
Indirect effects arising from the conflict in the Middle East were expected to be relatively contained and mainly affect inflation in 2026; second-round effects were expected to be even more limited. Forecasters saw any effects to be relatively short-lived and mainly concentrated in 2026, reduced in 2027 and having disappeared by 2028 (Chart A, panel a). The expected indirect impact of the war in the Middle East on inflation was reported to amount to around 0.2 percentage points in 2026, with some small effects persisting into 2027. These indirect effects were expected mainly in food and transport services. The expected second-round effects were even more limited, standing at less than 0.1 percentage points in both 2026 and 2027. While most respondents saw indirect effects in the range 0.05 to 0.45 percentage points in 2026, the range in 2027 (and for second-round effects in both 2026 and 2027) was -0.05 to 0.25 percentage points (Chart A, panel b). Qualitative answers suggested that the recent reduction in oil prices had likely dampened future indirect pass-through to other components, especially food prices, and reduced the risk of second-round effects through inflation expectations and wage-setting.
Chart A
Estimated indirect and second-round effects of the war in the Middle East on inflation
a) Effects on headline inflation | b) Distribution of estimated effects across respondents |
|---|---|
(percentage points) | (percentage points) |
 |  |
Notes: In panel a), estimated effects were also requested for 2031 but these were reported as zero and therefore are not illustrated in chart. In panel b), the rectangles represent the interquartile range, X denotes the mean, ◊ the median, ○ outliers more than 1.5 times the interquartile range and dashes the minimum/maximum excluding outliers. The data points are based on the middle of the ranges used in the question (e.g. 0.35 percentage points for the 0.25-0.45 percentage points range).
SPF respondents’ reported indirect and second-round effects are largely in line with revisions to their HICPX forecasts since the start of the conflict in the Middle East. Table A shows the changes in HICPX and compensation per employee forecasts in the SPF between the rounds conducted in the first quarter of 2026 and the third quarter of 2026 (in January and July 2026 respectively) and the revisions between the December 2025 and June 2026 Eurosystem staff Broad Macroeconomic Projections Exercises (BMPEs). For the HICPX forecasts in 2026, the revisions in the SPF were slightly higher, at 0.31 percentage points, than the 0.24 percentage point upward revision in the BMPE and in line with the reported indirect and second-round effects. For 2027 and 2028, the changes in the SPF HICPX forecasts and reported indirect and second-round effects were lower than the revisions in the BMPE. For the compensation per employee forecasts, the revisions in the SPF in 2026-2028 were broadly in line with the reported second-round effects. Compared with the BMPE, revisions in the SPF wage growth forecasts were higher in 2026 and lower thereafter.
Table A
SPF and Eurosystem staff BMPE revisions, and reported indirect and second-round effects
(percentage points)
2026 | 2027 | 2028 | ||
|---|---|---|---|---|
HICPX | BMPE | 0.24 | 0.55 | 0.21 |
SPF | 0.31 | 0.24 | 0.04 | |
Compensation per employee | BMPE | -0.06 | 0.32 | 0.19 |
SPF | 0.16 | 0.13 | 0.06 | |
Indirect effects | SPF | 0.24 | 0.09 | -0.01 |
Second-round effects | SPF | 0.08 | 0.08 | 0.00 |
Combined effects | SPF | 0.32 | 0.17 | 0.00 |
Notes: The table shows the revisions to HICPX and compensation per employee in the BMPEs conducted between December 2025 and June 2026 and the SPF rounds conducted between the first quarter of 2026 and the third quarter of 2026 as well as the reported indirect and second-round effects (and combined effects) from the SPF for the third quarter of 2026.
“BMPE” stands for Eurosystem staff Broad Macroeconomic Projections Exercise.
The magnitude and duration of the energy shock as well as the labour market situation were seen as the most relevant factors behind wage developments after the recent shock compared with the Ukraine invasion shock. Over 60% of respondents considered that the magnitude and duration of the energy shock were very relevant – and 90% at least somewhat relevant – in giving rise to a different impact of the current Middle East shock on wages compared with the 2022 Ukraine shock (Chart B, panel a). Around 50% thought the labour market situation was very relevant and 80% at least somewhat relevant. While memory of high inflation or scarring effects and the growth outlook were not considered to be very relevant, many respondents considered these factors to be somewhat relevant. AI was considered to be not relevant.
Chart B
Responses to other special questions on wages and risks to inflation
a) Relevance of selected factors for a possible wage effect | b) Reported qualitative and quantitative risk assessments |
|---|---|
(percentages) | (percentages) |
 | 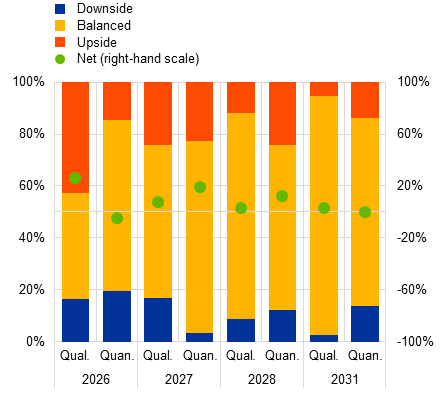 |
Notes: Panel a) shows the reported relevance of six factors. The factors are, in descending order of the portion indicating “very relevant”: (i) size/magnitude of the energy shock; (ii) length/duration of the energy shock; (iii) labour market situation; (iv) growth outlook (v) memory of high inflation/scarring effects, and (vi) AI. Panel b) shows reported qualitative (Qual.) and quantitative (Quan.) risk assessments for headline inflation expectations. Quantitative assessments are derived from the balance of risk indicator (calculated as the mean of the individual reported probability distributions minus reported point forecasts) with a threshold of ±0.05 percentage points for mapping as upside/downside risks.
With regard to the risks to their forecasts, respondents saw some upside risks for 2026 and more balanced risks further along the forecast horizon (Chart B, panel b). More respondents reported upside risks (43%) than balanced risks (40%) for 2026, while for the other horizons (2027, 2028 and 2031), the majority saw risks as balanced (59%, 79% and 92% respectively). These figures are largely congruent with balance of risks metrics constructed from quantitative data (using the reported probability distributions and point forecasts).
1 Headline inflation expectations broadly stable in the near term, while core inflation expectations were somewhat higher
SPF respondents’ headline inflation expectations were unchanged for 2026, revised slightly upwards for 2027 and remained at 2.0% for 2028 and in the longer term. HICP inflation was expected to stand at 2.7% in 2026 before decreasing to 2.2% in 2027 and falling further to 2.0% in 2028 and 2031. Compared with the previous round, the aggregate forecast for 2026 was unchanged, although this masked heterogeneity across respondents. Some respondents revised their forecasts downwards, citing the sharp decline in energy spot and futures prices following the de-escalation of the conflict in the Middle East in mid-June and the reopening of the Strait of Hormuz. Others revised their forecasts upwards because the conflict had lasted longer than anticipated in the previous round. Compared with the June 2026 Eurosystem staff macroeconomic projections, headline inflation expectations in this SPF round were notably lower for 2026 and slightly lower for 2027, in line with the survey’s later cut-off date, which captured the decline in energy prices (Chart 1 and Table 1). They were the same (2.0%) for 2028.
Chart 1
Inflation expectations: HICP inflation
(annual percentage changes)

Chart 2
Inflation expectations: HICP inflation excluding energy and food
(annual percentage changes)

SPF expectations for inflation excluding energy and food (HICPX) were revised upwards for 2026, also in line with recent higher data outturns, while remaining close to 2.0% from 2028 onwards. HICPX inflation expectations stood at 2.4% in 2026 and 2.2% in 2027, before declining to 2.1% in 2028 and 2.0% in 2031. Compared with the previous round, this implied an upward revision of 0.2 percentage points for 2026, while expectations for the other horizons remained unchanged. Based on respondents’ comments, some forecasters expected services inflation to remain above 3.0% in the coming months, while others attributed part of the strength in core inflation to price momentum predating the energy shock. The upward revision brought SPF expectations for 2026 closer to the June 2026 Eurosystem staff macroeconomic projections. Nevertheless, SPF forecasts remained below the June 2026 projections across the horizon, particularly for 2027, when they stood at 2.2% compared with 2.5% respectively (Chart 2).
Chart 3
Term structure of inflation expectations
(annual percentage changes)

Note: The chart plots the term structure of inflation expectations: one year ahead, two years ahead and longer-term expectations.
Accounting for the higher starting point, the term structure of inflation expectations is currently more downward sloping, as the near-term profile has softened with the decline in energy prices (Chart 3). While the calendar year figure for 2026 was unchanged for headline inflation and higher for core inflation, the term structure reveals that, beyond the higher recent data outcomes, participants see a faster reversion to target.
Chart 4
Main factors cited by respondents in qualitative comments on the inflation outlook and risks
(percentages)

Notes: The qualitative answers of the forecasters are first decomposed into noun phrases, which are then mapped to various factors using a dictionary-based approach. Each response is then assigned to the factor occurring most frequently across its noun phrases. Where no factor can be identified, the response is classified as “Other”. The pie chart shows the share of responses assigned to each factor.
Oil and energy were once again by far the most frequently cited factors in respondents’ qualitative remarks on their baseline inflation outlook and the risks around it. In these qualitative remarks, the sharp fall in oil and gas spot and futures prices following the de-escalation of the conflict in the Middle East in mid-June was the main reason cited for downward revisions, while the possibility of renewed disruption, particularly around the Strait of Hormuz, featured prominently among the upside risks (Chart 4). Oil and energy played a relatively greater role than in the previous survey. Labour and wages were the next most frequently cited factors, mainly as a channel through which higher energy costs could feed into services inflation, although respondents generally expected these effects to remain contained.
2 Longer-term inflation expectations remain well anchored
Longer-term inflation expectations remained firmly anchored at 2.0%, with the distribution of individual point forecasts more tightly concentrated around the target than in the previous round. The share of respondents reporting expectations of exactly 2.0% rose to around 65%, from about 55% in the previous round, with slightly fewer reporting values outside the 1.9-2.1% range and the distribution close to symmetric around the 2% target (Chart 5).
Chart 5
Longer-term inflation expectations
(annual percentage changes)

3 Near-term GDP growth expectations revised down, mainly reflecting statistical carry-over effects from first quarter data and a modest deterioration in sentiment
GDP growth expectations stood at 0.6% for 2026, 1.2% for 2027 and 1.3% for 2028 (Chart 6). Compared with the previous round, these figures imply downward revisions of 0.4 and 0.1 percentage points for 2026 and 2027 respectively, while the outlook for the later years remained broadly unchanged. These calendar year figures are 0.2 percentage points below the June 2026 BMPE for 2026, in line with the BMPE for 2027 and 0.2 percentage points lower for 2028. The longer-term growth expectations (referring to 2031) were revised down by 0.1 percentage points to 1.2%.
Chart 6
Expectations for real GDP growth
(annual percentage changes)

The downward revisions to euro area growth expectations for 2026 were mainly driven by the weak GDP outcome in the first quarter, while for 2027 they reflected deteriorating sentiment stemming from the war in the Middle East. The GDP outcome for the first quarter of 2026 stood at -0.2% quarter on quarter when the SPF questionnaire was fielded, well below the expectation in the previous round. However, this was driven by a strong contraction in Ireland. Excluding Ireland, growth in the euro area came out at 0.3%, slightly above the SPF expectations for the second quarter of 2026. Multiple respondents who provided qualitative comments indicated that the Irish data for the first quarter of 2026 accounted for a significant share of their downward revisions and stressed that excluding this effect, the euro area outcome for that quarter would have been broadly in line with expectations. Given the subsequent upward revision to Ireland’s first quarter GDP data, which led the estimate of euro area GDP quarter-on-quarter growth to be revised from -0.2% to 0.0%, part of the downward revision to the 2026 outlook may mechanically unwind in the next survey round. Looking beyond the very short term, respondents attributed their revisions to forecasts for 2026 and 2027 to a deterioration in sentiment indicators – particularly for Germany – and continued uncertainty surrounding energy prices. Nevertheless, respondents generally noted a fairly resilient euro area economy in the first quarter when excluding Ireland and also expected resilience on account of lower energy prices than previously expected, which would have a less dampening effect on disposable income.
The quarterly profile for the coming quarters remained broadly stable (Chart 7). Following the weaker realised growth rate in the first quarter of 2026, respondents expected quarterly growth of 0.2% in the second quarter, gradually strengthening to 0.3% in the fourth quarter of 2026, before weakening slightly in the first quarter of 2027. The quarterly SPF growth expectations were broadly in line with the latest Eurosystem staff projections for the second quarter of 2026, 0.1 percentage points higher for the third quarter, in line for the fourth quarter of 2026 and 0.1 percentage points lower for the first quarter of 2027. Compared with the previous round, the share of SPF forecasters expecting at least one quarter of negative growth over the next four quarters increased to 15% from 7%, while no respondents expected a technical recession – defined as two consecutive quarters of negative growth – over the period.
Chart 7
Expected profile of quarter-on-quarter GDP growth
(quarter-on-quarter percentage changes)

Notes: Seasonally adjusted data. The shaded area denotes one standard deviation around the mean of the individual SPF expectations in the survey round conducted in the third quarter of 2026.
Nearer-term risks were assessed to be on the downside, stemming mostly from a renewed escalation of the war and a related rise in uncertainty and inflation that could dampen private consumption and corporate investment. Furthermore, some respondents continued to refer to the risk of an intensification in global trade tensions. A few respondents mentioned potential upside risks related to stronger than expected fiscal stimulus and a quicker recovery in global trade, as well as productivity gains from AI. At the same time, one respondent explicitly referred to reliance on US AI technology as a downside risk for longer-term European growth.
4 Joint revisions in inflation and growth expectations now indicate a levelling off in inflation momentum and some drag on growth
At the one-year-ahead rolling horizon, the inflationary impulse partly unwound in the latest round compared with the previous round, as inflation expectations edged down in response to lower energy prices (Charts 8 and 9). One-year-ahead GDP growth expectations edged up owing to the slightly stronger expected growth in the second quarter of 2026 (which might in part be a rebound from the lower outturn in the first quarter). At the two-year-ahead horizon, inflation expectations stayed close to 2.0% throughout, while growth was revised down slightly. Taken together, the near-term inflationary impulse is stabilising and medium-term expectations remain firmly anchored, leaving a modest growth drag in the two-year-ahead expectations as the shock's legacy, with much more limited effects compared with the Ukraine invasion shock.
Chart 8
Inflation and GDP growth one year ahead expectations
(annual percentage changes)
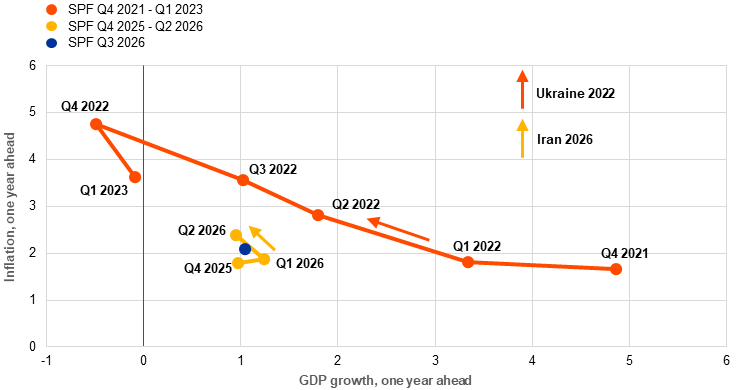
Chart 9
Inflation and GDP growth two years ahead expectations
(annual percentage changes)

5 Unemployment rate expectations revised up slightly across horizons
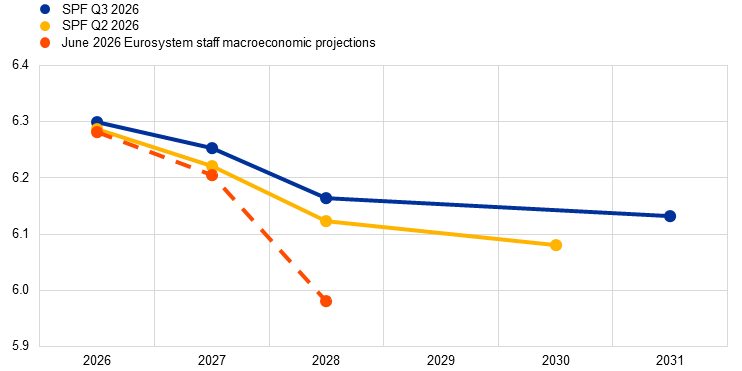
The average point forecast for the unemployment rate was 6.3% for both 2026 and 2027, 6.2% for 2028 and 6.1% in the longer term. The expected trajectory of the unemployment rate remained one of gradual decline, although at a marginally higher level over the medium term than in the previous round (Chart 10). Compared with the round conducted in the second quarter of 2026, expectations were revised upwards by 0.1 percentage points for both 2027 and 2028, while remaining unchanged for 2026 and in the longer term. SPF expectations were in line with the June 2026 Eurosystem staff macroeconomic projections for 2026, but 0.1 and 0.2 percentage points higher for 2027 and 2028 respectively.
Chart 10
Expectations for the unemployment rate
(percentages of the labour force)
Forecasters continued to expect the euro area labour market to remain resilient, viewing the slight upward revisions as reflecting the weaker near-term growth outlook rather than a deterioration in labour market conditions. Respondents linked their small revisions to the lagged impact of the energy shock, while some forecasters noted that firms were adjusting mainly through hours and margins rather than headcount. Structural forces, such as an ageing labour force, persistent skill shortages and continued labour hoarding, were widely seen as underpinning employment even amid weaker activity. Risks were viewed as two-sided, with a renewed energy shock or faster adoption of labour-saving technologies posing upside risks to unemployment, while resilient domestic demand and the preference of firms to retain workers were limiting upside risks. Overall, unemployment was expected to stay close to its current low level.
6 Expectations for other variables
The near-term distribution of expectations for the ECB’s deposit facility rate (DFR) shifted upwards compared with the previous round (Chart 11). For the third quarter of 2026, the modal expectation remained at 2.25%, reported by 61% of respondents. However, most respondents expected a further increase from the current level of 2.25%, with the modal expectation rising to 2.50% in the fourth quarter of 2026 and the first quarter of 2027. The DFR was generally expected to peak at around 2.50% at the turn of 2026-27, before gradually declining towards 2.00% over the medium term. The modal expectation remained at 2.50% for 2027, although an increasing share of respondents expected lower rates. For 2028 and in the longer term, the modal expectation stood at 2.00%.
Nominal wage growth was revised slightly downwards for 2026, 2027 and 2028 and was expected to decline gradually over the forecast horizon. Expectations for the annual growth in compensation per employee stood at 3.2% in 2026, 3.0% in 2027 and 2.8% in 2028, before edging up to 2.9% in the longer term (Chart 12, panel a). This implied a downward revision of 0.1 percentage points for 2026, 2027 and 2028 and an upward revision of 0.1 percentage points in the longer term. Expectations were in line with June 2026 Eurosystem staff macroeconomic projections, expectations for 2026, but 0.2 and 0.4 percentage points lower for 2027 and 2028.
Respondents expected the euro to gradually appreciate against the US dollar, from around 1.16 in the second half of 2026 to about 1.19 by 2031, although the near-term profile was revised down from the previous round. Beyond this year, expectations remained above the constant exchange rate assumption of around 1.17 embedded in the June 2026 Eurosystem staff macroeconomic projections (Chart 12, panel b).
US dollar-denominated oil prices were expected to stand at around USD 80 per barrel in the second half of 2026 and to decline gradually to about USD 70 by 2031, revised downwards across the whole horizon to reflect the fall in prices after the de-escalation of the conflict in the Middle East at the time this survey was fielded. In contrast to the previous round, the expected level was below the June 2026 Eurosystem staff macroeconomic projections throughout, consistent with the survey’s later cut-off capturing the decline in energy prices and closer to – albeit still somewhat above – the “milder” scenario set out in the Eurosystem projections (Chart 12, panel c).
Chart 11
Expectations for the interest rate on the ECB’s deposit facility

Notes: In panel a), 1.75 denotes the range 1.625-1.875%, 2.00 denotes the range 1.875-2.125%, etc. In panel b), the bars show the percentages of respondents, while each box represents different forecast horizons for deposit facility rate expectations. 1.75 denotes the range 1.625-1.875%, 2.00 denotes the range 1.875-2.125%, etc.)
Chart 12
Expectations for other variables
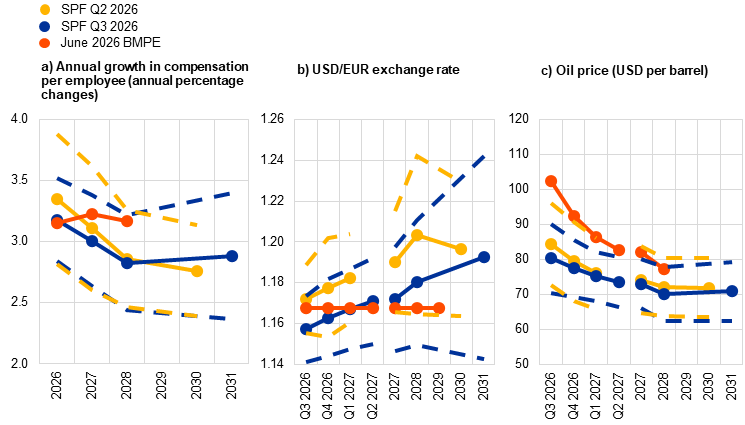
Note: The dotted lines indicate the dispersion around average assumptions (plus/minus one standard deviation of the point estimates).
Annex
Chart A1
Aggregate probability distributions for expected inflation in 2026, 2027 and 2028
(x-axis: HICP inflation expectations, annual percentage changes; y-axis: probability, percentages)

Notes: The SPF asks respondents to report their point forecasts and to separately assign probabilities to different ranges of outcomes. This chart shows the average probabilities assigned to different ranges of inflation outcomes in 2026, 2027 and 2028.
Chart A2
Distribution of point expectations for HICP inflation in the longer term
(x-axis: longer-term HICP inflation expectations, annual percentage changes; y-axis: percentages of respondents)
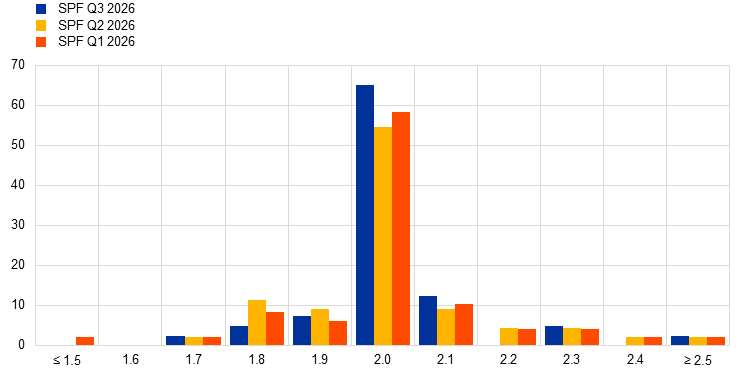
Notes: The SPF asks respondents to report their point forecasts and to separately assign probabilities to different ranges of outcomes. This chart shows the spread of point forecast responses. Longer-term expectations refer to 2031 in the SPF for the third quarter of 2026; they referred to 2030 in the SPF rounds for the first and second quarters of 2026.
Chart A3
Aggregate probability distribution for longer-term inflation expectations
(x-axis: HICP inflation expectations, annual percentage changes; y-axis: probability, percentages)

Notes: The SPF asks respondents to report their point forecasts and to separately assign probabilities to different ranges of outcomes. This chart shows the average probabilities assigned to different ranges of inflation outcomes in the longer term. Longer-term expectations refer to 2031 in the SPF for the third quarter of 2026; they referred to 2030 in the SPF rounds for the first and second quarters of 2026.
Chart A4
Aggregate probability distributions for GDP growth expectations for 2026, 2027 and 2028
(x-axis: real GDP growth expectations, annual percentage changes; y-axis: probability, percentages)

Notes: The SPF asks respondents to report their point forecasts and to separately assign probabilities to different ranges of outcomes. This chart shows the average probabilities assigned to different ranges of real GDP growth outcomes in 2026, 2027 and 2028.
Chart A5
Aggregate probability distributions for longer-term GDP growth expectations
(x-axis: real GDP growth expectations, annual percentage changes; y-axis: probability, percentages)

Notes: The SPF asks respondents to report their point forecasts and to separately assign probabilities to different ranges of outcomes. This chart shows the average probabilities assigned to different ranges of real GDP growth outcomes in the longer term. Longer-term expectations refer to 2031 in the SPF for the third quarter of 2026; they referred to 2030 in the SPF rounds for the first and second quarters of 2026.
Chart A6
Aggregate probability distributions for the unemployment rate in 2026, 2027 and 2028
(x-axis: unemployment rate expectations, percentages of the labour force; y-axis: probability, percentages)

Notes: The SPF asks respondents to report their point forecasts and to separately assign probabilities to different ranges of outcomes. This chart shows the average probabilities assigned to different ranges of unemployment rate outcomes for 2026, 2027 and 2028.
Chart A7
Aggregate probability distribution for the unemployment rate in the longer term
(x-axis: unemployment rate expectations, percentages of the labour force; y-axis: probability, percentages)

Notes: The SPF asks respondents to report their point forecasts and to separately assign probabilities to different ranges of outcomes. This chart shows the average probabilities assigned to different ranges of unemployment rate outcomes in the longer term.
Longer-term expectations refer to 2031 in the SPF for the third quarter of 2026; they referred to 2030 in the SPF rounds for the first and second quarters of 2026.
© European Central Bank, 2026
Postal address 60640 Frankfurt am Main, Germany
Telephone +49 69 1344 0
Website www.ecb.europa.eu
All rights reserved. Reproduction for educational and non-commercial purposes is permitted provided that the source is acknowledged.
For specific terminology please refer to the ECB glossary (available in English only).
PDF ISBN 978-92-899-7651-0, ISSN 2363-3670, doi:10.2866/9241417, QB-01-26-046-EN-N
HTML ISBN 978-92-899-7650-3, ISSN 2363-3670, doi:10.2866/5635502, QB-01-26-046-EN-Q
The survey requested expectations for the HICP inflation rate (overall and excluding energy and food), the real GDP growth rate and the unemployment rate in the euro area for 2026, 2027, 2028 and 2031 (all annual averages), as well as one and two years ahead of the latest available data point (year-on-year rates for inflation and GDP growth). Participants were provided with an identical set of the latest available data for annual HICP inflation (June 2026: overall inflation, 2.8%; core inflation, 2.4%), annual GDP growth (first quarter of 2026, 0.3%) and unemployment (May 2026, 6.2%). The data used in the report are those available to respondents at the time the surveyed was conducted.
Respondents were asked: “What indirect and second-round effects from the Middle East conflict do you have in your headline inflation forecasts?” and could choose separately for indirect and for second-round effects from nine responses: 0 denoting < |0.05|; + = 0.05 to 0.25 p.p.; ++ = 0.25 to 0.45 p.p.; +++ = 0.45 to 0.65 p.p.; ++++ ≥ 0.65 p.p.; - = -0.05 to -0.25 p.p.; - - = -0.25 to -0.45 p.p.; - - - = -0.45 to -0.65 p.p.; - - - - ≤ -0.65 p.p.
Respondents were asked: “Thinking about your wage forecasts, please assess the following factors which might give rise to a different impact of the Middle East shock on wages compared to the 2022 shock” and could choose separately for each factor from the responses: “very relevant”, “somewhat relevant” and “not relevant”. The factors were, in the order listed: magnitude of the energy shock, duration of the energy shock, memory of high inflation/scarring effects, growth outlook, labour market situation and AI.
Respondents were asked: “How do you currently assess the risks surrounding your baseline inflation forecast?” and could choose separately from the responses: “upside”, “balanced” and “downside”, for each calendar year horizon from 2026 to 2028 and for 2031.
-
24 July 2026