
The role of multinational taxation in the first reversal of foreign direct investment flows in the euro area
Published as part of the ECB Economic Bulletin, Issue 2/2020.
This box explains how the taxation of multinational enterprises following the recent corporate tax reform in the United States has affected foreign direct investment (FDI) flows to and from the euro area.[1] In the euro area, like other advanced economies, the investments of resident companies abroad normally outpace the investments of foreign companies in the euro area. In the course of 2018, however, net FDI outflows (which can also be described as the euro area’s net FDI assets – generally the investments of domestic companies in foreign affiliates) became inflows and net FDI inflows (or net liabilities, i.e. the net investments of foreign companies in the euro area) became outflows. These capital movements were to a significant extent related to certain measures of the US corporate tax reform that entered into force at the beginning of 2018.[2]
The reversal of euro area FDI flows was due entirely to flows from and to (i) the United States and (ii) offshore centres (see Chart A). US multinationals started disinvesting from the euro area (creating net FDI outflows in bilateral terms) in 2017, i.e. ahead of the corporate tax reform, but aggregate euro area FDI flows recorded a reversal through the second half of 2018 as offshore centres also began to divest from the euro area.
Chart A
Euro area FDI flows (net assets and net liabilities) by origin or recipient region
(four-quarter moving sum of transactions, EUR billions, non-seasonally adjusted)
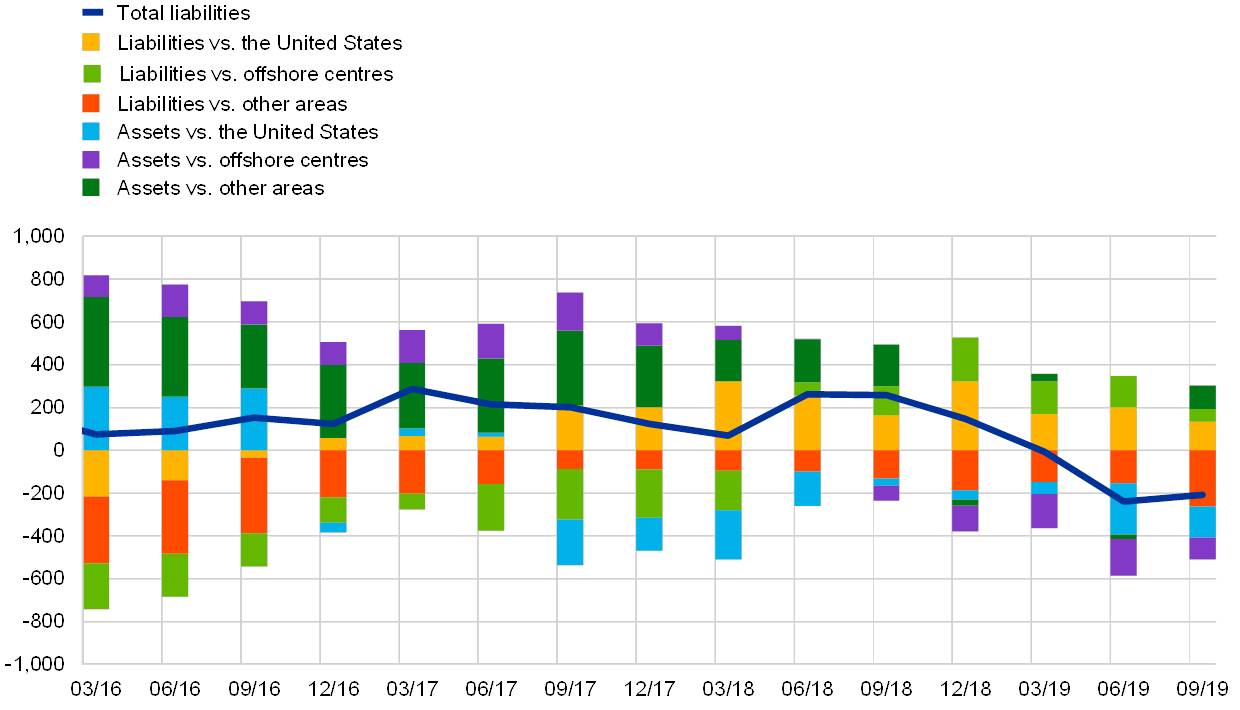
Source: Eurostat.
Notes: For assets, a positive (negative) number indicates net purchases (sales) of non-euro area instruments by euro area investors. For liabilities, a positive (negative) number indicates net purchases (sales) of euro area instruments by non-euro area investors. Offshore centres are: Andorra, Antigua and Barbuda, Anguilla, Aruba, Barbados, Bahrain, Bermuda, Bahamas, Belize, the Cook Islands, Curaçao, Dominica, Grenada, Guernsey, Gibraltar, Hong Kong SAR, the Isle of Man, Jersey, Saint Kitts and Nevis, the Cayman Islands, Lebanon, Saint Lucia, Liechtenstein, Liberia, the Marshall islands, Montserrat, Mauritius, Nauru, Niue, Panama, the Philippines, Seychelles, Singapore, Sint Maarten, the Turks and Caicos Islands, Saint Vincent and the Grenadines, the British Virgin Islands, the US Virgin Islands, Vanuatu and Samoa. The latest observations are for the third quarter of 2019.
The reversal in net FDI flows occurred only in certain euro area financial centres, i.e. countries recording large financial flows, and took place through the transactions of special purpose entities (see Chart B). In other euro area economies, flows remained muted and no significant geographical recomposition of FDI transactions could be identified. Also, the double-edged reversal (assets and liabilities) reflects the high degree of co-movement between asset and liability flows in countries subject to the round-tripping and pass-through practices of multinational enterprises.[3] In Ireland, however, the retrenchment of gross FDI inflows and outflows primarily concerned transactions with other euro area financial centres (and not the United States) and materialised earlier, starting from the fourth quarter of 2017.[4] Given the complex structure of the global FDI network, a possible narrative consistent with this evidence is that some repatriation of profits from Ireland might have occurred via other euro area financial centres.
Chart B
Euro area FDI liability transactions: special purpose entities vs. other resident affiliate entities
(four-quarter moving sum of transactions, EUR billions, non-seasonally adjusted)

Sources: OECD and Eurostat.
Notes: Blue and red areas reflect net inward investments in operating units which are special purpose entities. Yellow and green areas reflect net inward FDI in all other entities resident in the euro area which are affiliates of foreign companies. Financial centres are: Belgium, Luxembourg and the Netherlands. The rest of the euro area includes all other member countries except Spain, Cyprus, Latvia and Malta, which are excluded owing to a lack of data. The latest observations are for the third quarter of 2019.
The decomposition of gross FDI flows by type of instrument shows that the reversal involved mainly equity but excluded the reinvested earnings component (see Chart C). In this respect, the reversal episode underlines the fact that FDI investment decisions primarily reflect tax considerations. It did not trigger a recomposition or relocation of FDI equity and debt to other euro area economies. Moreover, reinvested earnings were basically unaffected, as the past profits repatriated at the one-off preferential tax rate granted by the US corporate were not recorded as income distribution (“super” – or large, exceptional – dividends are recorded in the balance of payments under FDI equity transactions). As a result of this, and amid stable net FDI in Ireland and the redomiciliation to Ireland of some large US multinational enterprises, corporate tax revenues continued to expand in Ireland in 2018.[5]
Chart C
Net FDI flows in euro area financial centres (assets and liabilities) by type of financial instrument
(Four-quarter moving sum of transactions, EUR billions, non-seasonally adjusted)

Source: OECD.
Notes: Data for Ireland were not released for some quarters for the debt, equity and reinvestment of earnings components. Data for Malta and Cyprus are not available. Net liabilities are reported in reverse scale on the negative section (when positive) of the vertical axis. The latest observations are for the third quarter of 2019.
While some provisions in the US tax reform were expected to have transitory effects on FDI transactions, the reform also contained measures against erosion of the tax base, which can affect gross and net FDI flows in the long run. The reform involved a one-time lower tax on unrepatriated past profits; however, the full tax exemption now in place for foreign earnings in the form of dividends generally applies equally whether they are repatriated or held abroad. This weakens the incentive for US multinationals to reinvest earnings abroad. Besides, the reform also contains measures against erosion of the tax base, which can affect gross and net FDI flows in the long run. It reduces incentives for US corporations to move their intangible assets offshore by allowing a tax deduction of up to 37.5% for foreign-derived intangible income. The reversal of gross euro area FDI flows might thus be a transition to a new foreign investment equilibrium. While any assessment is early, disinvestments continued in 2019 and, in euro area financial centres, affected not only equity liabilities but also the debt component of FDI (see Chart C). The monthly estimates for the last quarter of 2019 suggest that the reversal might have halted, and a normalisation of conditions maybe under way, but flows have remained fairly subdued in historical terms.
- See also the box entitled “Euro area foreign direct investment since 2018: the role of special purpose entities”, Economic Bulletin, Issue 5, ECB, 2019.
- See also the article entitled “Multinational enterprises, financial centres and their implications for external imbalances: a euro area perspective” in this issue of the Economic Bulletin.
- Round-tripping involves a company selling assets to another company (or companies), generally located in a different jurisdiction, with the agreement to buy back the same or similar assets at about the same price. Such transactions inflate revenues and costs without affecting profits. They are often associated with pass-through practices, where the other company pays taxes on asset yields and the original company obtains a tax rebate.
- See Emter L., Kennedy, B. and McQuade, P., “US profit repatriations and Ireland’s Balance of Payments statistics”, Quarterly Bulletin, Central Bank of Ireland, Q2 2019.
- In the past, US corporate tax rate cuts seem to have increased employment and growth in Ireland via investment in externally financed industries. This time, however, there might be a risk of capital outflows, as result of changes in the activities of multinational enterprises in the country. See Clancy, D., “US corporate tax rate cuts: Spillovers to the Irish economy”, Working Paper Series, No 38, European Stability Mechanism, 2019.