
Integration of non-euro area central and eastern European EU countries in global value chains, export dynamics, and business cycle synchronisation with the euro area
Published as part of the ECB Economic Bulletin, Issue 1/2020.
This box reviews developments in the six non-euro area central and eastern European EU countries (Bulgaria, the Czech Republic, Croatia, Hungary, Poland and Romania) with respect to trade integration and economic synchronisation with the euro area and investigates the potential exposure of their export dynamics to changing external conditions. In recent decades, in an environment of rapid economic globalisation and increasing trade integration, firms have unbundled their production processes and scattered their input sourcing across countries. This has been particularly true for the six countries under review, which have become increasingly integrated in cross-border value chains both globally and regionally. More specifically, access to the Single Market has entailed the removal of trade barriers, lower transport costs and harmonised EU-wide standards, which have provided a decisive stimulus for firms to fragment their production and assembly operations to take advantage of local production conditions.
The six countries have strong trade ties and are well integrated with the euro area and the rest of the EU. Over the last 20 years, the euro area has been the destination of more than 55% of the total exports of the six countries (see Chart A). By 2014 around 45% of their gross exports to the euro area were related to global value chains (GVCs), i.e. containing either foreign value added or domestic value added for other countries’ exports. Moreover, on average the six countries are positioned downstream[1] in euro area value chains (see Chart B), which suggests that the region is generally specialised in processing and assembly functions and that its overall export activities are therefore characterised by relatively low domestic value-added content and more intense use of foreign intermediate inputs.
Chart A
Share of exports from the six countries to the euro area
(percentages of total exports)
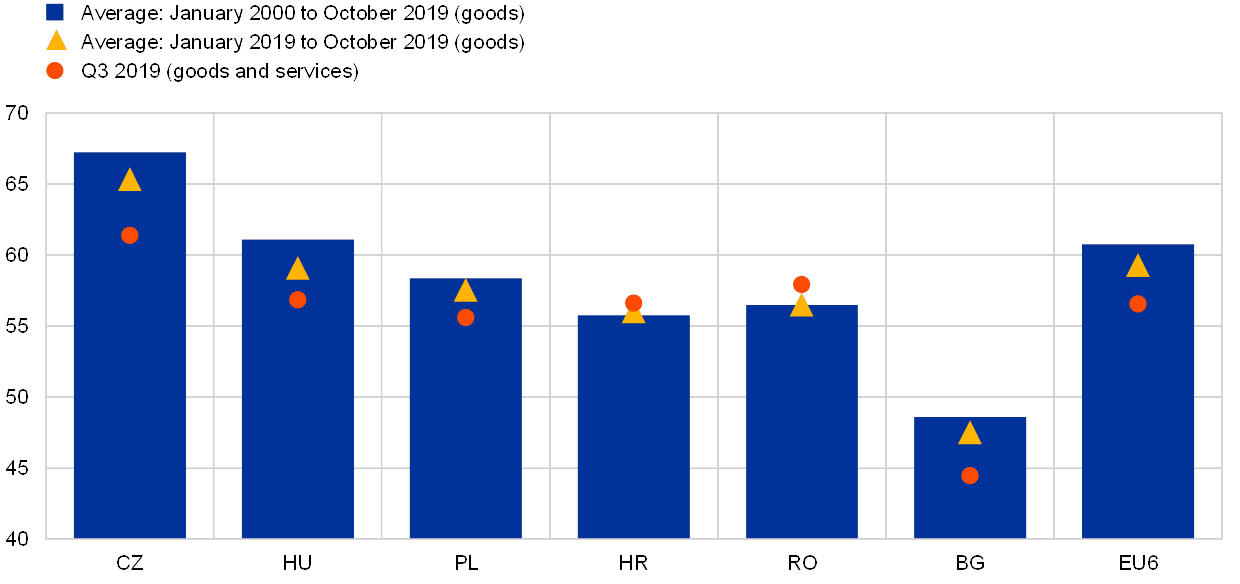
Source: Eurostat.
Notes: “EU6” refers to the aggregate of the six countries under review. The latest observations are for October 2019 (goods export data) and the third quarter of 2019 (goods and services export data).
Chart B
GVC participation and position in exports from the six countries to the euro area in 2014
(position – index; participation – percentages of total gross exports)
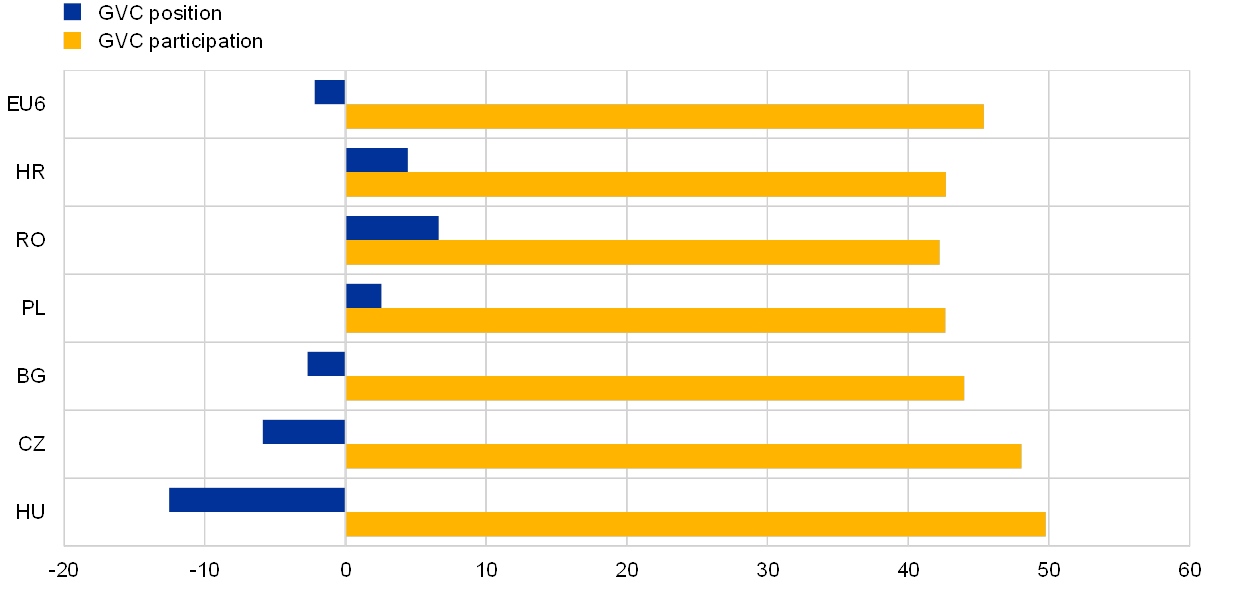
Sources: Eurostat, World Input-Output Tables (2016 release), Wang et al. (2013) and ECB staff calculations.
Notes: “EU6” refers to the aggregate of the six countries under review. The GVC position index is defined as 100*(ln(1+sDV) – ln(1+sFV)), where sDV is the share of domestic value added embedded in total gross exports and sFV is the share of foreign value added in total gross exports. In the purely hypothetical case of 100% domestic (foreign) value added, the position index maximum (minimum) value would therefore be 69 (-69). The higher the share of foreign value added, the lower the GVC position index; a negative value indicates a downstream position (as in the case of the EU6 aggregate), a positive value an upstream position (as in the cases of Croatia, Romania and Poland). GVC position and participation data are only available until 2014 and might not reflect current GVC positions and participation.
The openness of the six countries to international markets has increased gradually, while their GVC trade, which largely involves euro area partners, has been accelerating well above that of the euro area average. The high level of openness, which allowed the six economies to leverage on domestic production structures and reap vast benefits from integration, has also left them more exposed to cyclical developments and industry-specific shocks. In particular, stronger links with other European economies and the rest of the world have resulted in higher trade elasticities and more specialisation in specific sectors.[2] Moreover, value chain trade mainly involves durable investment goods, which are known to be more sensitive to cyclical developments.[3]
The six economies are now an integral part of European production networks, and net exports are a key driver of business cycle synchronisation with the euro area. Stronger trade, especially in intermediates, can support business cycle synchronisation, for example through a wider variety of products being traded.[4] High participation in regional production chains with the euro area appears to be an important catalyst for business cycle synchronisation with the euro area. As can be seen in Chart C, on average across the six countries in the period 2000-2014, a higher GVC participation in exports to the euro area (y-axis) is associated with higher correlation coefficients (x-axis) with both euro area output (red dots) and exports (blue dots). Synchronisation has been very high historically, particularly in Hungary and the Czech Republic.
Chart C
Trade integration and business cycle synchronisation of the six countries with the euro area
(y-axis: share of total gross exports to the euro area related to GVCs, percentages; x-axis: synchronisation with euro area GDP and export growth, correlation coefficient; 2000-2014)
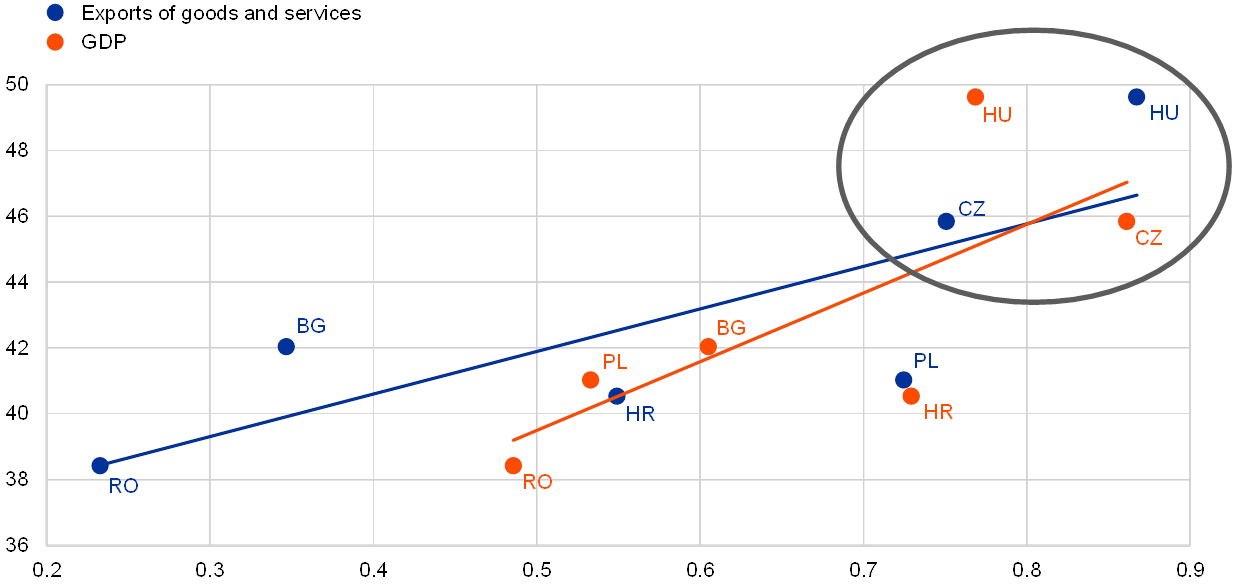
Sources: Eurostat, World Input-Output Tables, Wang et al. (2013) and ECB staff calculations.
Notes: The chart depicts the relationship between the average GVC-related share in exports to the euro area and correlations in annual growth in exports of goods and services or GDP over the period 2000-2014. For example, almost 50% of Hungary’s gross exports to the euro area were GVC-related (y-axis). At the same time, GDP and export growth in Hungary were highly correlated with euro area GDP and export growth (x-axis, correlation coefficient values close to the maximum of 1). A positive slope of the red/blue lines suggests that, on average for the six economies, a higher GVC-related share in exports to the euro area is associated with higher correlation with euro area GDP/export growth. The sample period is restricted to 2000-2014 owing to non-availability of GVC data after 2014.
However, in recent years, the business cycles of the six countries have somewhat decoupled from euro area economic activity (see Chart D). The decoupling may be attributed to local factors, such as robust domestic demand supported by strong wage growth and increases in disposable income (as was broadly the case in all of the six economies). Moreover, the six economies are expected to grow faster than the euro area as a result of a catching-up process. This trend differential suggests that, in general, activity developments in the euro area may not be exactly mirrored in the six countries. Finally, lingering effects of past foreign direct investment in industry and the continued relocation of production from plants elsewhere in the EU to the six countries might also partially explain widening gaps in the short term, as detailed by the Magyar Nemzeti Bank in its September and December Inflation Reports in the case of Hungary.[5]
Chart D
Synchronisation of the business cycles of the six economies with euro area activity
(five-year rolling correlations between annual GDP growth rates in the six economies and in the euro area as a whole)
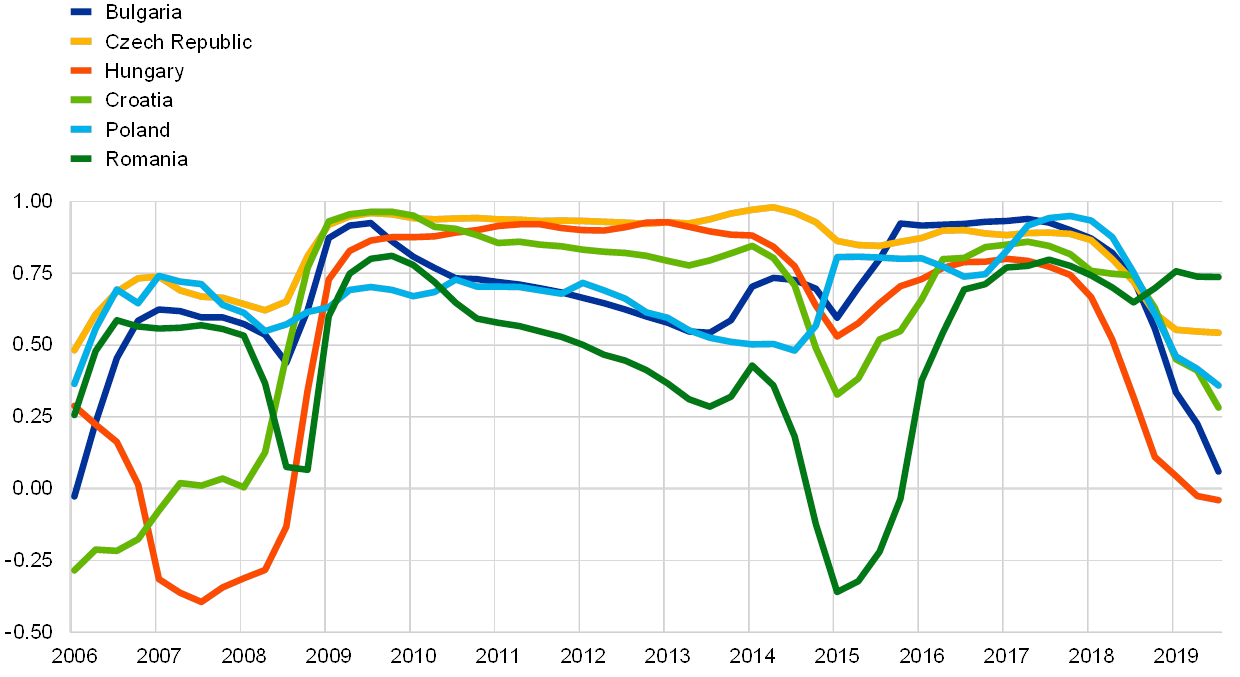
Sources: Eurostat and ECB staff calculations.
Notes: The chart reflects the extent of synchronisation in economic activity between the six economies and the euro area. For example, GDP growth in the Czech Republic was highly correlated with that of the euro area in the decade up to 2018 (as indicated by correlation coefficients close to the maximum value of 1), while it has become less correlated more recently.
The latest observation is for the third quarter of 2019.
The nature and final use of exports play an important role in explaining the correlation between exports of the euro area and the six countries. For example, the recently weaker export growth in Romania can be largely attributed to the automotive sector, which accounts for about one-third of goods exported to Germany. In particular, one of the main contributors to the downturn was auto parts and accessories, a sub-sector that is highly integrated in cross-border supply chains and dependent on the external demand of other countries. By contrast, a large part of Bulgarian exports to Germany are not re-exported but used for final consumption. Since the slowdown in Germany mainly stems from export-oriented industrial sectors, it has a more limited effect on Bulgaria’s exports.
So far, the ongoing moderation in manufacturing, including in the automotive industry in Germany, and the escalation of trade tensions have been only partly reflected in the six economies. Negative spillovers have been softened by factors such as buoyant domestic conditions, the product composition of exports, and the resilience of exports to countries outside the euro area (see Chart E). Given the high trade openness and strong economic ties with the euro area, the overall effect may still be significant in the medium term, particularly for exports.
Chart E
Goods exports, aggregate for the six economies
(annual percentage growth rates, three-month moving averages)
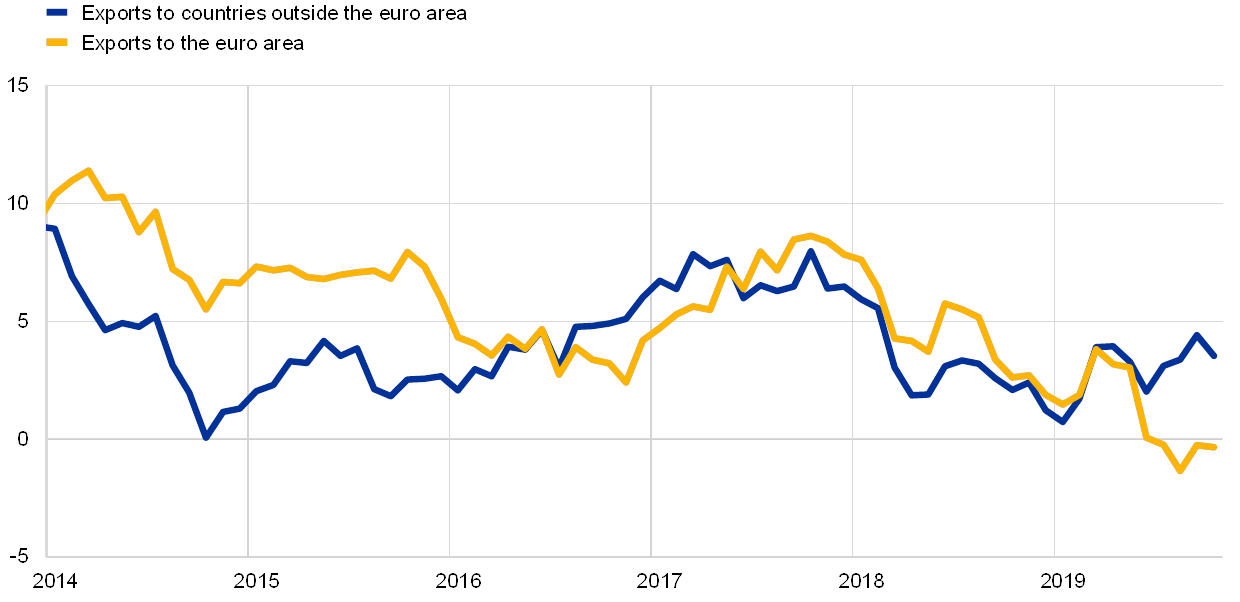
Sources: Eurostat and ECB staff calculations.
Note: The latest observation is for October 2019.
Reforms encouraging a more balanced growth path would cushion potential vulnerabilities to changes in external conditions. Deeper capital accumulation and reliance on domestic innovation will help consolidate the benefits of integration and ensure a steady convergence path in the long run.[6] High-quality domestic institutions and governance are thus critical to lasting economic success; and structural policies promoting, for example, investment in human capital and a strengthening of anti-corruption efforts would be a step in this direction.[7]
- The position in global value chains reflects the relative proportion of two components of gross exports: (i) domestic value added embedded in other countries’ exports (upstream GVC participation); and (ii) foreign value added embedded in own exports (downstream GVC participation). A country is situated downstream in the value chain when foreign inputs (in terms of value added) in the production of its exports are greater than the inputs it provides for the production of other countries’ exports. See also Wang, Z., Wei, S.-J. and Zhu, K., “Quantifying International Production Sharing at the Bilateral and Sector Levels”, NBER Working Paper, No 19677, November 2013.
- See Draghi, M., “Welcome remarks”, speech at the 8th ECB conference on central, eastern and south-eastern European countries, Frankfurt, 12 June 2019.
- See Gunnella, V., Fidora, M. and Schmitz, M., “The impact of global value chains on the macroeconomic analysis of the euro area”, Economic Bulletin, Issue 8, ECB, 2017.
- See, for example, Duval, R., Li, N., Saraf, R. and Seneviratne, D., “Value-added trade and business cycle synchronization”, Journal of International Economics, Vol. 99, 2016, pp. 251-262; and Liao, W. and Santacreu, A.M., “The trade comovement puzzle and the margins of international trade”, Journal of International Economics, Vol. 96(2), 2015, pp. 266-288.
- At the same time, Magyar Nemzeti Bank expected a negative impact of the slowdown in the German vehicle industry on the Hungarian economy via the real economy channel in the medium term (see Inflation Report, Magyar Nemzeti Bank, September 2019).
- See Draghi, M., “Welcome remarks”, op. cit.
- See Lagarde, C., “Strengthening the Economic Engine: Prosperity and Resilience of CESEE Economies in a Changing Trade Landscape”, keynote speech at the 8th ECB conference on central, eastern and south-eastern European countries, Frankfurt, 12 June 2019.