
Understanding the slowdown in growth in 2018
Published as part of the ECB Economic Bulletin, Issue 8/2018.
Growth in economic activity has moderated significantly in the euro area since the end of 2017. Indeed, quarter-on-quarter GDP growth in the euro area fell to 0.2% in the third quarter of 2018, down from 0.7% in the fourth quarter of 2017. This box assesses the factors which are contributing to that slowdown and looks at whether it should be considered a surprise. In particular, it looks at whether the underlying factors are temporary or of a more permanent nature, whether they have originated within the euro area or externally, and whether the slowdown has been driven by a weakness in demand or a tightening of supply conditions.
Chart A
Professional forecasters’ GDP growth expectations
(annual percentage changes)

Sources: Eurostat and ECB.
Notes: The dark blue lines represent final estimates of annual GDP growth. All other lines represent growth forecasts for a particular year at various points in time.
Recent output growth has been disappointing when compared with growth forecasts in late 2017, but not when compared with earlier expectations. The strong acceleration in growth in 2017 was a favourable development that came as a surprise to most professional forecasters (see Chart A). That strengthening of growth, which coincided with world trade growth peaking at 5.2%, was driven mainly by net exports. Conversely, growth in domestic demand remained comparable to the levels seen in the first part of the economic expansion from 2014 to 2016 (see Chart B). Since early 2018, growth forecasts for 2018 and 2019 have gradually been revised downwards, but annual GDP growth in 2018 is still expected to be stronger than was forecast at the beginning of 2017.
Chart B
GDP growth: expenditure and production breakdown
(quarterly percentage changes; percentage point contributions)
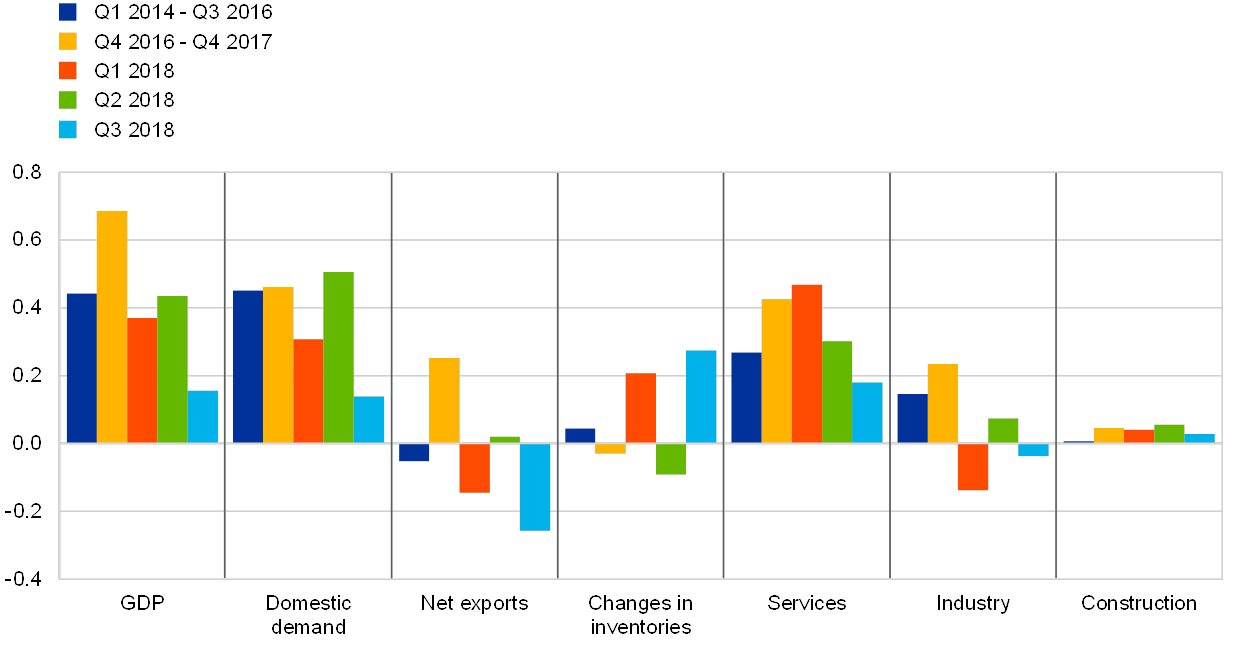
Sources: Eurostat and ECB calculations.
Note: Figures for the period from the first quarter of 2014 to the third quarter of 2016 and the period from the fourth quarter of 2016 to the fourth quarter of 2017 represent averages of the relevant quarterly data.
The slowdown in 2018 has been driven largely by external factors, in particular the weakness in external demand. Indeed, much like the strengthening of growth in 2017, the slowdown in 2018 has been driven by net exports (see Chart B). Trade dynamics have been normalising as global growth has fallen back towards potential levels. As the main producer of tradable goods, the industrial sector has been most affected by the decline in net exports. Meanwhile, growth in domestic demand has generally remained in line with the average contribution made since the start of the economic expansion. While in the third quarter of 2018 the temporary disruption to car production weighed on private consumption, the robustness of domestic demand reflects the virtuous circle between employment, labour income and consumption. Available evidence suggests that this virtuous circle has not, thus far, been disrupted by the recent loss of growth momentum.
Chart C
Industrial production
(annual percentage changes)

Sources: Eurostat and ECB calculations.
Note: Data for the fourth quarter of 2018 are based on monthly figures for October 2018 only.
Several temporary factors have also weighed on the growth profile. In the first half of 2018, weather conditions, sickness and industrial action affected output in a number of countries.[1] In the third quarter, there was also significant disruption to car production as a result of the introduction of new vehicle emissions standards on 1 September (see Chart C). Production slowed as carmakers tried to avoid accumulating stocks of untested models, which weighed heavily on economies with large automobile sectors (such as Germany). In fact, the German economy actually contracted in the third quarter, reducing quarterly euro area growth by at least 0.1 percentage point. This effect, however, is expected to be temporary. As the testing backlog clears, car production in the fourth quarter should gradually return to normal and the effect on output should dissipate. Indeed, the latest data suggest that car production has already started to normalise.[2]
Chart D
Decomposition of manufacturing PMI output
(diffusion index; contributions)
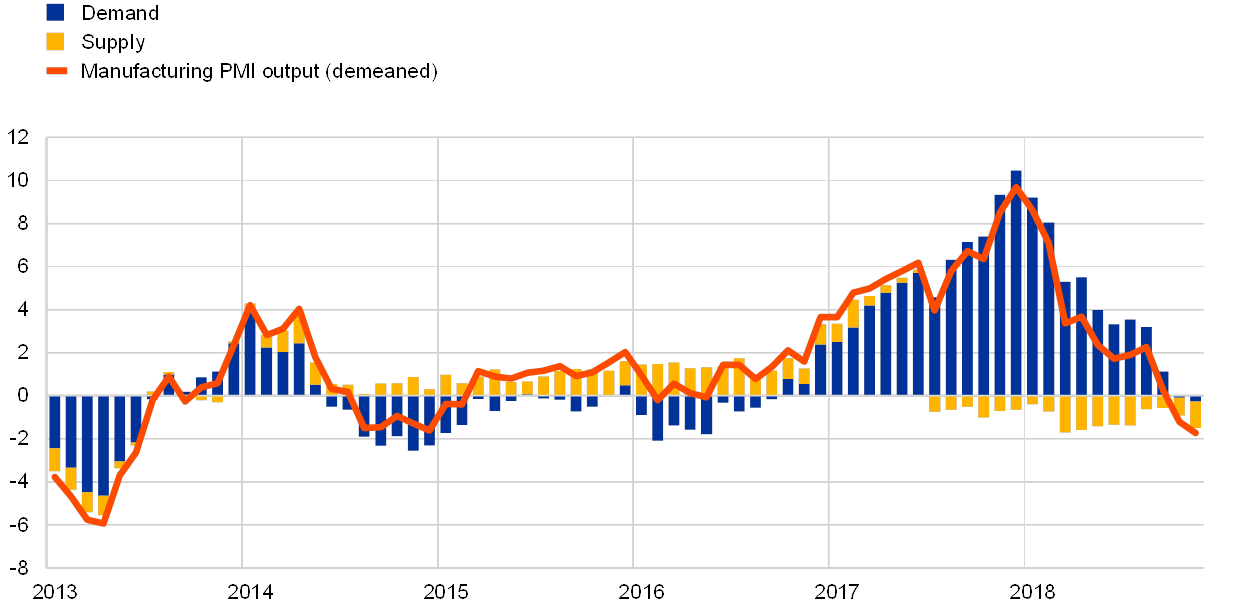
Sources: Markit and ECB calculations.
Notes: Historical decomposition of euro area manufacturing PMI using a sign-restricted SVAR with output and capacity utilisation from the manufacturing PMI. This model uses sign restrictions to identify demand and supply shocks, whereby the former are defined as shocks that push manufacturing PMI output and capacity utilisation in the same direction while the latter are defined as shocks that push manufacturing PMI output and capacity utilisation in opposite directions.
Despite that weakening of demand, the current high levels of capacity utilisation suggest that supply conditions in the manufacturing industry remain tight. A model-based decomposition of manufacturing PMI output suggests that the recent slowdown in activity is mainly related to a weakness in demand (see Chart D).[3] At the same time, supply constraints have gradually become more binding since mid‑2017. Capacity utilisation has fallen only slightly as output growth has slowed. This pattern can clearly be observed in the manufacturing sector – especially in Germany and, to a lesser extent, France.
All in all, the recent slowdown in growth has not, thus far, called into question the fundamentals of the current economic expansion. The moderation follows unexpectedly strong external demand in 2017 and has been compounded by a number of temporary factors. In fact, a gradual slowdown in growth can even be considered normal as an expansion matures. At the same time, uncertainty about external developments has clearly increased the risks to the euro area’s economic outlook. Consequently, the possible implications for domestic demand and the fundamentals of the expansion need to be monitored closely.
- See the box entitled “The recent slowdown in euro area output growth reflects both cyclical and temporary factors”, Economic Bulletin, Issue 4, ECB, 2018.
- According to data from the German Association of the Automotive Industry up to November 2018.
- In this framework, the recent temporary disruption to car production is also regarded as a decline in demand.