
Growth synchronisation in euro area countries
Published as part of the ECB Economic Bulletin, Issue 5/2018.
The degree of business cycle synchronisation, both across the euro area countries as well as between the euro area and the rest of the world, is a pertinent research question. Regarding the euro area, the endogenous optimal currency area (OCA) hypothesis[1] suggests that the degree of business cycle synchronisation among the participating countries should increase over time as a result of deepening financial and trade integration. Individual countries should thus become less exposed to idiosyncratic shocks, facilitating the effectiveness of the single monetary policy. Against this background, this box presents and analyses several measures of business cycle synchronisation both within the euro area as well as from a global perspective.
In an environment of stronger trade and financial linkages, the favourable growth dynamics of recent years are common to the majority of euro area countries and world economies (see Chart A). Between 2014 and 2016 the share of world countries with strengthening growth declined, partly reflecting the negative impact of low oil prices on oil-producing countries. However, the share of countries with improving growth dynamics has been rising since the second half of 2016, with more than half of euro area countries experiencing a strengthening of economic dynamics. This has coincided with the broadening of economic growth that began in 2013.[2]
Chart A
Share of countries with current GDP growth exceeding the past three-year average
(quarterly data, percentages)
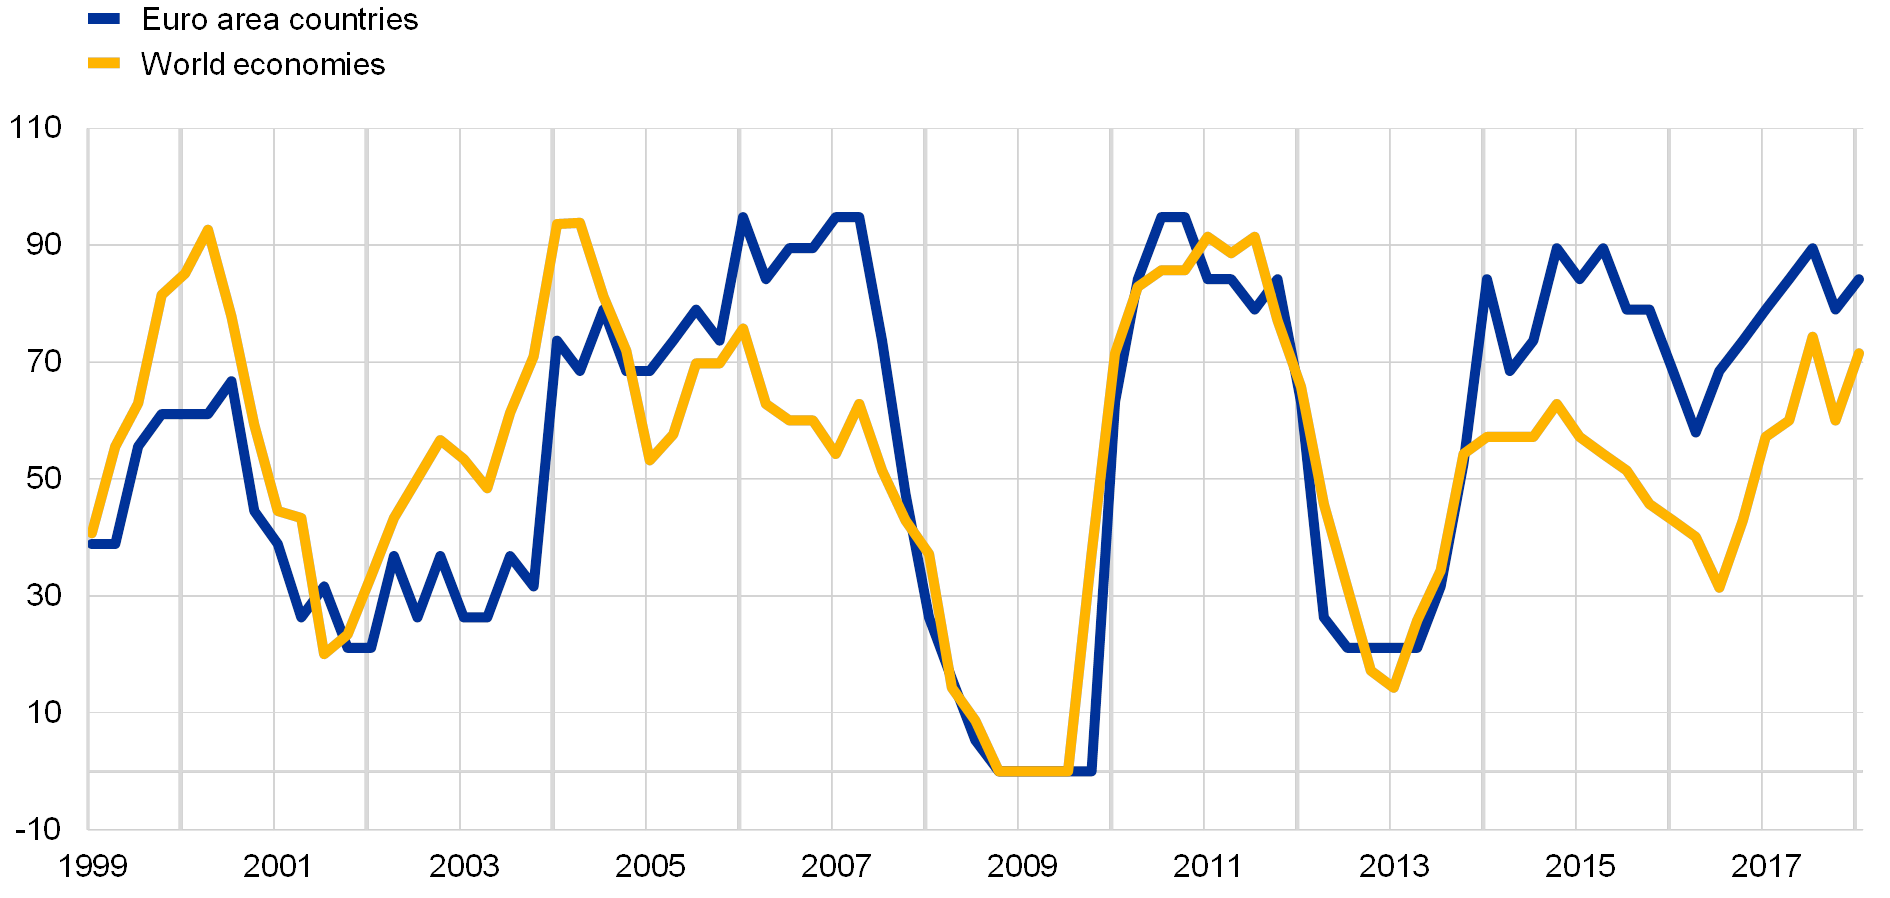
Sources: OECD, Eurostat, Haver Analytics and ECB calculations.
Notes: The calculation is based on quarterly year-on-year real GDP growth rates. The euro area countries consist of the current 19 participating EU Member States (with data for Malta available as of 2001). The world economies consist of 34 countries and the euro area aggregate, accounting for more than 84% of global GDP in PPP. In particular, the group comprises the euro area, Argentina, Australia, Brazil, Bulgaria, Canada, Colombia, Croatia, Chile, China, the Czech Republic, Denmark, Hong Kong, Hungary, India, Indonesia, Israel, Japan, Malaysia, Mexico, New Zealand, Norway, Poland, Romania, Russia, Singapore, South Africa, South Korea, Sweden, Switzerland, Taiwan, Thailand, Turkey, the United Kingdom and the United States. The latest observation is for the first quarter of 2018.
The recent strengthening of growth has coincided with a broad-based reduction in growth dispersion across the euro area countries and in advanced economies (G7) (see Chart B). Growth volatility across euro area countries was very high in the aftermath of the global financial crisis as well as during the sovereign debt crisis. This implied that the impact of the shocks was very diverse across countries. In contrast, the recent decline in growth dispersion across euro area countries has largely coincided with a reduction in fragmentation in financing conditions in the euro area, facilitated by the ECB’s monetary policy measures.
Chart B
Dispersion of quarterly real GDP growth rates
(quarterly data, percentages)

Sources: OECD, Eurostat and ECB calculations.
Notes: The dispersion of growth in the euro area is measured as the weighted standard deviation of year-on-year growth in real GDP in the 19 euro area countries excluding Ireland to avoid distortions in the analysis caused by the high volatility of Irish GDP. The dispersion of growth in advanced economies, proxied by the G7 group (Canada, France, Germany, Italy, Japan, the United Kingdom and the United States) is the unweighted standard deviation of year-on-year growth in real GDP for those countries. The latest observation is for the first quarter of 2018.
A direct measure of correlation confirms that synchronicity increased among the euro area countries in 2016-17 (see Chart C). The correlation measure[3] for the euro area[4] suggests that the degree of business cycle synchronisation increased sharply around the time of the global financial crisis for all sets of countries considered. Among the euro area countries, and in general among the advanced economies, the correlations reached a peak during the financial crisis, and gradually declined over the recovery period. However, this measure shows that there was a renewed trend towards increased synchronisation across the euro area countries in the course of 2017. Over the last two decades, synchronisation has been higher among the largest five euro area economies relative to a broader group of 17 euro area countries, although synchronisation among the latter increased sharply in the course of 2017.[5]
Chart C
Business cycle correlations across euro area and G7 countries
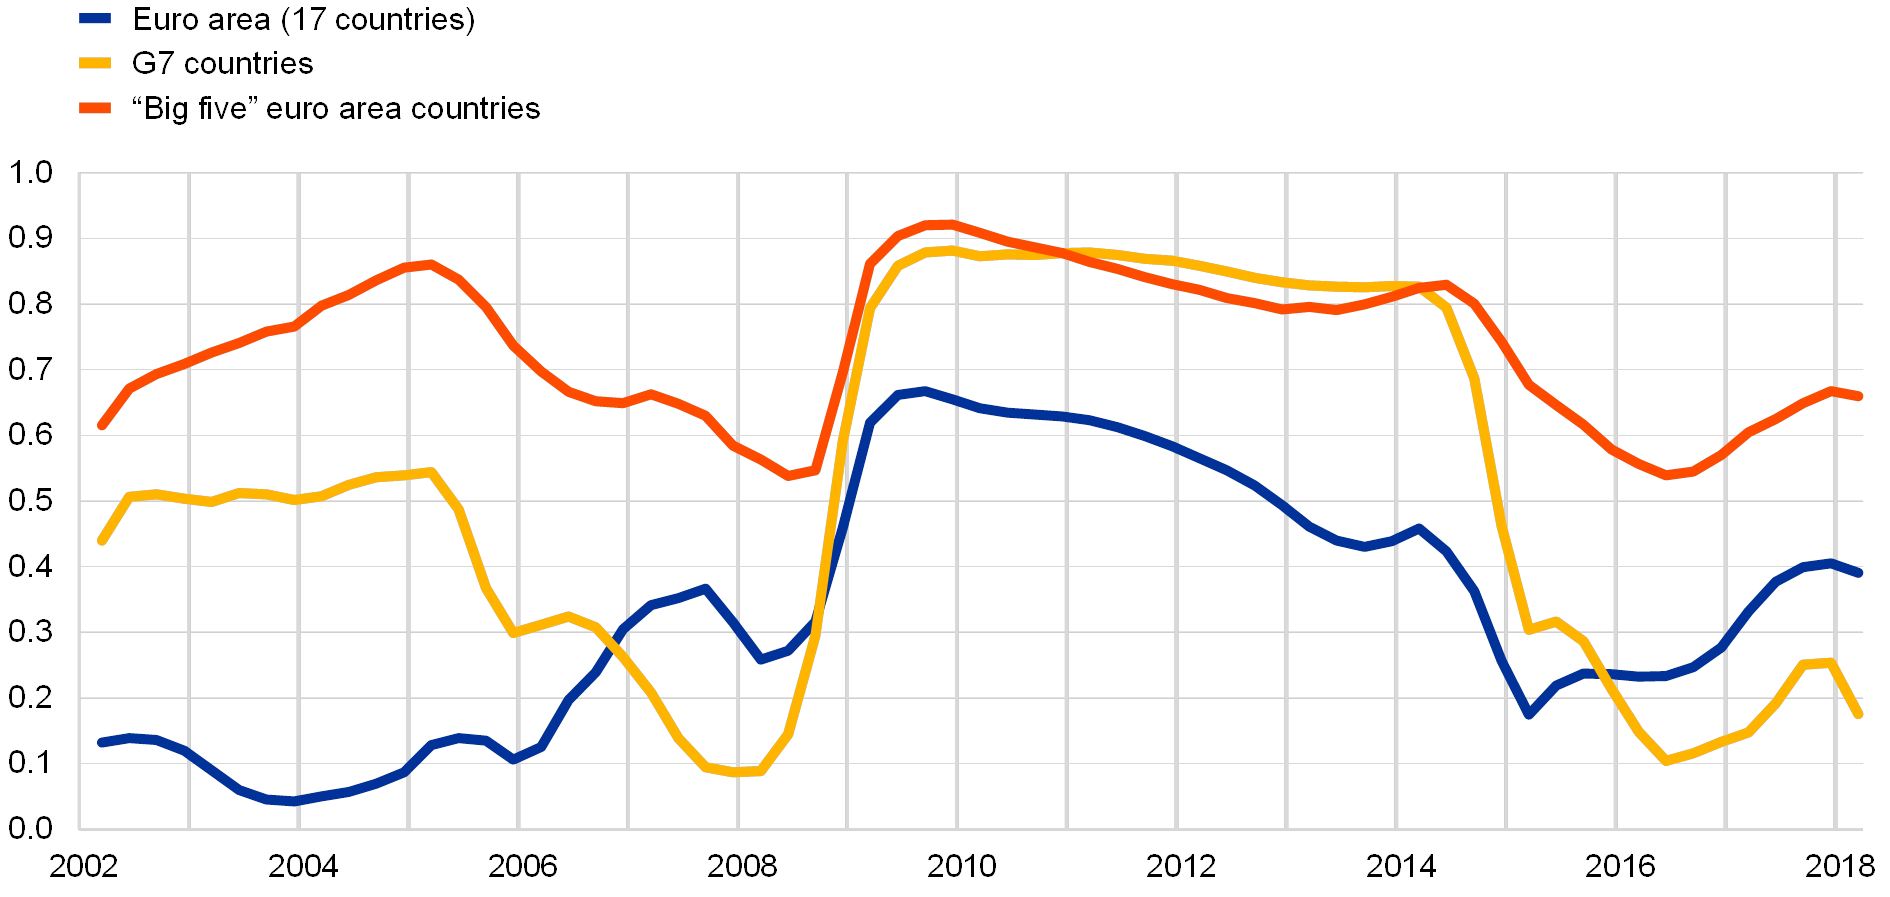
Sources: OECD, Eurostat and ECB calculations.
Notes: The measure of business cycle correlation is a weighted average of pairwise cross-country correlations of real GDP growth, following Stock and Watson (2008). The pairwise correlations have been computed over a five-year rolling window. For the euro area two different groupings are considered: the “euro area” (all euro area countries excluding Malta and Ireland owing to data availability) and the “big five” euro area countries (the five largest euro area economies). The latest observation is for the first quarter of 2018.
The increase in synchronisation is also evident in the fact that a substantial share of the variation in GDP growth across the euro area countries is explained by a common factor (see Chart D). The common component explains on average more than 65% of the GDP growth variance across euro area countries as well as across advanced world economies (G7). However, the share explained by the common factor increased sharply during the financial crisis owing to the synchronised downturn. It is notable that synchronisation in terms of this measure rose again in recent years in the euro area. This trend is in contrast to that observed in the G7 countries, where there is less evidence of a common factor explaining the recent cross-country variation in GDP growth.
Chart D
Relative contribution of the common factor to real GDP growth variance
(percentage of total variance)

Sources: OECD, Eurostat and ECB calculations.
Notes: The chart shows the share of the variation in real GDP growth that is explained by a common factor estimated over a five-year rolling window. The common factor is proxied by the first principal component of quarterly year-on-year GDP growth rates. The euro area group includes all euro area countries except Malta and Ireland owing to data availability. The latest observation is for the first quarter of 2018.
All in all, the evidence points to a relatively high level of growth synchronisation across the euro area countries. While economic growth dynamics have strengthened recently in a larger share of euro area and global economies, this has coincided with a broad-based reduction in volatility across these major world economies. The recent increase in synchronisation across the euro area countries to relatively high levels is confirmed by both the calculated correlation index and the estimated high share of GDP growth variation explained by a common factor.
- Frankel, J. A. and Rose, A. K., “The Endogeneity of the Optimum Currency Area Criteria”, The Economic Journal, Vol.108, Issue 449, 1998, pp. 1009-1025.
- See “Economic growth in the euro area is broadening”, Economic Bulletin, Issue 1, ECB, 2017.
- See Stock, J. and Watson, M., "The Evolution of National and Regional Factors in U.S. Housing Construction", in Volatility and Time Series Econometrics: Essays in Honour of Robert F. Engle, eds. Bollerslev, T., Russell, J. and Watson, M., Oxford University Press, 2008.
- For reasons of data availability, the analysis focuses only on Belgium, Germany, Estonia, Greece, Spain, France, Italy, Cyprus, Latvia, Lithuania, Luxembourg, the Netherlands, Austria, Portugal, Slovenia, Slovakia and Finland.
- One should bear in mind that these measures do not point to the underlying factors contributing to the currently high level of synchronicity among the euro area countries.
Eiropas Centrālā banka
Komunikācijas ģenerāldirektorāts
- Sonnemannstrasse 20
- 60314 Frankfurt am Main, Germany
- +49 69 1344 7455
- media@ecb.europa.eu
Pārpublicējot obligāta avota norāde.
Kontaktinformācija plašsaziņas līdzekļu pārstāvjiem