
Moving to the Frontier: Promoting the Diffusion of Innovation
Welcome address by Mario Draghi, President of the ECB, at the joint conference by the ECB and the MIT Lab for Innovation Science and Policy “Fostering Innovation and Entrepreneurship in the Euro area”, Frankfurt am Main, 13 March 2017
It is my pleasure to welcome you to this joint ECB-MIT conference on fostering innovation and entrepreneurship in the euro area.
This might at first glance seem an unusual topic for a central bank conference, since monetary policy principally operates through the demand side of the economy. But the long-term supply picture evidently also affects our ability to deliver on our mandate.
Much of the debate today about the true level of the real equilibrium interest rate, for example, is a debate about the outlook for productivity growth, which of course depends in large part on innovation and entrepreneurship. Higher productivity growth is also vital to safeguard Europe’s economic model of high wages and social protection, and hence to counter the sense of economic insecurity that is currently prevalent in several advanced economies.
But aggregate productivity growth is more than just the development and application of innovation and new technologies which enhance or even revolutionise production processes. New technologies invented elsewhere need to be adapted by firms into their own production processes to make them more efficient. In short, productivity growth depends not only on the creation of new ideas, but also on their diffusion.
To raise productivity growth, which has slowed in the euro area and in many other economies in recent years, we need to focus on both areas.
Innovation
There is a lively debate underway as to whether the rate of innovation has slowed or not. Some argue that the great innovations of the past – electricity, railways, etc. – will not be matched in the future,[1] or that we have exhausted the gains from the information and communication technology (ICT) revolution.[2] Others remain more optimistic that the current slowdown in productivity reflects a transition to a knowledge-based economy, and that general purpose technologies such as ICT improve over time and generate complementary innovations.[3]
My view on the topic is that we should not be overly gloomy about the global prospects for innovation, for two reasons.
The first is that we clearly have potential to boost innovative capacity in the euro area. Consider, for example, the persistent gap between R&D spending in Europe and other major advanced economies. According to the World Economic Forum’s Global Competitiveness Indicator, only three euro area countries are in the world’s top ten for innovation.
So if, as the world’s second-largest economic area, we were to dismantle barriers to innovative activity in the euro area, it would clearly give a boost to global innovation. I will not go into detail here about what policies this might entail, but clearly government support for innovation matters: in Europe differences in innovative capacity between countries are closely related to public spending on R&D, particularly in basic research.[4]
The second reason why I am reasonably optimistic is that there is no clear evidence yet of a slowdown in innovation. The available data in terms of global R&D spending, and the ongoing historically high rate of high-tech patent registrations seem to challenge this perception.
Moreover, despite the global slowdown in aggregate productivity, firms at the global productivity frontier have continued to post strong productivity gains over the past decade. The performance of euro area businesses at the global frontier is on a par with businesses in other developed economies, particularly in manufacturing. It is the performance of firms away from the frontier that has been lagging (Charts 1 and 2). Although this is a common feature for all OECD countries, it is particularly the case for euro area services, where productivity growth for the laggard firms has stagnated.
Chart 1: Technology diffusion globally and in the euro area in manufacturing
(2003=1)

Source: ECB staff calculations based on OECD and the 5th vintage of CompNet data.
Note: The OECD frontier and non-frontier productivity developments are taken from OECD (2015). Labour productivity growth in the euro area is the unweighted average across Belgium, Finland, France, Italy and Spain of the median firm in each two-digit industry based on CompNet data. Manufacturing industries are then aggregated with value added shares.
Chart 2: Technology diffusion globally and in the euro area in services
(2003=1)

Source: ECB staff calculations based on OECD and the 5th vintage of CompNet data.
Note: The OECD frontier and non-frontier productivity developments are taken from OECD (2015). Labour productivity growth in the euro area is the unweighted average across Belgium, Finland, France, Italy and Spain of the median firm in each two-digit industry based on CompNet data. Service industries are then aggregated with value added shares.
Diffusion
It seems, therefore, that a large contributing factor to the slowdown in aggregate productivity is the second link in the chain: the lack of diffusion of innovation.
This is a long-standing issue for the euro area: better adoption of ICT in the United States appears to explain most of the productivity gap between the US and the EU15 from 1995 to 2007. The contribution to aggregate productivity growth from non-ICT sources of capital deepening and total factor productivity (TFP) growth over that period was broadly equivalent in the two regions.[5]
But what is now becoming clearer is where the diffusion gaps lie. Recent work carried out by the ECB using micro data shows that the difference in productivity between the most productive and the least productive firms in each narrow, two-digit sector is considerable. The top 10% of firms, in terms of productivity, are on average three times more productive than the firms in the bottom 10% (Chart 3). Similar differentials occur in the United States.[6] This massive intra-industry productivity differential dwarfs inter-industry differentials. For comparison, firms active in the tradable sector are on average around 50% more productive than those producing mainly non-tradables.
Chart 3: Productivity differences across tradable and non-tradable sectors versus productivity differences within sectors in 15 EU countries
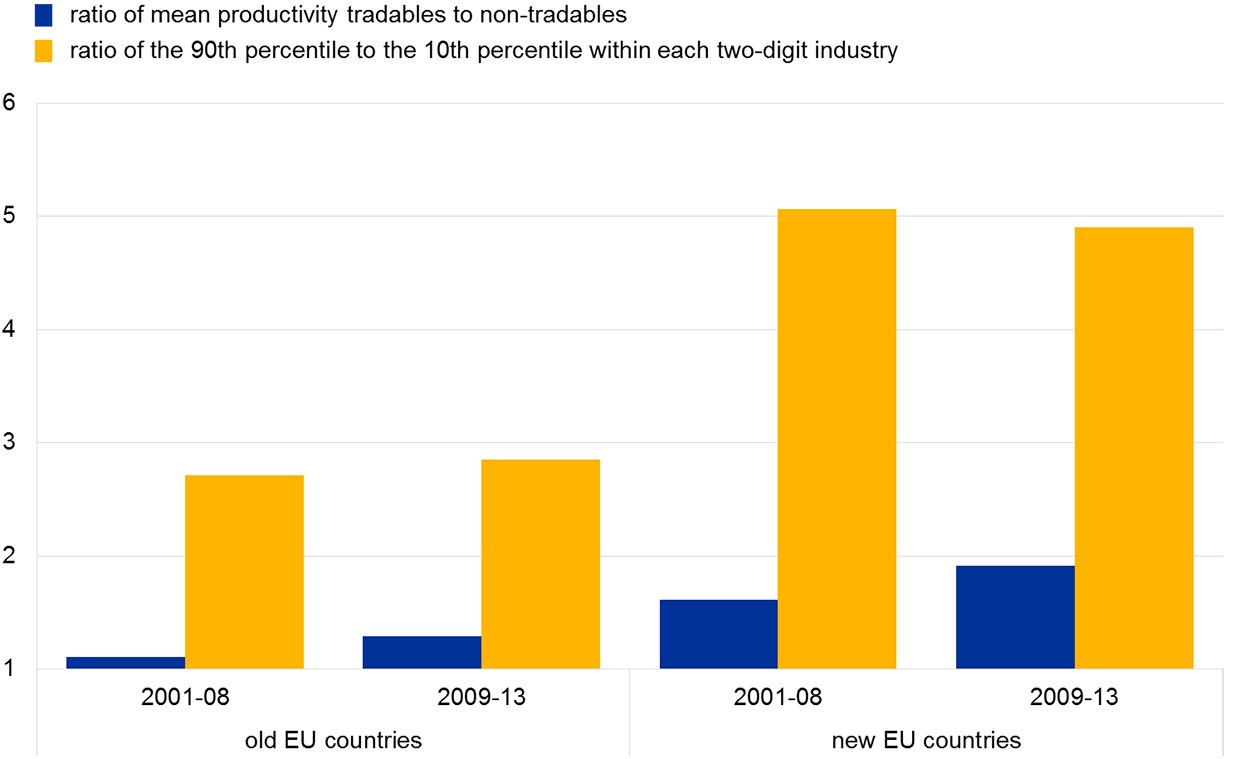
Source: CompNet. Lopez-Garcia, P. et al (2015): “Assessing European competitiveness: the new CompNet micro-based database”, Working Paper Series, No 1764, ECB.
Notes: According to the AMECO classification, tradable sectors include: manufacturing, wholesale and retail trade, transportation and storage, and information and communication technology. Non-tradable sectors include: construction, hotels and restaurants, and professional and administrative services. The within-sector 90th percentile/10th percentile productivity ratio is aggregated to the country level using sector shares in total value added. The “old” EU countries are Belgium, Denmark, France, Italy, Portugal and Finland. The “new” EU countries are the Czech Republic, Estonia, Croatia, Latvia, Lithuania, Hungary, Romania, Slovenia and Slovakia.
How, then, can we improve the diffusion of innovation from the frontier to the laggard firms, especially within sectors? Research suggests three main areas that will improve the capacity of, and incentives for, firms to adopt new technology: (i) investing in human capital and managerial ability, (ii) investment in intangibles, and (iii) improving economic dynamism.
Investment in human capital and management
First, there is now an extensive literature on the complementarities between technology and workforce skills, and on how better human capital increases the capacity to absorb technologies.[7] Human capital includes not just formal education, but also on-the-job training and job security – firms with a large proportion of workers on temporary contracts underperform in terms of innovation.[8]
Managerial ability is also key for the adoption of technology. New technologies often require new structures and a reorganisation of production to maximise efficiency gains. While managerial quality is hard to quantify, the existing studies find a statistically strong correlation between a firm’s managerial quality and its total factor productivity.[9] One of the channels through which managerial practices enhance firm performance has been found to be the increased capability of firms to absorb new technologies.[10]
Certainly there is potential to improve education systems in the euro area and thereby to give greater numbers of graduates the necessary technical and scientific skills. Our co-hosts today, MIT, came top of the latest QS world university rankings. There are nine UK universities and two Swiss universities in the top 50 of those rankings, but only one euro area university.[11]
And education is not just for the young. Improving the provision of life-long learning and retraining programmes will aid the flow of skilled labour towards more productive businesses.
Investment in intangibles
Second, numerous studies have shown that firms which invest more in intangibles are in a better position to understand and benefit from new technologies.[12] Such investment includes conducting their own R&D and developing their own intellectual property, as well as investment in branding, software and databases.
Investment in intangibles also appears low in the euro area compared with a number of other advanced economies, although it has been on an upward trend. The aggregate number also masks a wide country-level disparity, with the lack of intangibles investment particularly acute in some countries. Increasing the resources devoted to R&D would improve the ability of euro area firms to absorb more innovation.
Economic dynamism
The third main factor increasing absorptive capacity is the framework in which the business operates. Greater economic dynamism, from competition to higher rates of business entry, plays an important role in incentivising firms to adopt new technology.[13] Ensuring that failed firms are able to smoothly exit the market is also key to enabling capital and labour to be allocated to where it can be more productively used.
Business churn – the combined rate of business formation and closure – has been declining in Europe and the United States since just before the crisis (Chart 4). In lock step with the decline in churn, evidence suggests that capital misallocation has been rising in both regions.[14]
Chart 4: Business churn in the United States and Europe

Sources: Eurostat and US Census.
Note: EU14 comprises Austria, Belgium, Denmark, Finland, France, Germany, Ireland, Italy, Luxembourg, the Netherlands, Portugal, Spain, Sweden and the United Kingdom.
As an example of barriers to business creation, it takes on average about 10 days to start a new business in the euro area. Depending on the country it can take between four days and almost a month. Yet in the global best performer – New Zealand – it is possible to set up a business in less than a day. There are barriers as well to the orderly exit of firms. Resolving insolvency takes an average of almost two years in the euro area, three times longer than in the best three performing countries.
This is why we talk frequently about the need for structural reforms of regulatory and judicial processes to bolster business dynamism, as well as the need to complete the Single Market. This is especially true in services, where the laggard firms are noticeably behind the frontier.
Of course, creating the right regulatory framework and market conditions to nurture innovation and promote its transformation into new products and processes is complex, and there is no particular established winning formula. But there are a number of countries in the euro area that have proven relatively more successful at putting in place an effective “innovation ecosystem”.
One of the aims of this conference is to investigate international and euro area best practice and facilitate the sharing of that knowledge with countries where an effective ecosystem has yet to be established.
Conclusion
Let me conclude.
There are many reasons why it is a priority today in the euro area to address weak productivity growth. But while some progress can be made in innovation, it is not in my view the sole issue. It is equally important for the euro area to facilitate and encourage the spread of new technology from the frontier to the laggard firms.
Simply by diffusing better the technology we already have in the euro area, we could make sizeable gains in productivity. In other words, there is much we can still do to reverse the aggregate productivity slowdown and dispel pessimism about our future.
[1]Gordon, R. (2016), The Rise and Fall of American Growth: The US Standard of Living since the Civil War, Princeton University Press.
[2]See Fernald, J. (2014), `Productivity and Potential Output Before, During, and After the Great Recession', Federal Reserve Bank of San Francisco Working Paper Series (2014-15) and Cette, G., Fernald, J. G., and B. Mojon, 2016. “The Pre-Great Recession Slowdown in Productivity.” Federal Reserve Bank of San Francisco Working Paper 2016-08.
[3]See, e.g. Brynjolfsson, E. and A. McAfee (2014), The Second Machine Age: Work, Progress, and Prosperity in a Time of Brilliant Technologies, W. W. Norton & Company.
[4]See Veugelers, R. (2016), “The European Union’s Growing Innovation Divide”, Bruegel Policy Contribution, Issue 2016/08, April 2016 and Mazzucato, M. (2013), The entrepreneurial state: debunking public vs. private sector myths, Anthem.
[5]Bloom, N., Sadun, R. and van Reenen, J. (2012), “Americans Do IT Better: US Multinationals and the Productivity Miracle”, American Economic Review, 102(1): 167-201 and van Welsum, D., Overmeer, W. and van Ark, B. (2013), “Unlocking the ICT growth potential in Europe: Enabling people and businesses”, report prepared for the European Commission.
[6]For example, Syverson, C. (2004): “Product Substitutability and Productivity Dispersion.” Review of Economics and Statistics, 86(2): 534–50 shows that within four-digit industries in the US the top 10% of firms are, on average, two times as productive as the bottom 10%.
[7]See, for example, Acemoglu (2007), “Equilibrium Bias of Technology”, Econometrica, 75: 1371–1409
[8]See Albert, García-Serrano and Hernanz (2005) and Lopez-Garcia and Montero (2011), and Bentolila, S. & Dolado, J. and Juan Jimeno, J., (2012), "Reforming an insider-outsider labor market: the Spanish experience," IZA Journal of European Labor Studies, 1(1): 1-29.
[9]Bloom, N. and J. Van Reenen (2007), “Measuring and Explaining Management Practices Across Firms and Countries”, Quarterly Journal of Economics, 122(4): 1351-1408 surveyed managers from over 700 medium-sized firms in the United States, United Kingdom, France, and Germany and find that spanning the interquartile range of the management score distribution, for example, corresponds to a productivity change of between 3.2 and 7.5 percent. This is between 10% and 23% of TFP’s 32 percent interquartile range in their sample.
[10]See, for example, Garicano, L. and P. Heaton, (2010). "Do Computers Help Police Fight Crime?," CentrePiece - the magazine of economic performance 247, Centre for Economic Performance, LSE; and Bloom et al. (2012), op. cit.
[11]QS world university rankings, https://www.topuniversities.com/university-rankings/world-university-rankings/2016
[12]Numerous studies have demonstrated that a country’s ability to absorb international technological advances relies on its exposure to them, and its absorptive capacity as proxied by investment in R&D and labour force qualifications. See Coe, D.T., Helpman, E. and A.W. Hoffmaister (1997), Engebrecht (1997), Frantzen (2000) and Griffith, Redding and van Reenen (2004).
[13]See, e.g., Bartelsman, E., Haltiwanger, J. and S. Scarpetta (2013), “Cross-Country Differences in Productivity: The Role of Allocation and Selection”, American Economic Review, 103(1): 305-334 and Haltiwanger, J., Jarmin R., Kulick, R. and J. Miranda (2016), “High Growth Young Firms: Contribution to Job, Output and Productivity Growth”, mimeo.
[14]Gamberoni, E., Giordano, C. and P. Lopez-Garcia (2016), “Capital and labour (mis)allocation in the euro area: some stylized facts and determinants”, ECB Working Paper No 1981 and Hsieh, C. and Klenow, P. (2009): “Misallocation and Manufacturing TFP in China and India”, Quarterly Journal of Economics, 124(4) 1403-1448. Note that data for the US refer to different waves of the US Census up to 1997.
Eiropas Centrālā banka
Komunikācijas ģenerāldirektorāts
- Sonnemannstrasse 20
- 60314 Frankfurt am Main, Germany
- +49 69 1344 7455
- media@ecb.europa.eu
Pārpublicējot obligāta avota norāde.
Kontaktinformācija plašsaziņas līdzekļu pārstāvjiem