
The challenges of surveillance and coordination
Speech by Lorenzo Bini Smaghi, Member of the Executive Board of the ECB, International symposium of the Banque de France, Regulation in the Face of Global ImbalancesParis, 4 March 2011
Introduction
There is a broad consensus that the crisis we’ve been living through the last three years is the result of imbalances accumulated both at the macro and micro level, mainly in advanced economies. Surveillance of these imbalances was clearly insufficient. Any prescription to improve the resilience of our economies must thus include a strengthening of surveillance.
I will concentrate in my remarks on macroeconomic issues.
There has been a lot of discussion on what went wrong with surveillance, in particular at international level. The IMF should be praised, in particular, for having its own surveillance process independently evaluated. The results of this analysis were published in January this year. [1] Maybe in Europe we should follow the same transparent and open procedure to get a better understanding of what didn’t work.
The recommendations offered by the Independent Evaluation Office are mainly procedural and concern the workings of the IMF. They included creating an environment that encourages candour and diverse or even dissenting views; overcoming the silo mentality; speaking truth to power; and delivering clear and consistent messages. These are recommendations which should probably be taken to heart by other institutions too.
I would like to address a more fundamental issue, concerning the ability of our current analytical tools to capture the changes which have taken place over the last two decades. As surveillance is ultimately based on a conceptual framework, then if that framework is biased, we are inevitably less able to capture imbalances and to detect risks to the world economy. So it’s important to assess whether the crisis has challenged some of the main assumptions of our framework.
Work in this area has already started, to some extent. One key assumption which has been challenged, for instance, regards the efficient market hypothesis. In prevailing models, markets are assumed to price risk efficiently and to reflect underlying fundamentals. Thus, as long as asset prices do not reflect a change in the market assessment of risk, the risk is assumed not to exist or is underestimated. And often policy-makers behave as if the risk simply didn’t exist as has been the case for sovereign risk or inflation risk.
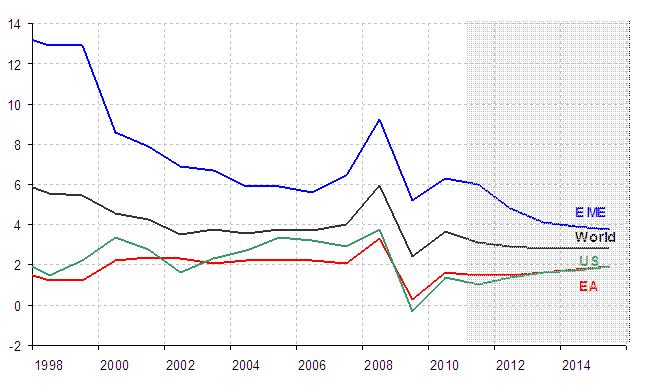
I would also like to examine another fundamental assumption of our economic models which has largely gone unchallenged, or at least has been insufficiently considered in my view. It is the impact of ‘globalisation’, i.e. the strong and sustained growth of emerging market economies (EMEs), on the long-term trends of the world economy, including the effects on advanced economies (Charts 1 and 2). In most of our macro models, long-term variables, such as potential growth or the ‘natural rate of interest’ or the non-accelerating inflation rate of unemployment (NAIRU), play a very important role. They determine, for instance, the output gap, domestic inflationary pressures, and as a consequence the structural indicators that are used to assess fiscal policy and the degree of monetary accommodation. These variables are estimated in large advanced economies like the US as if the latter were a closed economy. They are considered as independent variables for the rest of the world.
To use some model terminology, most of our models are built on the assumption that Ῡ – which represents the long-term growth rate of the economy – is influenced mainly by domestic factors such as productivity and population growth. Similarly, r* – which represents the world interest rate for most small open economies – is assumed to be determined by long-term equilibrium conditions in the US.
Given the importance of these variables for our models, a bias in their measurement would have a direct impact on the assessment of economic conditions, on the forecasts and on the policy prescription. It would seriously undermine surveillance. For instance, if the long-term trend growth of the economy is overestimated, the output gap (in absolute terms) would as a consequence be overestimated too and so would the deflationary risks. Monetary and fiscal policies would then be considered, ceteris paribus, as excessively tight and there would be a bias towards excessive expansion, with a view to achieving an optimistic rate of growth. The borrowing capacity of countries, households and companies would also be overestimated if their potential growth were overestimated. Ex post, the miscalculation of growth potential would result in an excessive accumulation of debt, both public and private, a misalignment between the interest rate and its long-term ‘neutral’ level, and insufficient savings.
As shown by Kydland and Prescott in their work on time inconsistency of optimal policy, which was later applied to monetary policy by Barro and Gordon, policy-makers who aim at excessively ‘optimistic’ growth will conduct an inconsistent policy which will generate instability. The solution to this problem, at least for monetary policy, is to set a rule or establish an independent central bank which is aware of such an inconsistency and has a sufficiently long horizon to avoid it. This assumes however that the independent policy-maker knows what the right, ‘not over-optimistic’ long-term growth of the economy is. He or she also has to know what the right model of the world economy is.
This brings me back to the question I raised at the start, i.e. the impact of globalisation on the long-term growth of advanced economies. Let me put it differently: is potential growth in those economies being affected by the fact that one part of the world, with nearly two-thirds of its population, is growing on average by 6-7% (or more) per year? If so, in what ways? One hypothesis which we may want to assess and test is that the so-called ‘long term equilibrium’ variables which are so important in our economic models are in fact affected by globalisation, as advanced economies are becoming smaller and smaller. Not taking this into account may induce policy-makers to misjudge the situation and cause international surveillance to fail.
These are clearly very difficult issues to examine. However, it seems to me that the analysis so far is insufficient. I won’t go into detail but would just like to pose some questions.
Growth
The first issue, or question, I would like to raise is whether the increase in growth rates in EMEs has had, and will have, a negative or a positive impact on trend growth in advanced economies. Taking a standard neo-classical trade model, the answer depends on various assumptions.
The prevailing consensus is that globalisation provides opportunities for all, including advanced economies; their growth will not necessarily suffer. This is the conventional wisdom. Paul Samuelson, however, has pointed out the restrictiveness of assumptions which are required to obtain the above-mentioned result. [2] He draws attention to the fact that the long-term impact of innovation abroad in a world of free trade and mobile capital is not unconditionally welfare-enhancing. His observations have not given rise to much debate. Maybe it’s time to revive such a debate.
There are several ways in which faster growth in EMEs may have a negative impact on advanced economies and dampen their production potential, at least for some time. One way is through the classical side-effect of comparative advantage. If the dislocation phenomenon is long and sizeable enough, the transition to the new steady state is bound to take a long time, during which growth will be subdued. [3] There may be reasons for believing that the adjustment process we are currently experiencing, with hundreds of millions of people gaining access in a very short time to the market economy, is not necessarily consistent with the simplified trade models that we used in order to analyse changes in comparative advantage.
Some of these issues linked to globalisation have been considered from the perspective of technological change. In ‘Fault Lines’, for instance, Raghu Rajan considers that the main reason for the rising inequality in the US over the last 20 years has been the inability of the middle class to adapt to new technologies. The changes in technology required to maintain the advanced economies’ competitive position may be the result of the rise in productivity and the competitiveness of EMEs, especially if this affects low value-added sectors as well as increasingly high-tech sectors and services.
The US economy was capable of growing at a fast pace prior to the crisis mainly through borrowing. Such borrowing was rational only if households and firms expected their income to increase in the future, at a faster pace, and if asset prices continued to increase, which ultimately did not happen. In fact, economic growth and asset price increases were the result of overly expansionary fiscal and monetary policies, predicated on measures of output gaps which turned out to be much smaller than estimated in real time, as well as regulatory failures justified by the desire to improve access to borrowing.
Another way in which faster growth in EMEs can impact negatively on growth in advanced economies is through changes in the terms of trade (Chart 3). These changes can occur via different channels. One is through commodity prices (Chart 4). For a given supply, the higher and persistent growth in EMEs is pushing up demand for commodities, in particular food and energy, and increasing these prices permanently, in terms of overall levels and rates of change. Of course, this depends on supply elasticity. However, it may take time to develop new sources of supply that can keep up with demand. The increase in commodity prices weighs negatively on countries which consume more of these products – mainly the advanced economies – and on those with lower productivity growth.
Another ‘negative-impact’ channel is the Balassa-Samuelson effect, according to which prices of manufactures and services in EMEs increase more rapidly than in advanced economies. To the extent that these prices remain lower than those in advanced economies, any increase will worsen the latter’s terms of trade, especially if domestic production is limited or has been totally offshored.
To sum up, there is a need for more analysis of how growth potential is affected by ongoing developments, such as globalisation. My impression is that there is too little work being done on this issue; I fear that we will exit from the crisis with the same old analytical instruments and assessment that we had prior to the crisis – the very same ones which were responsible for the insufficient surveillance of economic developments and policies.
Inflation
Inflation is the second way in which the strong, steady progress of the EMEs is affecting advanced economies (Chart 5). Ongoing increases in the prices of imported products have an impact on inflation in the advanced countries. [4] This effect occurs through two channels. The first is simply mechanical, arising from the weight of imported goods in the basket of goods and services purchased by households. For example, food and energy account for about 30% of the average shopping basket in the euro area. Assuming that, as a result of increased demand from EMEs and insufficient supplies, commodity prices increase on average by 4% a year, more or less in line with the growth rate of the world economy (or long-term interest rates, according to the Hotelling rule), average prices in the euro area will increase by 1.2% simply because of the effect of these products.
What about the implications for prices of other products? The remaining 70% of the basket includes manufactured goods and services, some of which are imported and others are produced domestically. Assume, for simplicity’s sake, that these goods are only produced domestically. If the prices of these products grow at a rate of 2% per year, the overall average inflation is 2.6%, exceeding the 2% objective of most central banks in advanced countries, including the ECB’s. If some of these goods and services are produced abroad, the rate of their price increase may be even higher, due in particular to the Balassa-Samuelson effect that I mentioned previously. As the shifting of production to countries with lower wages tends to fade away, any wage increase or exchange rate appreciation in EME will lead to higher import prices in advanced economies.
The central bank then has to choose between either revising the inflation rate objective upwards and taking account of imported inflation, or maintaining the inflation objective unchanged, which means lower core inflation. In both cases, headline inflation is bound to be higher than core inflation. This means that price increases for imported goods must not feed into wages and domestic prices.
The implications for monetary policy are quite complex. The stance of monetary policy cannot be assessed on the basis of core inflation, given that the interest rate incorporates expectations of headline inflation. Keeping the policy interest rate unchanged while headline inflation rises - even if core inflation remains unchanged - implies de facto allowing for the monetary stance to become more accommodative. Over time this is likely to impact on core inflation.
It is certainly a challenge to make sure that core inflation remains subdued and lower than headline inflation if imported goods prices increase by more than 2%. This can be achieved without additional monetary policy tightening only in a friction-less world, in which domestic wage and price-setters accept the permanent change in relative prices.
We obviously need more work on these issues, which are particularly relevant in light of past experience. Indeed over the past decade international and national institutions have often made forecast errors in the same direction, underestimating inflation and overestimating growth in advanced economies (Chart 6). This has led to an overly accommodative policy. If we want to avoid repeating the same bias, we should be more alert to this issue.
Macroeconomic policies
Another way in which advanced economies are affected by globalisation is through its unbalanced nature. Globalisation is very advanced in trade and economic activity. In the financial area, however, globalisation is more limited, in the sense that EMEs are characterised by an excessive demand for and an insufficient production of high quality financial assets. Many EMEs are net savers and export capital to advanced economies. This is the result of various factors, not least the lower degree of globalisation of their policies and institutions. This limited globalisation can be seen particularly in the lack of independent monetary policies and the pegging of exchange rates, which leads to the accumulation of large foreign exchange reserves and to misaligned prices (Chart 7).
As a result of these imbalances, interest rates in advanced economies may be lowered artificially, to a level which may create problems for their pursuit of price and financial stability (Chart 8). Again, in most of our macro models the interest rate which affects global financial markets (the so-called r*) is anchored on the US economy. This is clearly not the case in reality as the US rate is affected by capital flows from the rest of the world which are evidently not easy to ‘sterilise’. The effectiveness of monetary policy is affected by such influxes. Given that the US interest rate is nevertheless the reference for global financial markets, the reflow of funds produces second- and third-round effects on EMEs and on advanced economies (Chart 9). We are witnessing a paradox: EMEs as a whole are being inundated with short-term capital inflows, and yet they are net capital exporters.
We have also failed to understand how these capital flows have increased the liquidity in the financial system and influenced the behaviour of economic agents. For instance, the impact that the pre-crisis low interest rate level had on the propensity of financial institutions to relax credit standards, to increase leverage and to pursue carry trades was underestimated (charts 10, 11, 12). Policy-makers not only ignored it but considered that this had nothing to do with risks to price stability, that it was related to financial stability and had to be addressed through prudential regulation.
Another issue which requires further discussion is the role that the financial industry has played in advanced economies. The conventional wisdom is that financial innovation and financial deepening promotes growth. However, the evidence is controversial and it is not clear to what extent the industry has benefited the long-term growth potential of these economies. To be sure, it has increased their fragility, especially with respect to their public finances. It is no surprise that most of the countries with the largest deficits and the largest increase in debt after the crisis have been those in which the financial sector played an increasing role, also as a source of fiscal revenue. As the financial industry becomes less profitable, and provides less tax revenue, the gap has to be filled by other sources of taxation, or lower public expenditures, which may be politically difficult to accept. These aspects may not have been fully incorporated in the projections for the adjustment of public finances in many advanced economies, unless it is expected that the financial sector will return to its pre-crisis peak, which is a risky assumption.
More generally, this crisis has shown the vulnerability of public finances to volatile structures in the economy. In good times, volatile sources of income, such as those from the financial sector or the housing market, may overestimate the soundness of public finances, while the adjustment costs in the downturn may be enormous. A case in point is that of Ireland, which during the pre-crisis years was able to reduce taxes and increase expenditures for an amount of about 12% of GDP (in the period 2003-2008), thanks to the rise in revenues from the financial sector and from housing. The comparatively large size of these two sectors made Irish public finances vulnerable to the bust of the cycle, leaving personal income tax as the shock absorber until the economy recovers. Interestingly, the fiscal package that is included in the Irish adjustment programme with the IMF is of a comparable magnitude to the pre-crisis fiscal expansion.
Surveillance has clearly failed to understand this phenomenon. More attention needs to be paid to the overall size and interconnectedness of the financial sector as a whole in the various countries, and to the ability of these countries to absorb shocks affecting not only a single financial institution but the whole financial system. It is now fashionable to stress-test the banks. It would probably be appropriate to stress-test countries as well.
Conclusions
Let me conclude by suggesting that surveillance of the world economy, in particular some of its systemically relevant members, has to focus more on the sustainability of their policies, in particular their fiscal and monetary policies. Some policies may appear to be sustainable on the basis of assumptions which may turn out to be simplistic, especially those relating to long-term trends of growth and inflation. In particular they may not take sufficiently into consideration the impact of broader developments under way in the global economy.
As Keynes said, we may be “slaves of some defunct economist”. The textbooks which most of us studied depicted a world economy different from the one we are confronted with today and certainly different from the one which will take shape in the coming years. That environment was characterised by one large economy, which set the reference interest rate, and by many small ones. What used to be the leading economies are getting smaller and smaller, while others are growing fast and becoming systemically relevant. The imbalances are the result of both sides not fully recognising these opposite developments and acting as if the old paradigm was still valid.
What is required are not changes at the margin, but a global framework that can encompass the unprecedented changes which are taking place. Otherwise our analysis will fall short, our surveillance will remain weak, and the policy mistakes may become more frequent, and more costly.
Thank you for your attention.
| Chart 1: Real GDP in selected countries and regions |
 |
| Note: Annual; 1992 = 100. Data based on IMF WEO October 2010 database. Grey shaded area indicates the evolution based on the IMF October 2010 WEO projections up to 2015.Sources: IMF WEO and ECB staff calculations. |
| Chart 2: Real GDP per capita in selected countries and regions |
 |
| Note: Annual; 1992 = 100. Data shown is calculated on the basis of 2000 constant US dollar series.Sources: World Bank Development Indicators Database, Haver Analytics and ECB staff calculations. |
| Chart 3: Terms of trade developments in selected countries and regions |
 |
| Note: Annual; average 1996-1998=100; three year moving averages shown. Data based on IMF WEO October 2010 database.Sources: IMF WEO, Haver Analytics and ECB staff calculations. |
| Chart 4: Commodity price developments |
 |
| Note: Last observation refers to 2010Q3 for EME real GDP. For Brent oil prices and commodity price indexes data is quarterly up to 2010Q4. Last data point in chart for Brent oil price is spot price on 2 March 2011 and for non-energy commodity indexes January 2011. EME real GDP index for 1996Q2 = 100. Oil prices are quoted in US dollars.Sources: Haver Analytics, IMF IFS and ECB Staff Calculations. |
| Chart 5: Inflation rates in selected countries and regions |
 |
| Note: Annual; %. Data based on IMF WEO October 2010 database. Grey shaded area indicates the evolution based on the IMF October 2010 WEO projections up to 2015.Sources: IMF WEO, Haver Analytics and ECB staff calculations. |
| Chart 6: IMF WEO two year ahead forecast errors |
 |
| Note: Forecast errors were calculated as the actual minus the two year-ahead autumn projected figures produced during the preceding year. A positive figure thus shows an underestimation, a negative figure an overestimation.Sources: IMF WEO and ECB staff calculations. |
| Chart 7: Foreign exchange reserves in selected countries and regions |
 |
| Note: Monthly; billion USD. Last observation refers to December 2010 in the case of the US, China and the euro area and to November 2010 in the case of EMEs and World.Sources: IMF IFS, PBoC, Haver Analytics and ECB staff calculations. |
| Chart 8: Real ex-post short-term interest rates and real GDP growth – US and EA |
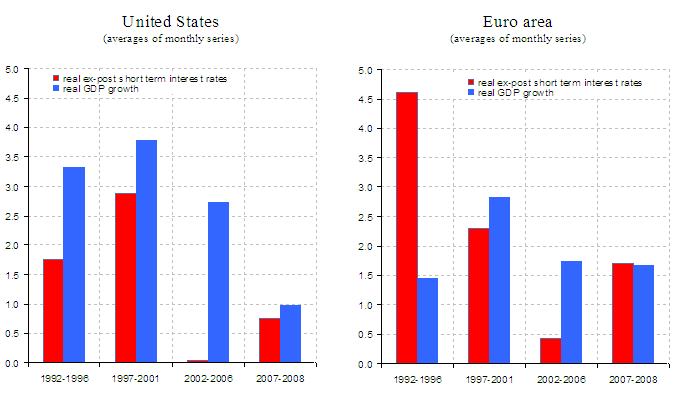 |
| Note: Last observation refers to January 2011 for the US and December 2010 for the euro area.Sources: National sources, Haver Analytics and ECB staff calculations. |
| Chart 9: Real ex-post short-term interest rates and real GDP growth – China and EMEs |
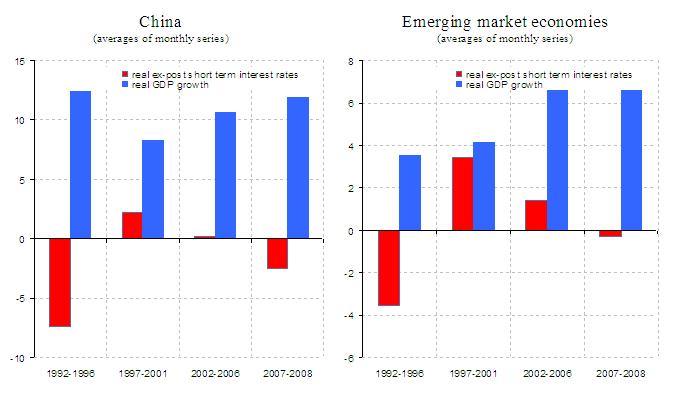 |
| Note: Last observation refers to January 2011 for China and November 2010 for EME aggregate. Aggregate created on the basis of GDP PPP weights from IMF October 2010 WEO (2009 fixed weights).Sources: National Sources, Haver Analytics and ECB staff calculations. |
| Chart 10: Monetary policy accommodation and lending standards |
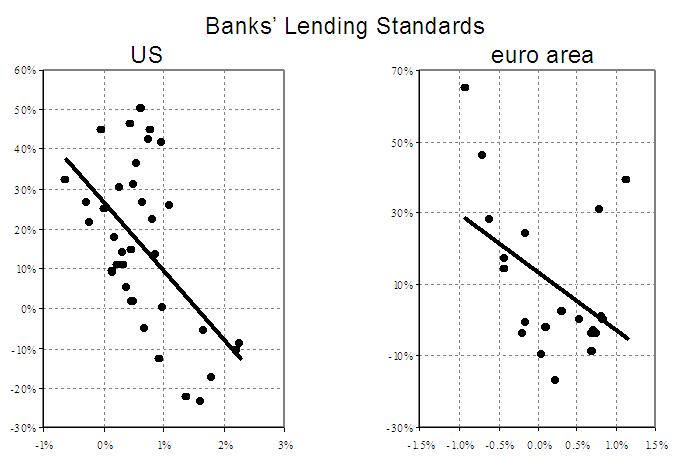 |
| Note: Monetary policy accommodation is proxied by the residual of an estimated monetary policy reaction function (with inverted sign). For the US it is based on G. Rudebusch (2009), ‘The Fed’s Monetary Policy Response to the Current Crisis’, San Francisco Fed Economic Letter. For the euro area it is based on an update of the reaction function estimated in L. Christiano, R. Motto and M. Rostagno (2010), ‘Financial Factors in Economic Fluctuations’, ECB WP No. 1192. The lending standards are the net percentage of respondents tightening lending standards to enterprises. Subject to data availability, the sample is 1999-2007. The lead of monetary policy varies.Source: ECB Staff calculations. |
| Chart 11: Monetary policy accommodation and price of risk |
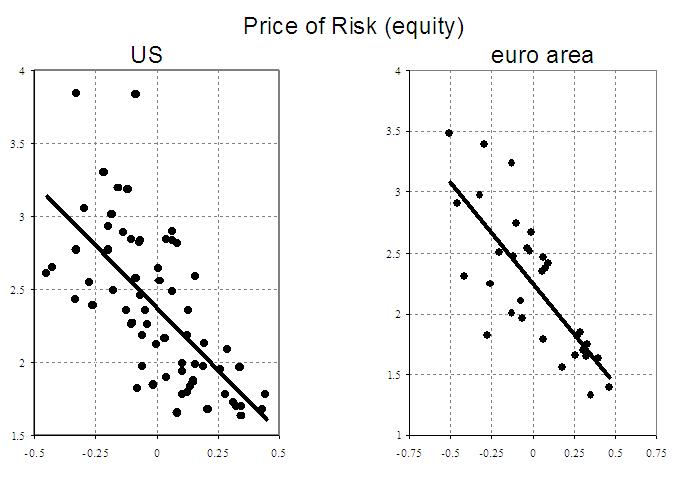 |
| Note: The price of risk of equity is derived from the VIX-index following Bekaert et al. (2010), ‘Risk, uncertainty and monetary policy’, NBER Working Paper Series No. 16397. The charts (logarithmic scale) are based on the historical decomposition derived from their multivariate model, extended also to the euro area. Subject to data availability, the sample is 1991-2007.Source: ECB staff calculations. |
| Chart 12: Monetary policy accommodation and leverage |
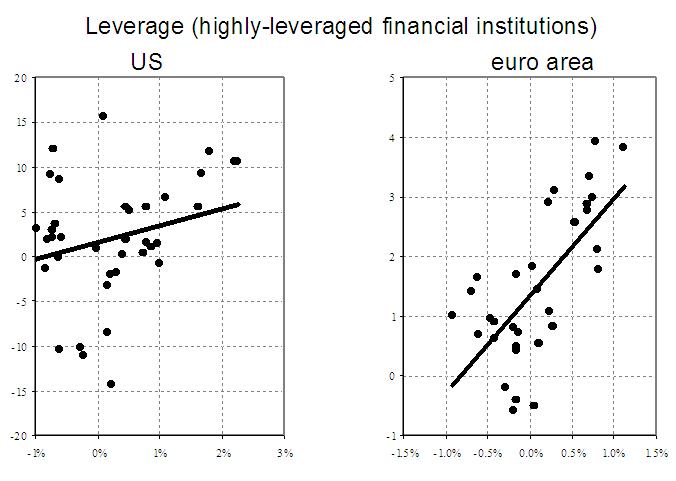 |
| Note: Monetary policy accommodation is proxied by the residual of an estimated monetary policy reaction function (with inverted sign). For the US it is based on G. Rudebusch (2009), ‘The Fed’s Monetary Policy Response to the Current Crisis’, San Francisco Fed Economic Letter. For the euro area it is based on an update of the reaction function estimated in L. Christiano, R. Motto and M. Rostagno (2010), ‘Financial Factors in Economic Fluctuations’, ECB WP No. 1192. For the US leverage is computed as the year-on-year change in the leverage ratio of brokers and dealers. For the euro area it is computed as the year-on-year change in the leverage ratio of OFIs computed on the basis of asset transactions to make sure that movements in leverage are not dominated by revaluation of assets. Subject to data availability, the sample is 1997-2007.Source: ECB Staff calculations. |
-
[1] IMF Performance in the Run-Up to the Financial and Economic Crisis: IMF Surveillance in 2004–07, 10 January 2011. See http://www.ieo-imf.org/eval/complete/pdf/01102011/Crisis_Report_English.pdf
-
[2] P. Samuelson (2004), “Where Ricardo and Mill Rebut and Confirm Arguments of Mainstream Economists Supporting Globalization”, Journal of Economic Perspectives, 18, 3, pp. 135-146.
-
[3] L. Bini Smaghi (2009) “ Towards the G8 – strategies for emerging from the crisis”, LUISS Guido Carli University, Rome 27 May 2009.
-
[4]L. Bini Smaghi (2011) “ The challenges facing monetary policy”, Bologna, 27 January.
Eiropas Centrālā banka
Komunikācijas ģenerāldirektorāts
- Sonnemannstrasse 20
- 60314 Frankfurt am Main, Germany
- +49 69 1344 7455
- media@ecb.europa.eu
Pārpublicējot obligāta avota norāde.
Kontaktinformācija plašsaziņas līdzekļu pārstāvjiem