






Along the curve: investor reallocation in euro area government bonds
Published as part of the Financial Stability Review, May 2026.
After a period of relative flatness, the yield curve for euro area government bonds (EGBs) steepened markedly in 2025, driven mainly by rising yields at the long end. This trend has persisted amid continued upward pressure on yields, particularly for maturities beyond ten years. It reflects several factors, including fiscal expansion in response to geopolitical uncertainty, reduced demand from central banks and structural shifts such as the recent Dutch pension fund reform.[1] This box sheds light on the role that euro area investor composition plays in EGB markets in a context of steepening yield curves.
Euro area non-banks hold over 50% of outstanding long-dated EGBs and are thus particularly exposed to valuation losses when long-term interest rates rise. Investor composition in EGB markets depends heavily on the maturity bucket concerned: whereas banks and foreign investors generally hold the largest share of EGBs, it is euro area non-banks that hold the majority of sovereign debt at very long maturities (Chart A, panel a). Insurance corporations and pension funds typically hedge the duration gap on their balance sheets by holding long-term bonds and acting as fixed-rate receivers in interest rate swaps, with banks as the main counterparties in such transactions (Chart A, panel b). Swap rates for 30-year maturities have risen above ten-year rates, increasing the cost of hedging interest rate exposure at very long maturities (Chart A, panel c).[2]
Chart A
NBFIs are particularly exposed to a steepening of the yield curve through the impact of valuation effects on their EGB portfolios and the increasing cost of hedging interest rate risk
a) Investor base of euro area sovereign debt, by residual maturity | b) Net notional interest rate swaps, by holder sector and maturity | c) Swap rates for European sovereign bonds |
|---|---|---|
(Q4 2025; percentages, € trillions) | (Dec. 2025, € billions) | (2 Jan.-31 Dec. 2025, percentages) |
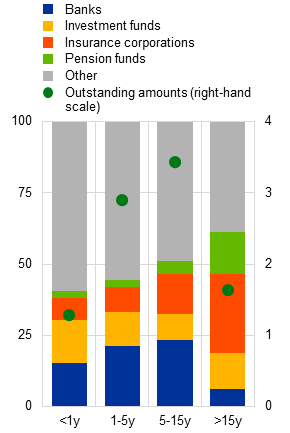 | 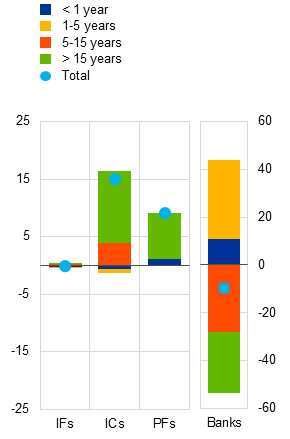 | 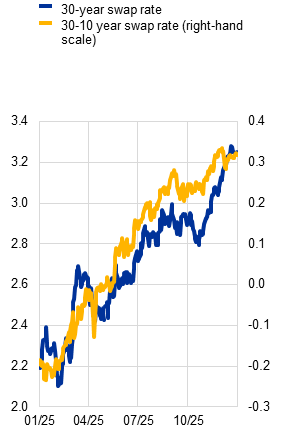 |
Sources: ECB (SHS, EMIR), Bloomberg Finance L.P. and ECB calculations.
Notes: Panel a: Eurosystem holdings are excluded from the amounts outstanding. Panel b: net notional positions in euro-denominated fixed-receive interest rate swaps, broken down by residual maturity (less than 1 year, between 1 year and 5 years, between 5 years and 15 years, more than 15 years). The data cover outstanding contracts referencing the euro short-term rate (€STR), the euro overnight index average (EONIA) and the interbank offered rate (EURIBOR), as reported by euro area institutions. Notional exposures are netted at the level of each reporting institution within each maturity bucket. Sector enrichment based on Lenoci and Letizia*. IFs stands for investment funds; ICs stands for insurance corporations; PFs stands for pension funds.
*) Lenoci, F.D. and Letizia, E., “Classifying Counterparty Sector in EMIR Data”, in Consoli, S., Reforgiato Recupero, D. and Saisana, M. (eds.), Data Science for Economics and Finance, Springer International Publishing, 2021.
Euro area investors in EGBs react more strongly to changes in yields in other maturity segments than to changes in yields for the bonds they currently hold. Granular data on sectoral holdings of sovereign bond can be used to estimate demand elasticities for changes in yield across different maturity buckets.[3] Although positive and statistically significant across investor sectors, the elasticity of holdings for the “own” maturity yield is smaller than the cross-maturity elasticity. This suggests that investors are more likely to reallocate away from a given maturity bucket when yields rise in alternative segments (Chart B, panel a).[4]
As a result, a shift in the yield curve may trigger portfolio rebalancing across maturities rather than a proportional expansion of holdings within each bucket. In the event of yield curve steepening, non-banks may leverage a positive rebalancing effect to stabilise longer-term bond yields. The extent to which non-banks do this depends on whether the drivers of the steepening are a bigger drop in the short-term rate or a bigger increase in the long-term rate. Given the greater cross-elasticity towards other maturity buckets, non-banks’ demand for long-term EGBs increases more if short-term rates fall than if long-term rates rise. Hence, during a steepening episode, non-banks generally increase their demand for long-term EGBs, but the magnitude of this increase is somewhat procyclical.
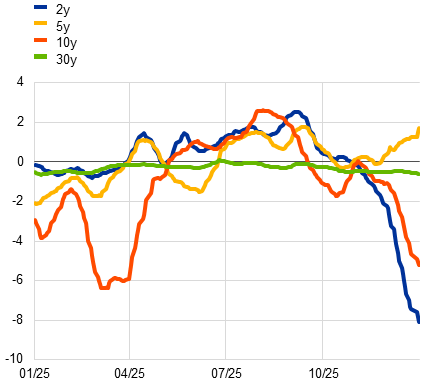
The presence of non-euro area investors in EGB markets increasingly reflects foreign hedge fund activity seeking to benefit from greater yield volatility. Data limitations prevent a decomposition of the foreign investor segment to estimate shifts in EGB holdings. For this reason, derivatives transaction data are used to gain insights into the behaviour of hedge funds from outside the euro area. Hedge funds pursuing arbitrage strategies have become an increasingly important source of liquidity in EGB markets.[5] Hedge fund activity in the EGB futures market during 2025 showed short positions concentrated in the first half and a marked repositioning towards the end of the year (Chart B, panel b). Notably, they maintained short positions in futures on very long-dated EGBs, potentially seeking to profit from heightened yield volatility at the long end of the curve.
Chart B
Changes in the yield curve prompt holder sectors to rebalance their exposure across different maturities, while hedge funds take positions in the EGB futures market to arbitrage pricing frictions
a) Impact of a 1 percentage point increase in own and other maturity yield on EGB holdings across investors | b) Positions of selected hedge funds in EGB futures, by residual maturity of the underlying securities |
|---|---|
(Q1 2016-Q3 2025; regression coefficients, percentages of GDP) | (2 Jan.-31 Dec. 2025; net notional outstanding, € billions) |
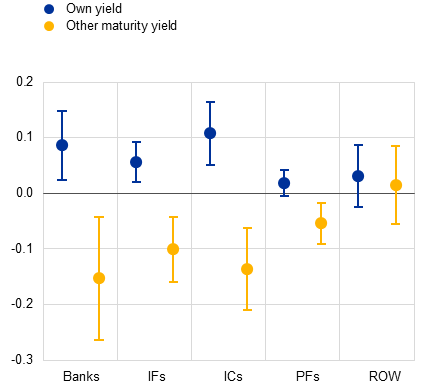 |  |
Sources: Eurostat, ECB (CSDB EMIR, MNA, SHS) and ECB calculations.
Notes: Panel a: the approach estimates demand elasticities to yields in different maturity buckets across sectors, based on security holdings data from Q1 2016 to Q3 2025. The respective maturity buckets are less than 1 year, between 1 year and 5 years, between 5 years and 15 years, and more than 15 years. The underlying model for estimating investor demand elasticities to yields in the own maturity bucket and cross-elasticities to yield changes in other maturity buckets is based on Jansen et al.* The regression equation follows the form: , where is the granular demand of sector i at time t for EGBs in maturity bucket m, is the average yield to maturity in maturity bucket m, called “own yield”, and is the average yield to maturity of all EGBs outside of bucket m, called “other maturity yield”. is a vector of macro variables including GDP, year-on-year GDP growth, sovereign debt-to-GDP ratio and core inflation at country level. represents fixed effects at the maturity bucket (m) and issuer-country (c) level. In line with Jansen et al.* and Fang et al.**, to address endogeneity concerns we instrument yields at the maturity-bucket and issuer-country level by regressing demand and supply on the macro variables and deducting a “pseudo-yield” from a market clearing condition. IFs stands for investment funds; ICs stands for insurance corporations; PFs stands for pension funds; ROW stands for the rest of the world, i.e. all non-euro area investors. Panel b: the sample comprises futures on German, French and Italian government bonds traded on Eurex, the most liquid and actively traded EGB futures market. Positions are measured as net open interest and netted at the level of the reporting counterparty and individual contract. Contracts are grouped according to the residual maturity of the underlying deliverable bonds (2-year, 5-year, 10-year and 30-year segments), allowing a decomposition of positioning along the maturity spectrum. The chart shows positions for a subset of hedge funds identified in the EMIR dataset as actively trading EGB futures during the sample period (2025).
*) Jansen, K., Wenhao, L. and Schmid, L., “Granular Treasury Demand with Arbitrageurs”, NBER Working Paper Series, No 33243, National Bureau of Economic Research, 2024.
**) Fang, X., Hardy, B. and Lewis, K.K., “Who Holds Sovereign Debt and Why It Matters”, The Review of Financial Studies, Vol. 38, Issue 8, August 2025, pp. 2326-2361.
See Böninghausen, B. and Vladu, A.L., “Sloping up: the repricing of euro area yields in 2025”, The ECB Blog, ECB, 16 January 2026.
The absolute cost of hedging depends on a range of variables which, beyond the swap rates, also include the net present value of the institution’s liabilities.
See Jansen, K., Wenhao, L. and Schmid, L., “Granular Treasury Demand with Arbitrageurs”, NBER Working Paper Series, No 33243, National Bureau of Economic Research, 2024.
The extent to which reallocation takes place along the yield curve is proportional to the amount of the actual sectoral holdings in the different buckets, as well as the investment mandate. As the “other yield” is calculated as an average across yields of holdings in other buckets, it represents to a larger extent long-term yields for sectors with sizeable holdings in long-term bonds, such as insurance corporations and pension funds. Banks and investment funds, on the other hand, are more heavily represented in shorter maturity bonds, meaning that the “other yield” represents a stronger tendency to reallocate to that part of the yield curve.
Given that the EMIR dataset only provides a view on the activity of non-euro area hedge funds in the European market, and not their offshore activities, this box can only refer to their dealings in the European market and cannot make a statement on the underlying hedge fund trading strategies that might be driving the activity.