
- Speech
Statistical implications of the ECB’s monetary policy strategy review
Keynote speech by Philip R. Lane, Member of the Executive Board of the ECB, International Association for Official Statistics (IAOS) Conference, Kraków
Kraków, 27 April 2022
Introduction
I am grateful for the invitation to participate in the 2022 conference of the International Association of Official Statistics (IAOS).[1] A regular dialogue between the producers and users of official statistics is essential in order to make sure that the statistics underpinning research and policymaking are properly understood by end users, while also identifying the potential for possible further improvements in the scope and design of official statistics.
In my remarks today, I will focus on two statistical issues that were highlighted in our recent monetary policy strategy review.[2] As you may know, the ECB completed its monetary policy strategy review in July 2021. In general, our monetary policy strategy provides a comprehensive framework within which we take our monetary policy decisions and communicate them to the public. The strategy review covered all aspects of monetary policy within the framework of our mandate, which is to maintain price stability. In relation to statistical requirements, the Governing Council recommended a more comprehensive inclusion of owner-occupied housing in the calculation of the Harmonised Index of Consumer Prices (HICP) and also identified a set of climate-related statistical indicators that would facilitate the ability of the ECB to integrate climate change and the carbon transition into its economic assessments and monetary policy framework. In what follows, I will explain these two issues in more detail.
Inflation measurement and owner-occupied housing costs
The Treaty-mandated primary objective of the ECB’s monetary policy is to maintain price stability. This means making sure that inflation – the rate at which the prices for goods and services change over time – remains low, stable and predictable. A key outcome of the strategy review is that the ECB Governing Council considered that price stability is best maintained by aiming for a two per cent inflation target over the medium term. This target is symmetric: negative and positive deviations of inflation from the target are viewed as equally undesirable. The quantitative target provides a yardstick for the ECB’s accountability and helps to achieve price stability by providing an anchor for inflation expectations.
The quantitative inflation target puts the appropriate measure of inflation centre-stage of the ECB’s monetary policy mission. The Governing Council confirmed that the HICP, as published by Eurostat, the statistical office of the European Union, remains the appropriate measure for assessing price stability.[3]
The Governing Council additionally recognised that a more comprehensive inclusion of the costs related to owner-occupied housing in the HICP would better represent the inflation relevant for households, as well as enhance the representativeness and cross-country comparability of the HICP. In doing so, the Governing Council also took into account the feedback received directly from the public in a sequence of “ECB Listens” events, where it was frequently highlighted that many participants considered housing-related costs to be an important element in overall household expenditure. The importance of accounting for housing-ownership related costs is underlined by the high share of owners, which stands at around 65 per cent on average in the euro area, and ranges from around 50 per cent to 90 per cent across countries. Analytically, a greater weight on housing in the overall price index would elevate the importance of domestic sources of inflation, since construction and housing-related services have a significant non-tradables component.
Since the HICP is largely constructed by tracking actual monetary transactions, the Governing Council prefers the “net acquisition” method for calculating owner-occupied housing costs by directly drawing on purchase prices. This approach is already used by Australia and New Zealand in calculating quarterly consumer price indices.
An alternative approach to quantifying owner-occupied housing costs is the rental equivalence method, which captures the opportunity cost of owner occupancy by imputing the rental income forgone by not letting the dwelling to a tenant. Imputed rents are used in the consumer price indices in the United States and in Japan, and in the national consumer price indices of Germany and the Netherlands. In the United Kingdom, imputed rents are included in the national consumer price index but the Bank of England is charged with a targeting a variant that excludes owner-occupied housing costs. Of course, imputed rents are also included in the measurement of output in the national accounts.[4]
As published by Eurostat, an owner-occupied housing price index (OOHPI) is available with a quarterly frequency for the euro area and the EU, as well as for all Member States with the current exception of Greece.[5] However, these data are published with a delay of more than three months, which is a considerable lag for monetary policy purposes. Still, by making informal calculations of plausible weights for owner-occupied housing in overall household expenditure, it is possible to make some experimental and provisional calculations of a synthetic consumer price index that combines the HICP and the OOHPI.
As captured by Charts 1 and 2, recent calculations by ECB staff show the differences across the net-acquisition and rental-equivalence approaches in relation to the 2012-2021 period.[6] Especially during periods when price-rental ratios undergo cyclical and/or structural shifts, the choice between the net acquisition method and the rental-equivalence method might have a material impact on the measurement of inflation and, by extension, the setting of monetary policy.[7]
Chart 1
HICP: two approaches for including owner-occupied housing in comparison
(lhs: annual percentage changes; rhs: percentage points)

Sources: Eurostat, ECB calculations.
Chart 2
HICP excluding energy and food (HICPx): two approaches for including owner-occupied housing in comparison
(lhs: annual percentage changes; rhs: percentage points)
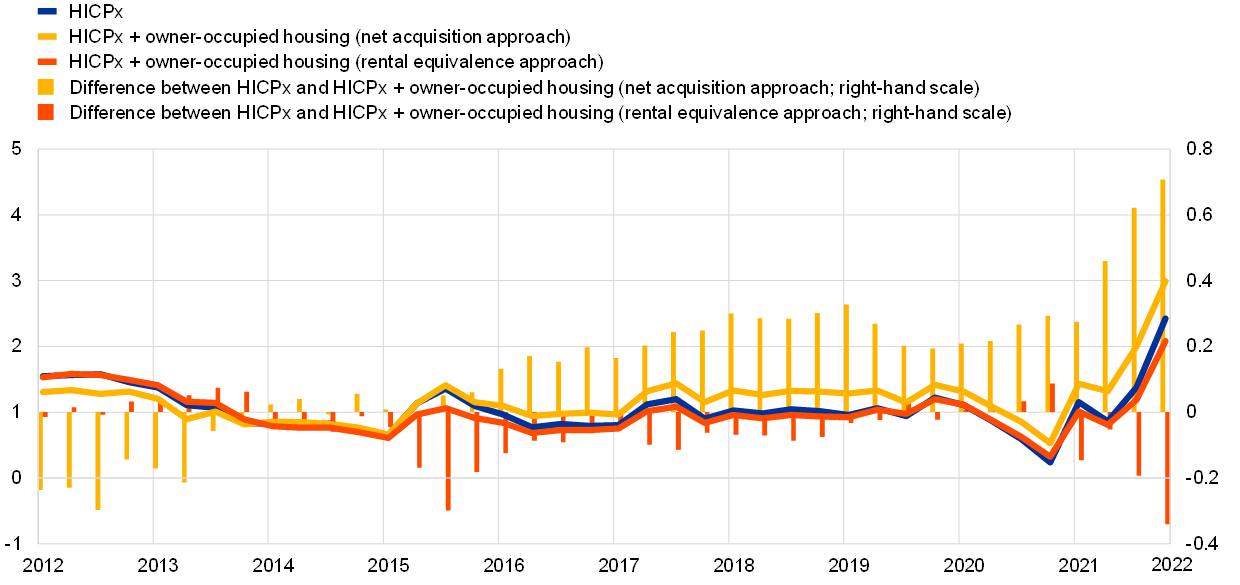
Sources: Eurostat, ECB calculations.
A basic challenge in the appropriate inclusion of owner-occupied housing costs in a consumer price index is that housing has a dual nature, since a buyer may have different intentions: she could treat the house only as an investment – by renting it out – or use it primarily for consumption – by occupying it as an owner. As the owner-occupier may also benefit from the increase in the value of the house over time, there is clearly an intrinsic dual investment-consumption role.
Ideally, to ensure that the HICP maintains its focus on consumption expenditure as required by the HICP regulation, only the consumption part of housing costs should be captured, which is typically un-observable. Identifying a practical approach to extracting the consumption component in housing costs clearly requires further research and testing. For instance, this could involve modelling techniques that adjust the raw information in house price dynamics (that surely has an investment component) through cross-referencing other data series, including information on land values, construction costs and rents, among others.
It is also important to learn from the international experience with a range of data collection methods. For instance, one interesting benchmark is provided by the “New Housing Price Index” published by Statistics Canada: based on an electronic survey, this monthly index is published in a timely manner. Since it provides separate estimates for the value of land and structures, it can go some way towards addressing the consumption/investment duality in house prices to the extent that the investment dimension is primarily captured in land values rather than the cost of structures.
Importantly, a focus on newly-built houses might offer scope for improving data collection, since the construction companies that sell new houses is a smaller population than the wide spectrum of participants involved in the sales of existing houses. For all countries, digital improvements in recording house purchases may help to produce better OOHPIs in terms of reporting frequency and timeliness.
The appropriate inclusion of owner-occupied housing costs in overall price indices is currently under discussion in the European Statistical System. Recognising that the full inclusion of owner-occupied housing in the HICP (especially with the appropriate adjustment to isolate the consumption component) is in any event a multi-year project, the Governing Council in its monetary policy assessments in the meantime takes into account inflation measures that include initial estimates of the cost of owner-occupied housing in its wider set of supplementary inflation indicators.
Climate change
Let me now turn to climate change. The ECB’s monetary policy strategy review fully recognised that climate change has profound implications for price stability through its impact on the structure and cyclical dynamics of the economy and the financial system. The carbon transition represents a major structural change for the global and European economies, with a significant economic transformation embedded in the commitments to significantly reduce carbon emissions by 2030 and attain net zero by 2050.[8] In principle, a sustained and predictable transition might be accomplished without significant macroeconomic volatility. However, both the physical risks and transition risks related to climate change may generate cyclical shocks that could require a monetary policy response. Indeed, in recent years, it has already proven important to take into account in our macroeconomic assessments both severe weather events that disrupt global production (such as floods and droughts around the world) and the implications of the carbon transition for industries such as the automotive sector. In addition, there are tail risk scenarios in which severe physical shocks or disorderly transition dynamics could threaten financial stability. At an institutional level, climate change and the carbon transition also affect the value and the risk profile of the assets held on the Eurosystem’s balance sheet.
For these reasons, the Governing Council has committed to an ambitious action plan to further include climate change considerations in its monetary policy framework.[9] The main focus areas of the action plan are summarised in Chart 3. First, the ECB will significantly enhance its analytical and macroeconomic modelling capacities and develop statistical indicators to foster the understanding of the macroeconomic impact of climate change and carbon transition policies. In particular, the ECB will accelerate the development of new models and will conduct theoretical and empirical analyses to monitor the implications of climate change and related policies for the economy, the financial system and the transmission of monetary policy through financial markets and the banking system to households and firms. Second, the Governing Council will adapt the design of its monetary policy operational framework in relation to disclosures, risk assessment, corporate sector asset purchases and the collateral framework. This reflects the principle that when adjusting its monetary policy instruments, the Governing Council will – provided that two configurations of the instrument set are equally conducive and not prejudicial to price stability – choose the configuration that best supports the general economic policies of the EU related to growth, employment and social inclusion, and that protects financial stability and helps to mitigate the impact of climate change, with a view to contributing to the objectives of the Union. The action plan will be implemented in line with progress on the EU policies and initiatives in the field of environmental sustainability disclosure and reporting.
Chart 3
ECB climate change action plan

Sources: ECB.
To support the economic analysis of climate change, there is a clear need to develop new statistical indicators. First, clarity is required in relation to terminology, classifications and the structure of statistical indicators. The EU has acknowledged the importance of harmonised definitions and standards and has undertaken a vast programme of standardisation in the area of sustainable finance, including – among others – legislative measures such as the EU Taxonomy, the EU Green Bond standard and the Corporate Sustainability Reporting Directive. There is also movement on the international front: the International Financial Reporting Standards (IFRS) Foundation launched a new standard-setting board — the International Sustainability Standards Board (ISSB) — aiming to deliver a global baseline standard for sustainability-related disclosures that provide investors and other capital market participants with information about sustainability-related risks and opportunities . All these developments will enable official statisticians to improve the availability and comparability of climate-related data.
Only harmonised definitions and standards make it possible to produce diverse statistical indicators and yet be assured that the data source confirms to a common framework. This has an obvious advantage in that it will allow the combination of variables from different sources. Notwithstanding the need for common classifications, data sources also need to be mutually coherent. Currently-available sources, both from private and public sources, do not yet live up to this requirement. This is a significant concern for policymakers.
Data quality is also a concern due to the risk of “greenwashing”, where data are self-reported in a biased way to make an entity look better than is actually the case. Quality will therefore require attention from those providing data and deriving indicators or statistics needed for analytical purposes or policymaking. Furthermore, granularity is essential to make sure the quality and coverage are appropriate and to build versatile indicators that are relevant for the various climate-related purposes and analysis. Overall, a rigorous compilation process will ensure that, in the long term, all agents using these data can trust the impartiality of any statistical data source and its methodological transparency. All of this will help the ECB statistical function, as part of its international role, to step up its efforts to address the requirements for climate-related statistics.
To support the analysis of the impact of climate change and transition policies on the economy and the transmission of monetary policy, an important task is also the integration of climate risks into the ECB’s workhorse models. This will make it possible to assess the impact of climate risks on potential growth and to conduct scenario analyses on transition policies. The calibration of such models relies on detailed data for various climate-related features, such as the primary energy inputs used in production by firms and consumption by households, or the carbon emission intensity from the use of different fossil fuels. It follows that it is important to collect granular disaggregated data which are currently not readily available across statistical providers worldwide.
A model-based assessment of the consequences of climate change also requires measuring how households and firms form their expectations around physical and transition risks. This is different to data collected elsewhere, as expectations about these developments shape the economy already today. A natural way to elicit such beliefs held by households and firms is by asking the appropriate questions through surveys, either by incorporating questions into existing survey platforms, or by designing alternative survey instruments, which can capture the wealth of information occurring at high frequency, such as following natural disasters, abrupt changes in energy prices as a result of regulation, or key policy communications.
The Governing Council has launched three ambitious streams of statistical work, with the expectation that by the end of 2022 we will be able to publish first experimental statistics covering relevant green financial instruments and the carbon footprint of financial institutions, as well as their exposures to climate-related physical risks. This is, of course, only the first step. More work is scheduled to be undertaken by the end of 2024, fine-tuning and deepening the activities, as well as analysing the possibility of arranging new statistical data collections. The work will also consider progress of the EU policies and initiatives in the field of environmental sustainability disclosure and reporting in the coming years.
Following the ECB’s action plan, work is underway to develop an advanced ESG data model in the Centralised Securities Database (CSDB), identifying all types of sustainable bonds.[10] By expanding this reference database, the new data model will allow the classification of bonds in the four main ESG categories: green, social, sustainable and sustainability-linked. It will provide information on sustainability level by flagging the bonds as “self-labelled”, ”verified by a second party” and “fully certified”. Furthermore, information on the standards to which each sustainable bond is aligned will be also available.
Following this step, work on the development and inclusion of the first ESG indicators in aggregated statistics will be initiated in the second quarter of 2022. Starting with the CSDB-based securities issues statistics and the Securities Holdings Statistics by Sector, aiming at the first sustainable finance indicators available to users by the end of 2022. [11],[12]
In 2023, work will start to expand the ESG data in the CSDB to cover more sustainable instruments (e.g. funds), to further enrich the ESG indicators in aggregated statistics and to possibly identify the holders of these securities by sector (the SHS Group dataset). In addition, the feasibility of uploading additional ESG related data in the reference database (e.g. on greenhouse gas emissions) will be assessed.
Work is also underway on measuring the carbon footprint of financial institutions via greenhouse gas (GHG) emissions of counterparties. The objective is to measure financial institutions portfolios’ environmental impact, which in turn provides a proxy for their exposure to certain transition risks. At a later stage, the assessment could be expanded towards carbon alignment with national and international targets. The first step is to focus on counterparties from the non-financial institutions sector.
With regard to physical risk indicators, the work covers three dimensions.
First, the physical hazards, such as floods, windstorms or heat waves. This is the hazard- layer that describes natural disasters or extreme weather events, including the frequency and intensity of a flood at a specific location.
Second, the exposure of population and assets to those natural hazards. In the case of financial institutions, these exposures are reflected in their investment portfolios (e.g. equity, bonds, loans) and the underlying collateral (e.g. the value of real estate).
Third, the vulnerability of the assets to the physical hazards, which makes it possible to quantify the final potential impact in case those hazards materialise. A vulnerability assessment aims to estimate expected damage as a function of hazards intensity and asset characteristics (usually a property). Currently, the vulnerability assessment is the most challenging aspect of the physical risk analysis, both from methodological and data availability perspectives.
In a final step, the climate and financial information must be combined over the same spatial dimension – which can be an address, a region or country. Here, still more efforts are required to improve coverage and reporting of address information in available granular databases which will facilitate the proper identification of physical risk.
In order to achieve these challenging goals, the ESCB has brought together statisticians from across the EU and beyond who are working together to gather appropriate source data, to set methodological standards and to compile suitable indicators.
While these three workflows are mandated by the Governing Council, we are not working on these topics in isolation. The ECB always closely cooperates with our statistical counterparts in the European Statistical System, as well as with the European Commission more generally. These supply some of the key data on the EU Emission Trading System (ETS) and on hazards such as flood risk. We also collaborate on the international stage. Examples of both international and European for a, where we are working together with other actors, include initiatives under the auspices of the G20, where the New Data Gaps Initiative includes, as part of its four main statistical and data priorities, work on climate data as well as, here in Europe, similar work by the Committee on Monetary, Financial and Balance of Payments Statistics on sustainable finance and climate related risks.
In summary, while significant technical work is still required to get the statistics that will underpin its analysis of climate change up and running, the ESCB is fully engaged in ensuring that users will see a significant increase in the availability of that data and related statistical indicators in the coming years.
Conclusion
Let me conclude. Fully accounting for housing – the most significant expenditure of households – in the overall price index, as well as providing the statistical infrastructure to integrate climate-related factors into macroeconomic and financial analysis, constitute major challenges for the official statistics community.
Of course, these challenges reinforce the importance of maintaining a long-term strategic vision that statistical systems should become more agile and flexible, fulling exploiting their currently under-used potential. Investment in basic statistical infrastructure hugely paid off during the pandemic, and official statisticians know better than anybody the value of reference datasets and granular data. Access to privately-held datasets in the context of the European Strategy for Data, using the full potential of the existing European legislative framework for the exchange of confidential micro data, bringing existing business registers closer and EU-level data collection on the top 500 MNEs active in the EU are not just “nice to have”, but will crucially shape our future policy options. Accordingly, these priorities must continue to feature highly on the agenda of official statistics and official statisticians.
I am grateful to Giuseppina Borea, Martin Eiglsperger, Gianluigi Ferrucci, Sarah Frost, Bernhard Goldhammer, Andrew Kanutin, Friderike Kuik, Eliza Magdalena Lis, Clara M. Marqués, Katri Mikkonen, Carolin Nerlich, Malgorzata Osiewicz, Laura Parisi, Raimundo Ramos, Romanos Priftis, Yiqiao Sun, Fabio Tamburrini, Dimitra Theleriti, Gabor Vincze and Christoph Zwick for their contributions to this speech.
See the ECB’s monetary policy strategy statement and the ECB’s Overview of the monetary policy strategy. For a discussion of the monetary-policy related aspects of the ECB’s monetary policy strategy, see Lane, P.R. (2022), “The monetary policy strategy of the ECB: the playbook for monetary policy decisions”, Speech at the Hertie School, Berlin, 2 March, and Lane, P.R. (2022), “The Monetary Policy Strategy of the European Central Bank”, special issue of Revue d’Économie Financière: New Doctrines in Central Banking, Vol.144.
In the euro area, the Harmonised Index of Consumer Prices (HICP) is used to measure consumer price inflation. That means the change over time in the prices of consumer goods and services purchased by euro area households. It is “harmonised” because all the countries in the European Union follow the same methodology. This ensures that the data for one country can be compared with the data for another. The HICP is compiled by Eurostat and the national statistical institutes in accordance with harmonised statistical methods. The inflation rate is also used in assessing whether a country is ready to join the euro area.
Where a reliable imputation of rents is not feasible, OOH user costs (mortgage interest payments, depreciation, running costs and capital gains/losses) are estimated in the national accounts (e.g. in Estonia, Latvia, Lithuania and Finland).
In 2016, Eurostat began publishing a set of stand-alone national OOHPIs, while euro area and EU totals of OOHPIs were published for the first time in October 2021.
For a comprehensive discussion of the measurement of owner-occupied housing costs see also ECB (2022) “Owner-occupied housing and inflation measurement” Economic Bulletin, Issue 1, ECB (2022) “Which sub-components are driving owner-occupied housing costs?” Economic Bulletin, Issue 2 and ECB (2021) “Inflation measurement and its assessment in the ECB’s monetary policy strategy review”, Occasional Paper Series, No 265, September.
Kohlscheen (2022) highlights the cross-country differences in the dynamic relation between house prices and rents, mimeo.
See Network for Greening the Financial System (2020) “The macroeconomic and financial stability impacts of climate change: research priorities”, Network for Greening the Financial System (2020), “Climate change and monetary policy: initial takeaways”, McKibbin, W., Konradt, M. and Weder di Mauro, B. (2021) “Climate Policies and Monetary Policies in the Euro Area”, Paper for ECB Sintra Forum 2021 and ECB (2021), “Climate change and monetary policy in the euro area”, Occasional Paper Series, No 271, September.
For more details see ECB presents action plan to include climate change in its monetary policy considerations, ECB press release, 8 July 2021.
The ESCB’s “Centralised Securities Database” (CSDB) is a security-by-security reference database that contains data on instruments, issuers and prices for debt securities, equity instruments and investment fund shares issued worldwide.
The ESCB securities issues statistics cover the issuance of securities other than shares (i.e. debt securities) and of listed shares by euro area residents.
The ESCB’s Securities Holdings Statistics (SHS), collected on a security-by-security basis, provide information on securities held by selected categories of euro area investors, broken down by instrument type, issuer country and further classifications.
Europese Centrale Bank
Directoraat-generaal Communicatie
- Sonnemannstrasse 20
- 60314 Frankfurt am Main, Duitsland
- +49 69 1344 7455
- media@ecb.europa.eu
Reproductie is alleen toegestaan met bronvermelding.
Contactpersonen voor de media