


Use of cash by companies in the euro area in 2026
1 Introduction
Cash is an important payment instrument for ensuring that consumers have the freedom to choose how they pay, and it is essential for the financial inclusion of all groups in society. The Eurosystem cash strategy aims to ensure that euro cash remains widely available, accessible and accepted both as a means of payment and as a store of value. In this context, the European Central Bank (ECB) conducted the survey on the use of cash by companies in the euro area in 2021, 2024 and 2026 to understand companies’ views on the use and acceptance of cash in payments, and how cash compares with other means of payment. More specifically, the objectives of the survey are to understand:
- companies’ acceptance of cash and other means of payment;
- companies’ attitudes towards cash and preferences for customer payments;
- perceived advantages of cash payments versus digital payment methods;
- availability of cash services such as self-checkout terminals that accept cash;
- companies’ behaviour in terms of cash withdrawals and deposits.
The sample of companies surveyed across all 21 euro area countries comprises companies employing one or more people in the following sectors: retail trade; restaurants and cafes; hotels; and arts, entertainment and recreation.[1] These sectors were chosen because they mostly have private customers. Within these sectors, only companies that sell their products to consumers or private persons were included in the survey sample.[2] Employment weights were used when producing the results, meaning that companies with more employees have a greater impact on the results.[3] More information on the survey methodology is available in Annex 1.
The 2024 and 2026 survey waves included a question on whether companies sell their products and services exclusively at physical locations, exclusively online or both. For the euro area as a whole, the share of companies offering online sales in addition to sales at physical locations was 39% in 2024 and 42% in 2026, and the share of companies selling products and services exclusively online was 6% in 2024 and 4% in 2026.
In the 2026 survey wave, questions on acceptance of payment instruments were asked separately for physical points of sale and online payments, while in the 2021 and 2024 waves there was one general question on acceptance of payment instruments. This should, however, have only a minor impact on the comparability of the results.[4]
Because of changes in the questionnaire design, this report compares the latest results for the indicators on acceptance of payment instruments with 2024 data only. For these two survey waves we can classify companies based on their sales location – physical point of sale or online – in an identical way. This report systematically considers only companies that accept customer payments at physical locations for indicators on acceptance at physical locations, and only companies that sell goods and products online for indicators on acceptance of online payments. Consequently, the indicators presented in this report may differ from the ones presented in previous reports.
Several other changes were also introduced in the questionnaire for the 2026 survey wave. Consequently, this report shows time series data only where the indicators are comparable across survey waves.
Throughout this report, the analysis at euro area level includes data on all companies, but for analysis at country level or for individual economic sectors, only data on small and medium-sized enterprises (SMEs) are included.[5] While the sample size for large companies is considered sufficient for reliable analysis at the euro area level, that is not always the case at country or sector level. For 17 of the countries in the survey, the number of large companies in the sample is only seven or less.
All data for the charts presented in this report are available on the survey website. In addition to the results presented in this report, tables and charts on selected indicators on access to cash, coin management and satisfaction with cash services have been published. We also provide a file with more detailed country-level results, including breakdowns of selected indicators by country and sector and by country and company size.
2 Executive summary
The key findings of the survey on the use of cash by companies in the euro area can be summarised as follows:
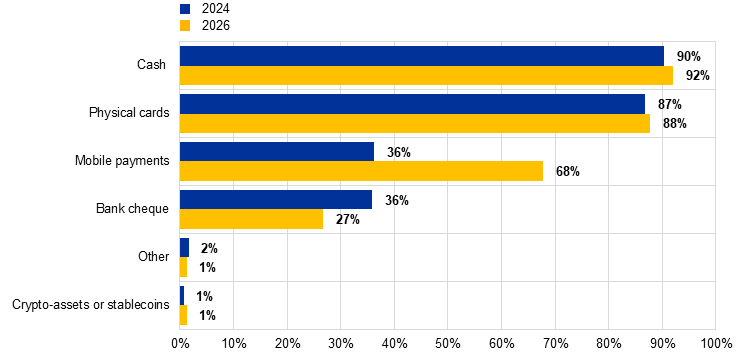
In 2026, 92% of companies that sell their goods and services in physical locations reported that they accept cash. The corresponding share in 2024 was 90%. This suggests that the decline in cash acceptance observed during and following the COVID-19 pandemic has paused. Physical card payments are accepted by 88% of companies, compared with 87% in 2024. In recent years there has been a significant increase in the share of companies that report accepting mobile payments. The share of such companies increased from 36% in 2024 to 68% in 2026.
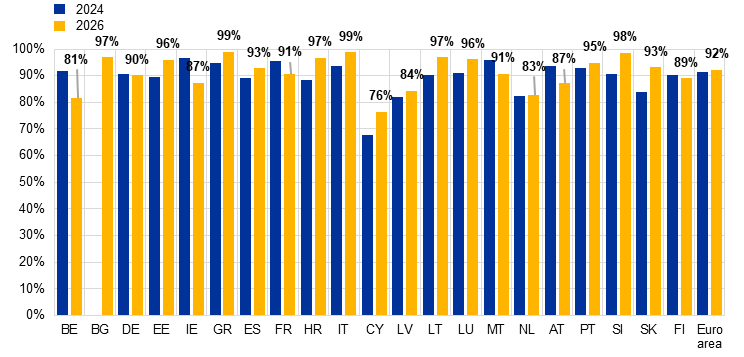
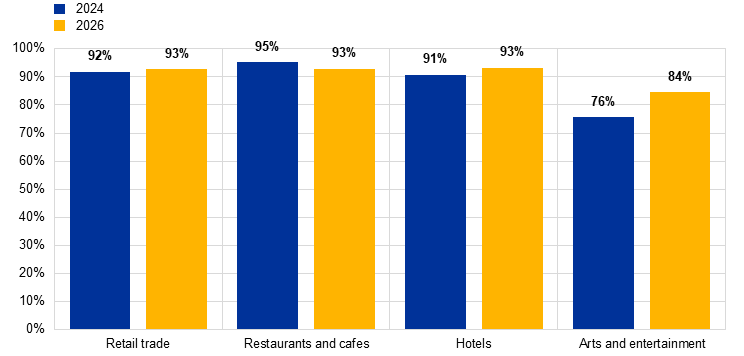
Cash is most frequently accepted by the retail trade, restaurants and hotels (93% across all of these sectors). Companies in the arts, entertainment and recreation sector accept cash less frequently (84%), but still relatively often. Among euro area countries, the cash acceptance rate is highest in Greece and Italy (both 99%) and lowest in Belgium (81%) and Cyprus (76%).
Of all companies that accept cash, 92% reported that they plan to keep doing so in the next five years. Among the companies that do not accept cash, the most frequent reasons given for this were that cash is not used enough by customers (36%, compared with 39% in 2024) and that depositing or withdrawing cash is inconvenient or difficult (35%, compared with 22% in 2024).
Among the payment methods used by customers at physical points of sale, one in three companies in the euro area have no preference, 24% of companies have a preference for debit card payments, 21% for cash payments and 14% for credit card payments.
When comparing cash and digital payments, there is no category covered by the survey for which companies perceive digital payments to be strictly better than cash. Companies consider cash significantly better than digital payments in terms of privacy and reliability. A high share of companies also perceive cash to be better than digital payments in terms of overall costs, transaction speed, ease of handling and security.
When companies choose which means of payment to accept, the most important criteria are consumer preference (26%), security (22%) and ease of handling (15%). Risk of mistakes when giving change (32%) and safety (29%) are the most frequently mentioned concerns with cash payments.
25% of companies in the euro area report having implemented measures to encourage the use of digital payments, such as acquiring tills that accept cashless payments or reducing the number of tills that accept cash, along with activities to promote and advertise cashless payments.
In the euro area, 13% of companies have introduced self-checkout terminals. In 52% of these companies, at least some of these terminals accept cash. In the euro area, 38% of companies have introduced cash registers at the point of payment and 37% have smart safes.
Bank counters remain the primary method used by companies for withdrawing cash. They are used by 60% of companies that withdraw cash. They have also become the primary method for depositing cash (used by 58% of companies that deposit cash), thus surpassing depositing via cash-in machines (55%), which was the most common method in 2021 and 2024.
3 Accepted means of payments
This section analyses companies’ acceptance of various means of payment, both at physical locations and online, reasons they may have for not accepting cash, and expectations of future cash acceptance.
3.1 Accepted means of payment at point of sale
The acceptance rates of different payment instruments at points of sale are based on companies’ responses to the question “Which means of payment does your company accept from private customers at physical locations?”. The charts only include companies that receive customer payments at physical locations.
In 2026, of all companies that receive customer payments at physical locations, 92% accept cash, 88% accept physical cards and 68% accept mobile payments (Chart 1, panel a). There has been a significant increase in the share of companies that accept mobile payments since 2024, when only 36% of companies reported accepting this payment method.
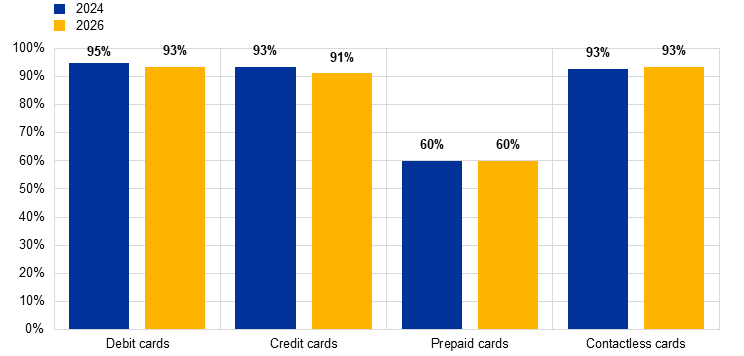
Credit cards and debit cards are each accepted by more than nine out of ten of all companies that accept physical cards (Chart 1, panel b). While there has been a minor increase in the overall acceptance of card payments since 2024, the share of companies accepting debit cards and credit cards has declined slightly, indicating that fewer companies accept both types of card. The most frequently accepted mobile means of payment are instant payments and digital wallets (Chart 1, panel c).
Chart 1
Accepted means of payment at physical points of sale, euro area
a) Acceptance of various payment instruments, 2024-26
b) Acceptance by type of card, 2024-26
c) Acceptance by type of mobile payment, 2026
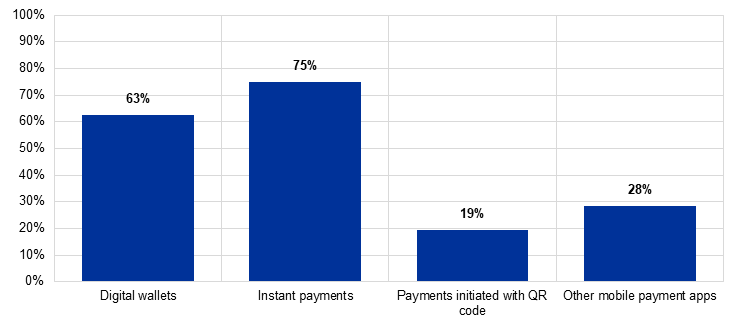
Notes: The chart only includes companies that accept customer payments at physical locations. In 2024 the question on accepted means of payment made no distinction between physical points of sale and online sales. In 2026 the question “Which means of payment does your company accept from private customers at physical locations?” was only asked of companies that have a physical location. Panel b) only includes companies that accept cards at physical locations. Panel c) only includes companies that accept mobile payments at physical locations.
Chart 2 shows the share of SMEs that accept cash in each euro area country.[6] Differences in cash acceptance rates vary across countries and across sectors. Of all euro area countries, Greece and Italy have the highest cash acceptance rate (99%), while in Belgium only 81% and in Cyprus only 76% of SMEs accept cash. Among all SMEs in the retail trade, restaurants and hotels, 93% accept cash. Cash acceptance has increased most in Cyprus and Slovakia (both up 9 percentage points), while the biggest declines were observed in Belgium (down 10 percentage points) and Ireland (down 9 percentage points).
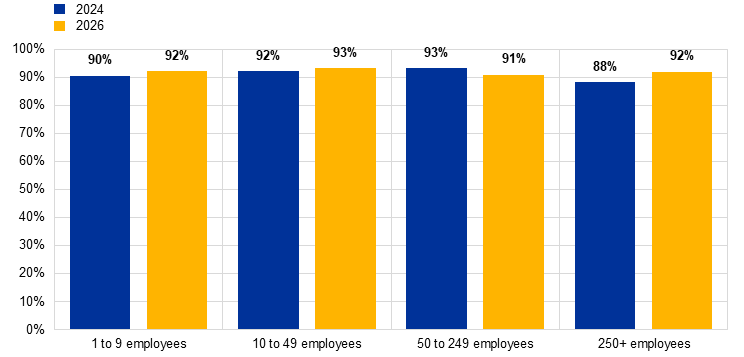
The cash acceptance rate is lower (84%) in the arts, entertainment and recreation sector, although it has increased since 2024. Cash acceptance rates are similar across companies of all size classes.
Chart 2
Cash acceptance, 2024-26
a) Share of SMEs accepting cash by country
b) Share of SMEs accepting cash by sector
c) Share of companies accepting cash by size class
Notes: The chart only includes companies that accept customer payments at physical locations. Panels a) and b) only include SMEs. Bulgaria joined the euro area in January 2026, so no data were collected for Bulgaria in the 2024 survey.
3.2 Cash acceptance in different economic sectors
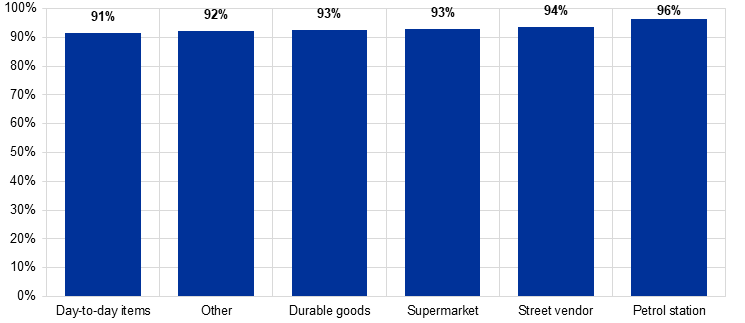
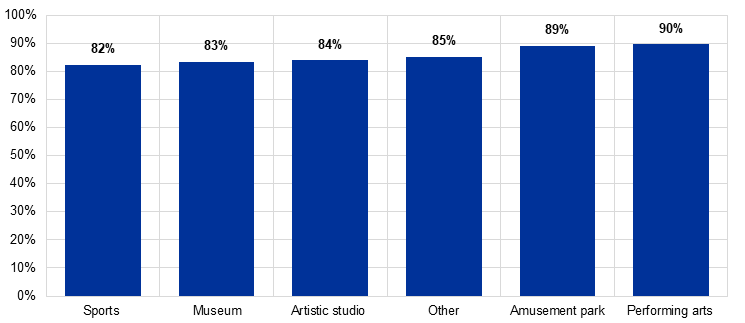
Across all location types in the retail trade, more than nine out of ten SMEs accept cash, with rates varying from 91% (for shops other than supermarkets selling day-to-day items) to 96% (for petrol stations) (Chart 3). In the arts, entertainment and recreation sector, cash is accepted most frequently (90%) by SMEs that have performing arts as their main business, such as theatres and concert venues, and least frequently at sports venues (82%).
Chart 3
Share of companies accepting cash by type of main business in the retail trade and arts, entertainment and recreation sectors, euro area, 2026
a) Share of SMEs accepting cash by type of retail location
b) Share of SMEs accepting cash by type of establishment in the arts, entertainment and recreation sector
Note: Both panels only include SMEs that accept customer payments at physical locations.
There are seven countries in which the cash acceptance rate in restaurants is 100% in 2026, meaning that all restaurants in the sample report accepting cash (Chart 4). At the other end of the scale, in the Netherlands, only 78% of restaurants accept cash. In the retail trade, the cross-country variation among SMEs is smaller. In Greece and Slovenia, cash acceptance rates are 100%, while in Belgium, Latvia, the Netherlands and Finland less than 90% of retailers accept cash (Chart 5).
Chart 4
Share of SMEs that accept cash in the restaurants and cafes sector by country, 2024-26
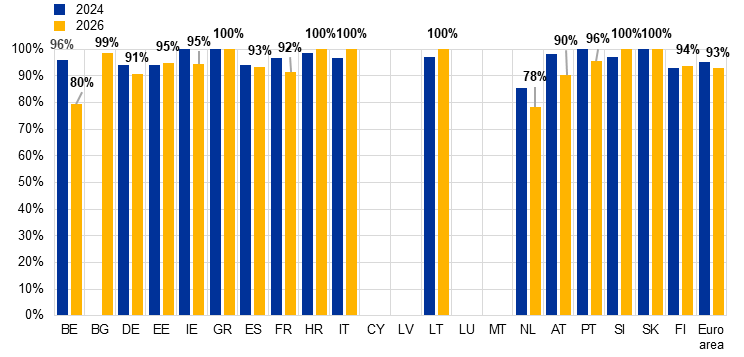
Notes: The chart includes SMEs in the restaurants and cafes sector that accept customer payments at physical locations where the sample size is at least 20 companies in both years. Bulgaria joined the euro area in January 2026, so no data were collected for Bulgaria in the 2024 survey.
Chart 5
Share of SMEs that accept cash in the retail trade by country, 2024-26

Notes: The chart includes SMEs in the retail trade that accept customer payments at physical locations. Bulgaria joined the euro area in January 2026, so no data were collected for Bulgaria in the 2024 survey.
3.3 Reasons why companies are not accepting cash
Companies that reported not accepting cash at physical locations were asked a follow-up question: “What are the main reasons your company decided not to accept cash?” (Chart 6). Companies could select up to three reasons from a list. The most frequently mentioned reasons for non-acceptance of cash are that cash is not used enough by customers (36%), depositing or withdrawing cash is inconvenient or difficult (35%) and cash poses a security risk (29%). The share of companies who do not accept cash because depositing or withdrawing cash is inconvenient or because of security reasons has increased since 2024.
Chart 6
Reasons why companies don’t accept cash, euro area, 2024-26
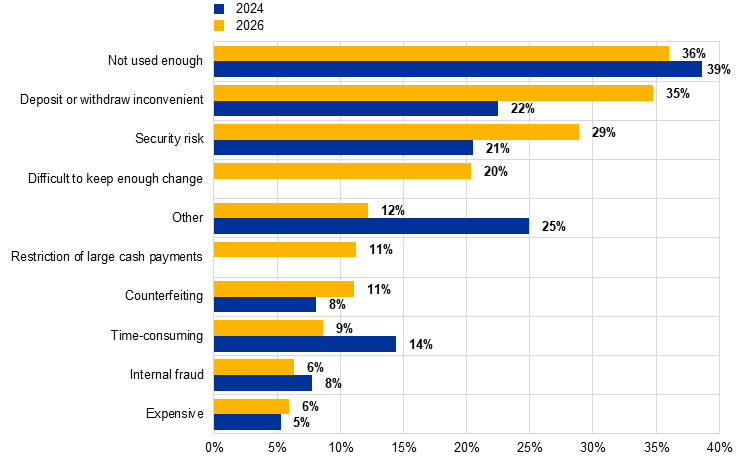
Notes: The chart includes companies that accept customer payments at physical locations but do not accept cash. The options “Restriction of large cash payments” and “Difficult to keep enough change” were added in 2026.
3.4 Future cash acceptance
Companies that accept cash at physical locations were asked a follow-up question: “Do you think you will continue accepting cash in the next 5 years?” (Chart 7). Over nine in ten (92%) companies who currently accept cash say that they think they will continue to do so, while 6% say that they will not and 2% were unsure whether they will accept cash in the next 5 years. In most countries, the vast majority of SMEs indicate that they will continue to accept cash in the future. However, in Cyprus (51%), Greece (23%) and Bulgaria (18%) a significant share of SMEs say that they may not accept cash in the future.[7]
Chart 7
Future cash acceptance by country, 2026

Notes: The chart shows responses to the question “Do you think you will continue accepting cash in the next 5 years?”. Only SMEs that accept customer payments in physical locations and accept cash are included.
3.5 Accepted means of payment for online purchases
The acceptance rates for different payment instruments for online sales are based on responses to the question “Which means of payment does your company accept from private customers for online or remote payments?”. Of all companies selling goods online in 2026, 82% accept payment cards and 74% accept credit transfers (Chart 8). Only a very small share of companies (0.2%) accept crypto-assets.
Chart 8
Acceptance of payment instruments in online sales, euro area, 2026
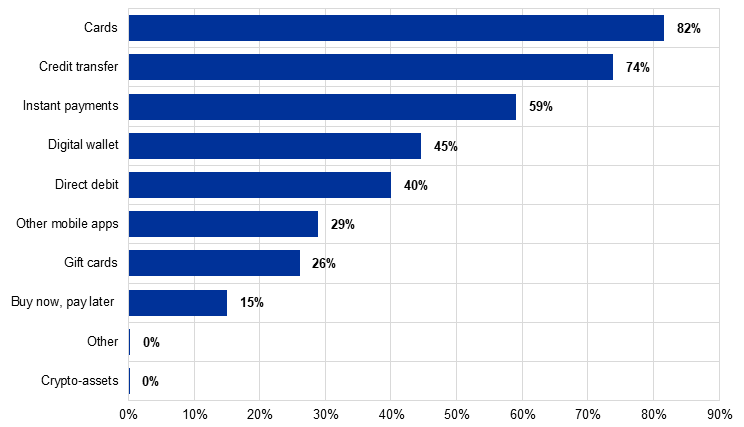
Notes: The chart only includes companies selling goods and services online. In 2024 the question on accepted means of payment made no distinction between physical points of sale and online sales. In 2026 the question “Which means of payment does your company accept from private customers for online or remote payments?” was only asked of companies selling goods and services online.
3.6 Criteria for accepting a means of payment
Chart 9 shows the results for the question “What is the most important criteria for your company when choosing to accept a means of payment?”, which was asked of all companies that participated in the survey, independent of their acceptance policy. The respondents were asked to choose only one most important criterion. The most frequently mentioned criteria are consumer preference (26%), security (22%) and ease of handling (15%).
Chart 9
Most important criteria when choosing to accept a means of payment, euro area, 2026

4 Preferences and attitudes
4.1 Preferences for customer payments in physical locations
Companies that accept customer payments at physical locations were asked the following question: “Which means of payment would you prefer your customers to use when paying you in physical locations?” (Chart 10). In previous survey waves, the question on payment preferences was asked of all enterprises, and the payment location was not specified in the question. Therefore, the results for 2026 are not comparable with the results on preferences from 2021 and 2024.
Among the methods preferred by companies for customer payments at physical points of sale, one in three companies in the euro area have no preference, 24% have a preference for debit card payments, 21% for cash payments and 14% for credit card payments.
Big companies (250+ employees) have a lower preference for receiving payments in cash than SMEs.
Chart 10
Preferred payment instruments at physical points of sale, 2026
a) Preferred payment instrument by country, SMEs

b) Preferred payment instrument by sector, SMEs

c) Preferred payment instrument by company size
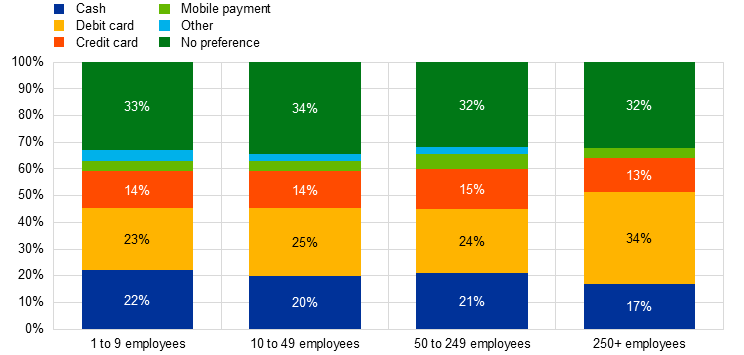
Notes: The chart only includes enterprises that accept customer payments in physical locations. Panels a) and b) only refer to SMEs (up to 249 employees).
4.2 Cash attitudes
Chart 11 shows the results for the question “How does cash compare with digital payments (with cards or mobile devices) in terms of …?”, in which companies were asked to compare cash and digital payments with regard to six predefined characteristics (overall costs, transaction speed, ease of handling, reliability, security, privacy). The question was asked of all enterprises that accept both cash and either cards or mobile payments. In 2021 and 2024 this section included separate questions for cash versus cards and cash versus mobile payments. Consequently, the results in this report are not fully comparable with the results for corresponding questions in earlier waves.
In net terms (comparing the share of companies that consider cash better than digital payments with the share of companies that consider cash worse than digital payments), companies perceive cash to be better than digital payments, especially in terms of privacy and reliability. There is no category in which companies perceive digital payments to be clearly better than cash.
Chart 11
How cash compares with digital payments, euro area, 2026

Notes: The chart includes only companies accepting both cash and either cards or mobile payments at physical locations. The results cannot be fully compared to the 2021 and 2024 surveys, given the structural changes in the questions asked.
Chart 12 shows the results for the question “What are the biggest concerns for your company when dealing with cash payments?”. This question was asked of all enterprises that accept cash. Each respondent could choose up to three concerns.
The biggest concerns regarding cash payments are the risk of mistakes when giving change (mentioned by 32% of companies), safety (29%) and risks of internal fraud (20%). Companies are less concerned about the costs of withdrawing and depositing cash or the availability of such services.
Chart 12
Biggest concerns relating to cash payments, euro area, 2026

Note: The chart only includes enterprises that accept customer payments in physical locations and accept cash.
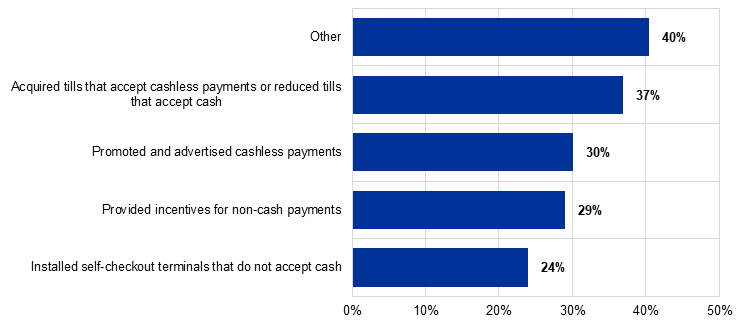
Chart 13, panel a), shows the results for the question “In the past year, has your company implemented any measures to encourage the use of digital payment methods or to reduce cash payments?”. This question was asked of all companies that have physical payment locations. Chart 13, panel b), shows the results for the follow-up question on the kinds of measures implemented, which was asked of all companies that answered “yes” to the previous question.
One quarter of companies in the euro area report having implemented measures to encourage the use of digital payments or to reduce cash payments. The most frequently mentioned types of measure relate to acquiring tills that accept cashless payments or reducing the number of tills that accept cash (mentioned by 37% of companies that have implemented any measures), along with activities to promote and advertise cashless payments (30%).
Chart 13
Measures to encourage digital payments, euro area, 2026
a) Company has implemented measures to encourage digital payments

b) Kind of measure implemented
Notes: The chart only includes enterprises that accept customer payments in physical locations and accept cash. Panel b) only refers to companies that have implemented measures to encourage digital payments.
5 Cash services and automation of cash operations
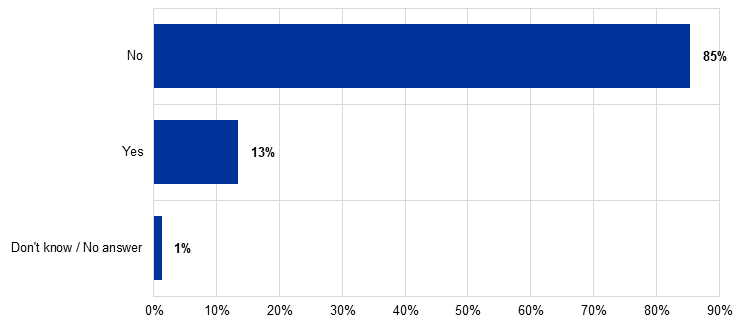
The following charts indicate the share of companies that offer certain types of automated cash services. Chart 14 shows the responses to the question “Does your company have self-checkout terminals?” and the follow-up question for companies replying “yes” on whether cash is accepted at these terminals. Both questions are only asked of companies that accept cash.
In the euro area, 13% of companies have self-checkout terminals (Chart 14, panel a), and in 52% of these companies at least some of the self-checkout terminals accept cash (Chart 14, panel b).
Chart 14
Self-checkout terminals, euro area, 2026
a) Company has introduced self-checkout terminals
b) Cash is accepted at self-checkout terminals

Notes: The chart only includes enterprises that accept customer payments in physical locations and accept cash. Panel b) only refers to companies that have introduced self-checkout terminals.
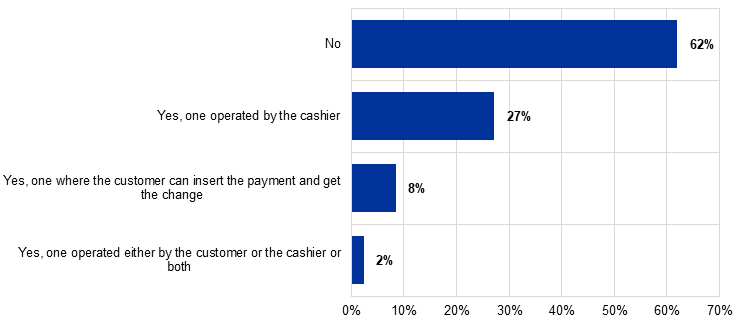
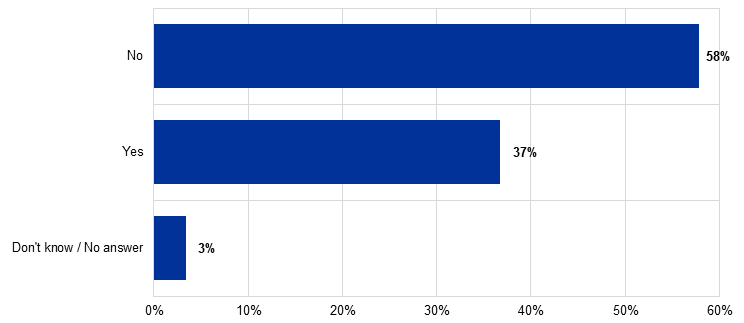
The following questions were asked to gauge the automation of cash operations in companies: “Do you have a cash register used at the payment point for automated handling of cash payments?” and “Do you have a secure cash storage device (‘smart safe’) usually located in the back office that automatically counts, validates and monitors your cash deposits?” (Chart 15). The questions were only asked of companies that accept cash.
In the euro area, 38% of companies have introduced cash registers operated by the customer, by the cashier or by both at the payment point, and 37% have smart safes.
Chart 15
Automation of cash operations, euro area, 2026
a) Share of companies that have cash registers at the payment point
b) Share of companies that have smart safes
Note: The chart only includes enterprises that accept customer payments in physical locations and accept cash.
6 Cash withdrawal and deposit behaviour
This section examines the cash withdrawal and deposit behaviour of companies. Companies were asked “Does your company do any of the following…?” and given the following options: “Withdraw cash”; “Deposit cash”; “Use services provided by a cash-in-transit (CIT) company”.[8] The question was asked of all companies that have a physical payment location for their goods and services.
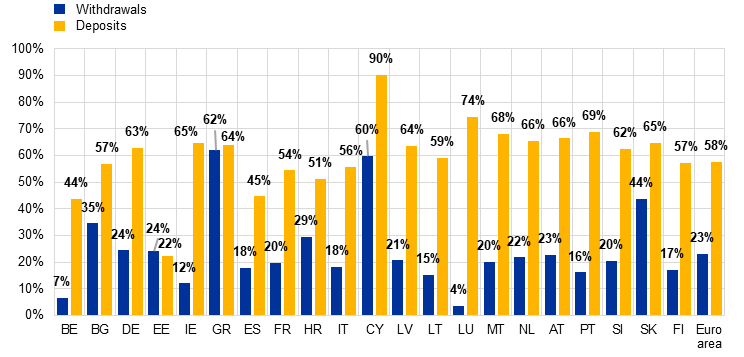
While a quite high share of companies (59%) deposit cash, far fewer make cash withdrawals (22%). Both shares have decreased compared to 2024 (Chart 16, panel a). Deposit and withdrawal behaviours vary considerably across countries (Chart 16, panel b).
Chart 16
Share of companies that withdraw or deposit cash
a) Withdrawals and deposits, euro area, 2021-26

b) Withdrawals and deposits by SMEs by country, 2026
Note: The chart only includes enterprises that accept customer payments in physical locations.
6.1 Cash withdrawals
For all companies that withdraw cash, the survey included the question “How does your company withdraw cash?”. Respondents were asked to report all withdrawal methods that they used.
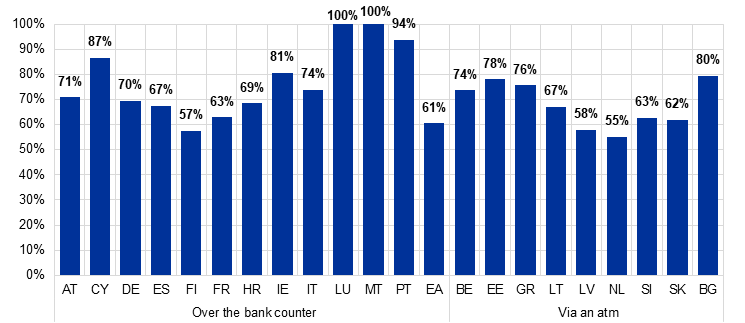
The method used by most companies for withdrawing cash is over the bank counter, used by 60% of respondents who withdraw cash (Chart 17, panel a). The use of this method increased compared with 2024 (up 9 percentage points). ATMs are used by 48% of companies for withdrawals, while 7% opt for a CIT company (compared with 21% in 2024). The most popular withdrawal method among SMEs in individual euro area countries is over the bank counter or via an ATM (Chart 17, panel b).
Chart 17
How companies withdraw cash
a) Euro area, 2021-26

b) The cash withdrawal method used by most SMEs by country and method, 2026
Note: The chart only refers to companies that withdraw cash.
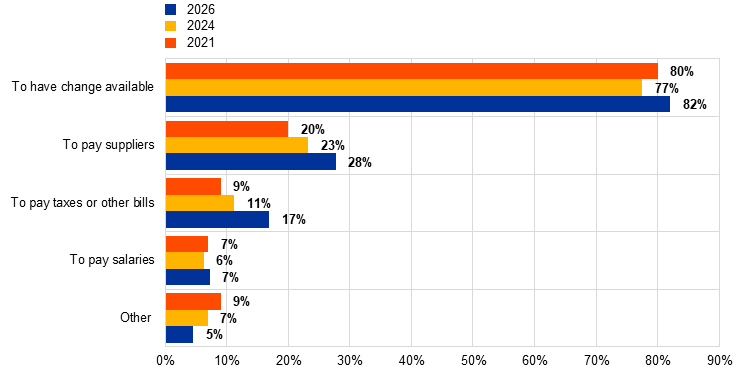
Concerning the reasons for withdrawing cash, companies do so mostly in order to have change (coins and low-denomination banknotes) available for customers (82%). Almost 30% said that they withdraw cash to pay suppliers (Chart 18). Compared with previous survey waves, the main reasons for withdrawing cash have remained pretty stable, with a small increase in the percentage of companies doing so to pay taxes or other bills.
Chart 18
Why companies withdraw cash
Euro area, 2021-26
Note: The chart only refers to companies that withdraw cash.
6.2 Cash deposits
For all companies that deposit cash, the survey included the question “How does your company deposit cash?”. The respondents were asked to report all deposit methods that they used.
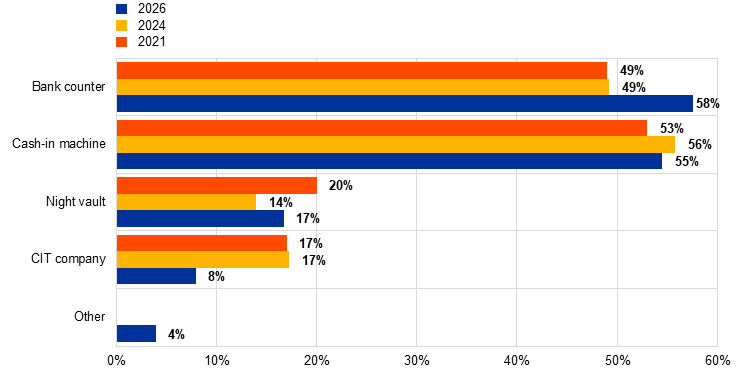
The method used by most companies for depositing cash is the bank counter, which is used by 58% of respondents who deposit cash (Chart 19, panel a). 55% of companies deposit cash via cash-in machines, while 17% use a bank night vault.[9] Compared with the two previous surveys, the method used by most companies for depositing cash switched from cash-in machines to bank counters, while the use of CIT companies decreased (down 9 percentage points). Chart 19, panel b), shows the withdrawal methods used by most SMEs in each country.
Chart 19
How companies deposit cash
a) Euro area, 2021-26
b) Method used by most SMEs to deposit cash, by country, 2026
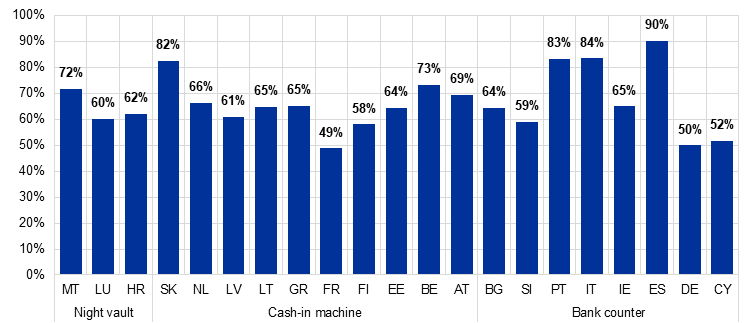
Notes: The chart only refers to companies that deposit cash. Panel b) shows the most popular method for depositing cash among SMEs in each country in 2026.
7 Conclusions
The acceptance of diverse payment instruments among euro area companies has broadened in recent years, highlighting an increased choice for consumers to use a large variety of payment methods for their purchases. The acceptance rates for cash (92%) and cards (88%) at physical points of sale have both improved slightly since 2024. At the same time, there has been a notable increase in the acceptance rate for mobile payments, from 36% in 2024 to 68% in 2026. The widespread adoption of mobile payments points to a significant increase in awareness of digital payment instruments among all types of companies across the euro area and reflects the importance of consumer preference in the choices companies make about the payment instruments they will accept.
Most companies in the euro area that already accept cash plan to keep doing so over the next five years (92%). However, there are some countries and some sectors in individual euro area countries where cash acceptance is relatively low, or where a significant share of companies do not intend to accept cash in the future. Furthermore, one quarter of the companies reported having implemented measures to encourage digital payments. The responsible authorities need to be proactive in their policies and actions to ensure that euro banknotes and coins remain an attractive and accepted means of payment in the coming years, across all countries and sectors.
When deciding to accept a means of payment, consumer preference (26%) and security (22%) are indicated by companies as the most important criteria. Regarding cash payments, the risk of mistakes when giving change and safety are mentioned as the biggest concerns. Companies have also started to automate customer payments, with 13% of companies having already introduced self-checkout terminals. However, almost half (48%) of these companies do not accept cash at any of these terminals. In other words, even though most companies accept cash and say that they do so, among consumers the perceived acceptance of cash may go down because companies have reduced the ease of paying with cash. To ensure widespread cash acceptance, it is crucial to ensure that the increasing automation of payments does not inadvertently hinder or undermine cash as a viable payment option.
Annex 1: Use of cash by companies – survey methodology
Scope
The Study on the use of cash by households (SUCH) in 2017 and the ECB’s regular Study on the payment attitudes of consumers in the euro area (SPACE) analyse the payment behaviour and habits of consumers to assess how they use cash and non-cash means of payment.[10],[11]
As cash is still the only form of public money, there is also a need to analyse the other side of the payment process, i.e. from the merchant’s (payee’s) perspective. The aim of the survey on the use of cash by companies in the euro area is to provide an overview of companies’ views on the current and future use and acceptance of cash. The survey was previously performed in 2021 and 2024 using a similar methodological framework.
All 21 euro area countries (Belgium, Bulgaria, Germany, Estonia, Ireland, Greece, Spain, France, Croatia, Italy, Cyprus, Latvia, Lithuania, Luxembourg, Malta, the Netherlands, Austria, Portugal, Slovenia, Slovakia and Finland) are covered in the 2026 survey. Bulgaria was included for the first time in the 2026 survey and Croatia for the first time in the 2024 survey.
Sample design and data collection
In this survey, the statistical unit is the enterprise or a branch of an enterprise, which is defined as a company or professional undertaking with at least one employee. The respondent is a person with capacity to take decisions related to the accepted means of payments, such as the owner, the chief financial officer or the head of accountancy. Respondents reply only on behalf of that part of the enterprise for which they take decisions, meaning, for example, that a branch manager of a large supermarket chain would reply only on behalf of the branch, not on behalf of the entire chain.
The survey was conducted by telephone interview, with the average length of the interview being around 20 minutes.
The sample is a quota sample, stratified in each country by sector (as classified by Eurostat in NACE Rev. 2) and by size of enterprise. The survey was conducted among enterprises in the following sectors: retail trade; accommodation and food service activities; and arts, entertainment and recreation.
The data were collected in a single survey wave between 23 February and 10 April 2026 by Ipsos European Public Affairs using a sample selected from an international business database provided by Sample Solutions. Fieldwork was carefully monitored by the ECB in cooperation with the survey company at all stages.
This report focuses on the sectors most likely to receive payments from private consumers in cash. Therefore, enterprises in the retail trade sector (NACE G45+G47) account for 63% of the sample. The retail sector sample is divided into the following size classes: micro (1-9 employees), small (10-49), medium (50-249) and large (250+). Minimum quotas for micro and small enterprises were also applied.
Enterprises in accommodation and food service activities (NACE I) account for 25% of the sample, while enterprises in arts, entertainment and recreation (NACE R) account for 12%. Enterprises in all the above-mentioned size classes were covered, but coverage of large enterprises was only required in countries in which the total sample size was 400 or more.
By the end of fieldwork, a total of 8,205 interviews had been conducted. Table A1 shows the distribution of the sample by country, Table A2 by company size, Table A3 by sector and Table A4 by organisational status.
Table A1
Total sample achieved by country
Country | Sample achieved |
|---|---|
Belgium | 409 |
Bulgaria | 408 |
Germany | 904 |
Estonia | 200 |
Ireland | 201 |
Greece | 413 |
Spain | 919 |
France | 904 |
Croatia | 203 |
Italy | 912 |
Cyprus | 101 |
Latvia | 204 |
Lithuania | 200 |
Luxembourg | 100 |
Malta | 100 |
Netherlands | 405 |
Austria | 412 |
Portugal | 402 |
Slovenia | 202 |
Slovakia | 203 |
Finland | 405 |
TOTAL | 8,205 |
Source: ECB survey on the use of cash by companies in the euro area 2026.
Table A2
Total sample achieved by company size
Company size | Sample achieved |
|---|---|
1 to 9 employees | 5,146 |
10 to 49 employees | 2,387 |
50 to 249 employees | 549 |
250+ employees | 123 |
TOTAL | 8,205 |
Source: ECB survey on the use of cash by companies in the euro area 2026.
Table A3
Total sample achieved by sector
Sector | Sample achieved |
|---|---|
Retail trade | 5,176 |
Restaurants and cafes | 1,036 |
Arts and entertainment | 1,008 |
Hotels | 985 |
TOTAL | 8,205 |
Source: ECB survey on the use of cash by companies in the euro area 2026.
Table A4
Total sample achieved by organisational status of the company
Organisational status | Sample achieved |
|---|---|
Independent | 6,540 |
Franchise | 579 |
Branch of a national group | 451 |
Branch of an international group | 303 |
Headquarters of a national group | 150 |
Headquarters of an international group | 106 |
No answer | 96 |
TOTAL | 8,205 |
Source: ECB survey on the use of cash by companies in the euro area 2026.
Weighting and validation of the data
The data have been subjected to quality checks, validation and weighting.
The quality checks included checks on speeding (removing respondents whose interview length was less than one third of the country median) and item non-response (removing respondents where more than 30% of answers were “don’t know” or “refusal”).
The data were weighted to ensure that the net sample was representative of the population in order to minimise the bias of the survey estimate and enable solid inferences.
The data and the results in the report are weighted using an employee weight, which weights the data in each size class, economic sector and country according to population estimates based on the number of employees. The “employee weight” ensures that the sample is weighted in proportion to the total number of employees in each weighting cell.
The weighting was based on two weighting targets.
The first target was a country-by-country distribution of sector by size class: weighting targets were set for five cells per country: (1) retail trade, 1-9 employees; (2) retail trade, 10-49 employees; (3) retail trade, 50 employees or more; (4) accommodation and food service activities; and (5) arts, entertainment and recreation. If the number of interviews completed in weighting cell 3 (retail trade, 50+ employees) was less than 10, weighting cells 2 and 3 were merged. The number of persons employed was set as the weighting target.
The second target was the cross-country (total) distribution of the employed population across four specific size quota: micro (1-9 employees); small (10-49 employees); medium (50-249 employees); large (250+ employees).
Annex 2: Survey Questionnaire
Survey Screener
D1. In which sector does your company carry out its main activities?
4 Retail trade
5 Hotels
6 Restaurants and cafes
7 Arts, entertainment and recreation
12 Other
9999998 Don’t know \ No answer
9999999 Refusal
If D1 > 7, END SURVEY
D11. Who does your company sell its products and services to?
MULTIPLE ANSWES POSSIBLE
1 Consumers/private persons (B2C)
2 Other businesses (B2B)
3 Public institutions
4 Other
IF D11_1 = 0 END SURVEY
D1b. As part of the retail trade, what is your company main business?
6 Superstore / Large retailer
1 Food and drinks retail (e.g. supermarket)
2 Shops for day-to-day items (e.g. convenience store, bakery, drugstore, pharmacy)
3 Street vendor or at a market (e.g. newspaper stand, florist, lottery)
4 Shop selling durable goods (e.g. clothing, electronics, household appliances, furniture, speciality shops, vehicles and accessories, toys)
5 Petrol station
8 Other
9999998 Don’t know \ no answer
9999999 Refusal
FILTER: if D1= 4
D1c. As part of the arts, entertainment and recreation sector, what is your company main business?
1 Performing arts (e.g. theatre, concerts)
2 Artistic or creative studio (e.g. photography, design)
3 Museum or gallery (including zoos and botanical gardens)
4 Sports (e.g. swimming hall, gym, sports center)
5 Amusement or theme park
6 Gambling or betting activities
7 Other
9999998 Don’t know \ no answer
9999999 Refusal
Filter: if D1=7
D2. What exactly is your position in the company?
1 CEO/Managing director/President
6 CFO/Controller
2 Financial director/manager
3 Senior accountant
4 Owner
5 Other
9999998 Don’t know \ No answer
9999999 Refusal
D3. Is your company...?
1 Independent
2 A franchise undertaking
3 A branch of a national group
4 A branch of an international group
5 The headquarters of a national group
6 The headquarters of an international group
9999998 Don’t know / no answer
9999999 Refusal
D20. Approximately, how old is your company?
1 less than 2 years
2 Between 2 and 5 years
3 Between 5 and 10 years
4 More than10 years
9999998 Don’t know / no answer
9999999 Refusal
D4. How many employees (full-time equivalent), including yourself, does your company, as a whole, currently have?
Numerical value between 1 and 9999997
D4c: Number of employees - categorical:
If respondent does not know exactly, insist on getting an estimate and use the brackets below
1 1 to 9 employees
2 10 to 49 employees
3 50 to 249 employees
4 250 to 999 employees
5 1000 employees or more
9999998 Don’t know / no answer
9999999 Refusal
D7. Where does your company sell your products/services?
1 At physical locations
2 Online
3 Both online and at physical locations
9999998 Don’t know / no answer
9999999 Refusal
D7b Can your customers make payments at a physical location (e.g. when picking up or receiving goods or using services that they ordered online)?
0 No
1 Yes
9999998 Don’t know / no answer
Filter: IF D7 = 2
Q16. What would you say is your company’s approximate annual turnover?
Numerical value between 1 and 99999997
D16c: Turnover - categorical:
If respondent does not know exactly, insist on getting an estimate and use the brackets below
1 Less than €10 000
2 €10 000 to €99 999
3 €100 000 to €999 999
4 €1 million to €4 999 999
5 €5 millions or more
9999998 Don’t know / no answer
9999999 Refusal
Q17. Thinking of your annual turnover, approximately what proportion of your income from customers is in cash?
Numerical value between 0% and 100%
D17b: Share of cash in turnover - categorical:
If respondent cannot give a number, insist on getting an estimate and use the brackets below
1 None
2 1-10%
3 11-25%
4 26- 50%
5 51-75%
6 76-99%
7 100%
9999998 Don’t know / no answer
9999999 Refusal
Q18. What is the average amount of cash that you normally hold (e.g. in the till, in a vault or safe)?
Numerical value between 1 and 99999997
D18b: Cash holdings - categorical:
If respondent cannot give a number, insist on getting an estimate and use the brackets below
8 None
9 Less than €500
10 €500 to €999
2 €1 000 to €4 999
3 €5 000 to €9 999
4 €10 000 to €49 999
5 €50 000 to €99 999
6 €100 000 to €999 999
7 €1 million or more
9999998 Prefer not to say
9999999 Refusal
Questionnaire
Part 1. Acceptance of cash and preferences
Q1a. Which means of payment does your company accept from private customers at physical locations??
MULTIPLE ANSWES POSSIBLE
1 Cash
2 Physical cards (i.e. debit, credit and prepaid cards)
5 Bank cheque [only in countries that have bank cheques*]
8 Gift cards, vouchers or loyalty points
10 Mobile payments (e.g. smartphone, smartwatch)
11 Crypto-assets or stablecoins (e.g. Bitcoin, Ethereum, Tether)
12 Other
9999998 Don’t know / no answer
9999999 Refusal
*Option not presented in BE, LT, LV, NL, SK
Filter: IF D7 = 1 or 3, or D7b = 1
Q1b. As part of the card payments in physical locations, what type of cards do you accept?
MULTIPLE ANSWES POSSIBLE
1 Debit card
2 Credit card
3 Prepaid cards*
9999998 Don’t know / no answer
9999999 Refusal
* option not presented in LT
Filter: IF Q1=2
Q1c. As part of the card payments in physical locations do you accept contactless payments, which allow to pay without inserting the card into a terminal, at least for some card types?
1 Yes
0 No
9999998 Don’t know / no answer
9999999 Refusal
Filter: IF Q1=2
Q1e. What types of mobile payment methods do you accept?
MULTIPLE ANSWES POSSIBLE
1 Digital wallets (e.g. Google Pay, Apple Pay)
2 Instant payments (insert national examples from SPACE)
3 Payments initiated with scanning a QR-code
4 Other mobile payment apps
9999998 Don’t know / no answer
9999999 Refusal
Filter: IF Q1a_10=1
Q1g. Which means of payment does your company accept from private customers for online or remote payments?
1 Cards
2 A digital wallet (e.g. Google Pay, Apple Pay, Samsung Pay, Ali Pay, Amazon Pay, etc)
3 Instant payments (insert national examples from SPACE)
4 Other mobile apps or payment options
5 Credit transfer
6 Direct debit (i.e. merchant initiated a payment from my bank account)
7 Gift cards, vouchers or loyalty points
8 Crypto-assets including stablecoins (e.g. Bitcoin, Ethereum, Tether)
9 Buy now Pay later (national examples)
10 Other
Filter: IF D7 = 2 or 3
Q2b. How long has it been since you stopped accepting cash payments?
1 Less than 1 year
2 1 to 2 years
3 3 to 5 years
4 More than 5 years
5 We have never accepted cash (N)
9999998 Don’t know / no answer
9999999 Refusal
Filter: IF Q1≠ 1
Q2c. What are the main reasons your company decided not to accept cash?
UP TO 3 ANSWERS POSSIBLE
2 It is expensive (e.g. high bank fees,services provided by cash-in-transit companies)
3 It is time-consuming
4 It is risky in terms of internal fraud
5 It poses a security risk (i.e. robbery)
6 It is inconvenient or difficult to deposit or withdraw cash (i.e. short working hours, long travel distance)
7 It has a high risk of counterfeiting
8 It is not used often enough by our customers
9 It is difficult to keep enough change available (coins and low-denomination banknotes)
10 Cash payments exceeding a specified threshold are restricted under national legislation.
11 Other
12 None
9999998 Don’t know / no answer
9999999 Refusal
Filter: IF Q1≠ 1 AND D7 = 1
Q3. Do you think you will continue accepting cash in the next 5 years?
1 Yes
0 No
9999998 Don’t know / no answer
9999999 Refusal
Filter: if Q1 =1
Q3a: To the best of your knowledge, is there a law or regulation in [insert respondent’s country] that requires your company to accept cash payments?
1 Yes
0 No
999998 Don’t know / No answer
999999 Refusal
Filter: IF D7 = 1 or 3, or D7b = 1
Q3b What do you believe is the most likely consequence for your company if you would refuse a cash payment in violation of this law?
1 A significant fine
2 A formal warning from an authority
3 A complaint from the customer with little further action
4 No real consequence
999998 Don’t know / No answer
999999 Refusal
Filter: if Q3a=1
Q3d In the past year, has your company implemented any measures to encourage the use of digital payment methods or to reduce cash payments?
1 Yes
0 No
9999998 Don’t know / no answer
9999999 Refusal
Filter: D7 = 1 (Physical stores) AND Q1a_1 = 1
Q3e What kind of measures have you implemented to encourage the use of digital payments?
MULTIPLE ANSWERS POSSIBLE
1 Installed self-checkout terminals that do not accept cash
2 Acquired tills that accept cashless payments or reduced tills that accept cash
3 Provided incentives for non-cash payments (for example, cash credit on loyalty cards)
4 Promoted and advertised cashless payments
5 Other
9999998 Don’t know / no answer
9999999 Refusal
Filter: IF Q3d = 1
Q6b What are the biggest concerns for your company when dealing with cash payments?
UP TO THREE ANSWERS POSSIBLE
1 Depositing or withdrawing cash is expensive
2 Transporting cash to the bank is expensive (e.g. cash-in-transit companies services)
3 Cash depositing or withdrawing services are far away
4 Cash depositing or withdrawing services have limited opening hours
5 It is difficult to keep enough change (small banknotes and coins)
6 Safety (i.e. the risk of robbery)
7 Risk of mistakes when giving change
8 Risk of internal fraud
9 Regulation related to cash (e.g. anti-money laundering legislation, limits of cash payments)
10 Counting and managing cash takes staff time away from other tasks.
11 Other
12 None
9999998 Don’t know / no answer
9999999 Refusal
Filter: IF Q1a_1 =1
Q7a What is the most important criteria for your company when choosing to accept a means of payment?
1 Overall costs
2 Transaction speed
3 Ease of handling
4 Reliability/sensitivity to malfunctioning
5 Security (e.g. against hacking, robbery)
6 Consumer preference
7 Use by competitors
8 Privacy
9 Other
Q8a. How does cash compare with digital payments (with cards or mobile payments) in terms of …?
Much better | Slightly better | No difference | Slightly worse | Much worse | Don’t know / no answer | Refusal | ||
|---|---|---|---|---|---|---|---|---|
1 | Overall costs | 1 | 2 | 3 | 4 | 5 | 9999998 | 9999999 |
2 | Transaction speed | 1 | 2 | 3 | 4 | 5 | 9999998 | 9999999 |
3 | Ease of handling | 1 | 2 | 3 | 4 | 5 | 9999998 | 9999999 |
4 | Reliability/sensitivity to malfunctioning | 1 | 2 | 3 | 4 | 5 | 9999998 | 9999999 |
5 | Security (e.g. hacking, robbery) | 1 | 2 | 3 | 4 | 5 | 9999998 | 9999999 |
6 | Privacy | 1 | 2 | 3 | 4 | 5 | 9999998 | 9999999 |
Filter: IF Q1a_1=1 AND (Q1a_2=1 OR Q1a_10=1)
Q9a. Which means of payment would you prefer your customers to use when paying you in physical locations?
1 Cash
2 Debit card
3 Credit card
10 Mobile payment (e.g. smartphone, smartwatch)
12 Other
13 I have no preference
9999998 Don’t know / no answer
9999999 Refusal
Filter: IF D7 = 1 or 3, or D7b = 1
Part 2. Additional cash services
Q10a. Does your company have self-check-out terminals?
1 Yes
0 No
9999998 Don’t know / no answer
9999999 Refusal
Filter: IF Q1a_1=1
Q10b. Is cash accepted in your self-check-out terminals?
1 Yes, in all of them
2 Yes, in most of them
3 Yes, in some of them
4 No
9999998 Don’t know / no answer
9999999 Refusal
Filter: IF Q10a = 1
Q10c. Do you have a cash register used at the payment point for automated handling of cash payments?
1 Yes, one where the customer can insert the payment and get the change
2 Yes, one operated by the cashier
3 Yes, one operated either by the customer or the cashier or both
4 No
9999998 Don’t know / no answer
9999999 Refusal
Filter: IF Q1a_1=1
Q10d. Do you have a secure cash storage device (‘smart safe’) usually located in the back office that automatically counts, validates and monitors your cash deposits?
1 Yes
0 No
9999998 Don’t know / no answer
9999999 Refusal
Filter: IF Q1a_1=1
Q12 Do you allow your customers to withdraw cash when they pay by card or mobile phone?
1 Yes, when they make a purchase above a certain amount
2 Yes, when not making a purchase
3 No
9999998 Don’t know / no answer
9999999 Refusal
Filter: IF Q1a_1=1
Part 3. Withdrawal and deposit behaviour
Q19. Does your company do any of the following…?
MULTIPLE ANSWERS POSSIBLE
Yes | No | Don’t know / no answer | Refusal | ||
|---|---|---|---|---|---|
1 | Withdraw cash | 1 | 0 | 9999998 | 9999999 |
2 | Deposit cash | 1 | 0 | 9999998 | 9999999 |
3 | Use services provided by a cash-in-transit (CIT) company | 1 | 0 | 9999998 | 9999999 |
Filter: IF D7 in (1,3) or D7b=1
Q20. How does your company withdraw cash?
MULTIPLE ANSWERS POSSIBLE
1 Over the bank counter
2 Via an ATM
3 By using a cash-in-transit company (if Q19_3=1)
4. By withdrawing cash at another store
5 Other
9999998 Don’t know / no answer
9999999 Refusal
Filter: IF Q19_1 =1
Q21a. How easy or difficult is it for you or someone else from your company to get to a bank to withdraw cash over the counter? (M)
1 Very easy
2 Fairly easy
3 Fairly difficult
4 Very difficult
9999998 Don’t know / no answer
9999999 Refusal
Filter: IF Q20_ 1=1
Q21b. How easy or difficult is it for you or someone else from your company to get to an ATM to withdraw cash?
1 Very easy
2 Fairly easy
3 Fairly difficult
4 Very difficult
9999998 Don’t know / no answer
9999999 Refusal
Filter: IF Q20 _2=1
Q22. Why does your company withdraw cash?
MULTIPLE ANSWERS POSSIBLE
1 To have change
2 To pay suppliers
3 To pay salaries
4 To pay taxes or other bills
5 Other (DO NOT READ OUT)
9999998 Don’t know / no answer
9999999 Refusal
Filter: IF Q19_1 =1
Q31a Do you consider the fees charged by your commercial bank/s or other cash suppliers for withdrawing cash (banknotes and coins) reasonable?
1 Yes
0 No
9999998 Don’t know / no answer
9999999 Refusal
Filter IF Q19_1=1
Q23. How does your company deposit cash?
MULTIPLE ANSWERS POSSIBLE
1 Over the bank counter
2 In a bank night vault (seal bag machines)
3 Via a cash-in machine/cash deposit machine
4 By using a cash-in-transit company (if Q19_3=1)
5 Other (DO NOT READ OUT)
9999998 Don’t know / no answer
9999999 Refusal
Filter: IF Q19_2 = 1
Q24a. How easy or difficult is it for you or someone else from your company to get to a bank to deposit cash over the counter?
1 Very easy
2 Fairly easy
3 Fairly difficult
4 Very difficult
9999998 Don’t know / no answer
9999999 Refusal
Filter: IF Q23_1 = 1
Q24b. How easy or difficult is it for you or someone else from your company to get to a bank night vault (seal bag machine) to deposit cash?
1 Very easy
2 Fairly easy
3 Fairly difficult
4 Very difficult
9999998 Don’t know / no answer
9999999 Refusal
Filter: IF Q23_2 = 1
Q24c. How easy or difficult is it for you or someone else from your company to get to a cash depositing machine to deposit cash?
1 Very easy
2 Fairly easy
3 Fairly difficult
4 Very difficult
9999998 Don’t know / no answer
9999999 Refusal
Filter: IF Q23_3 = 1
Q31b Do you consider the fees charged by your commercial bank/s or other cash suppliers for depositing cash (banknotes and coins) reasonable?
1 Yes
0 No
9999998 Don’t know / no answer
9999999 Refusal
Filter: IF Q19_2=1
Q25. On average how often does your company deposit cash?
1 More than 5 times per week
2 3 to 5 times per week
3 Once or twice per week
4 Less than once a week
5 About once every second week
6 About once a month
7 Less often
9999998 Don’t know / no answer
9999999 Refusal
Filter: IF Q19_2 = 1
Q41 How do you usually manage coin flows in your company?
MULTIPLE ANSWERS POSSIBLE
1 I keep all coins as change for the next day
2 I deposit any excess coins in a bank, cash-in machine or night vault
3 I give excess coins to other businesses in exchange to banknotes
4 I need more coins and regularly go to a bank or ATM
5 I need more coins and go to other businesses or agents
6 I use services provided by cash-in-transit companies when I have excess coins or need additional coins
9999998 Don’t know / no answer
9999999 Refusal
Filter: IF Q1a_1 = 1
Q41 How would you rate your company’s ability to obtain low-denomination coins when needed for change?
1 Very easy
2 Fairly easy
3 Fairly difficult
4 Very difficult
5 Our company usually does not need low-denomination coins
9999998 Don’t know / no answer
9999999 Refusal
Filter: IF Q1a_1 = 1
Q28. Please indicate for which services your company uses a cash-in-transit (CIT) company?
MULTIPLE ANSWERS POSSIBLE
1 Cash transportation services
2 Cash handling services
3 Security services
6 Smart tills services
4 Other
5 Prefer not to say
9999998 Don’t know / no answer
9999999 Refusal
Filter: IF Q19_3 =1
Q32a Is your preference on how your customers pay affected by the distance or availability of cash services?
1 Yes
0 No
9999998 Don’t know / no answer
9999999 Refusal
Filter: IF (D4=1 or 2) & Q1a_1=1
Q32b Is your preference on how your customers pay affected by the fees charged by your bank on cash services?
1 Yes
0 No
9999998 Don’t know / no answer
9999999 Refusal
Filter: IF (D4=1 or 2) & Q1a_1=1
© European Central Bank, 2026
Postal address 60640 Frankfurt am Main, Germany
Telephone +49 69 1344 0
Website www.ecb.europa.eu
All rights reserved. Reproduction for educational and non-commercial purposes is permitted provided that the source is acknowledged.
For specific terminology please refer to the ECB glossary (available in English only).
PDF ISBN 978-92-899-8007-4, doi:10.2866/6566925, QB-01-26-210-EN-N
HTML ISBN 978-92-899-8006-7, doi:10.2866/6156742, QB-01-26-210-EN-Q
Bulgaria, which joined the euro area on 1 January 2026, is only included in the 2026 survey wave. The transition period, during which people and businesses were still becoming familiar with euro banknotes and coins, may have created temporary concerns or uncertainties. Croatia, which joined the euro area on 1 January 2023, is included in the 2024 and 2026 survey waves but not the 2021 survey wave.
Companies that are exclusively active in the business-to-business sector were explicitly filtered out in the 2026 survey wave. There were 54 such companies, i.e. a very small share compared to the net sample of 8,205 companies. The samples for the 2021 and 2024 survey waves may include a very limited number of such enterprises.
The same weighting methodology has been applied in all survey waves. Weights are applied to the sample to accurately extrapolate the results to the entire population of companies in the euro area, mitigating differences between the number of employees in the sample of companies covered by the survey and the total population of companies.
Some methodological changes – in particular the exclusion of companies that are exclusively active in the business-to-business sector in the 2026 survey wave – may still have a small impact on the cash acceptance rates.
Companies with less than 250 employees are classified as SMEs. For analyses performed by company size, these are further broken down into micro (1-9 employees), small (10-49 employees) and medium-sized (50-249 employees) companies.
The data on the acceptance of various payment instruments are based on information obtained through telephone interviews with companies. Other studies examining the acceptance of cash are conducted in several euro area countries (e.g. Germany, Spain and the Netherlands). These studies are based on different samples and employ different methodologies, such as, for example, a person (a “mystery shopper”) attempting to make actual payments with cash or other means of payment. No direct comparison can be made between such studies and the results presented in this report.
In some countries, legislation making the acceptance of cash mandatory is in place or in preparation, and such legislation is also being prepared at EU level. To analyse the attitudes of companies, the question on future acceptance was asked irrespective of the legislative situation in the country concerned. The large share of companies planning to stop accepting cash in Cyprus and Greece may be due in part to high dissatisfaction with fees (see aggregate statistics on access to cash and satisfaction with cash services), or national legislation requiring merchants to accept electronic card payments (in Cyprus), but the figures require further investigation.
Information on the use of CIT companies is available in aggregate statistics on access to cash and satisfaction with cash services.
The response options in the survey questionnaire are “Over the bank counter”, “In a bank night vault (seal bag machines)”, “Via a cash-in machine/cash deposit machine”, “By using a cash-in-transit company” and “Other”.
For more on SUCH, see Esselink, H. and Hernández, L. (2017), “The use of cash by households in the euro area”, Occasional Paper Series, No 201, ECB, November. For more on SPACE, see ECB (2020), Study on the payment attitudes of consumers in the euro area (SPACE), Frankfurt am Main; ECB (2022), Study on the payment attitudes of consumers in the euro area (SPACE) – 2022, Frankfurt am Main; and EBC (2024), Study on the payment attitudes of consumers in the euro area (SPACE) – 2024, Frankfurt am Main. The ECB also conducted the SPACE survey in 2026.
There are significant differences in how SPACE and the survey on the use of cash by companies in the euro area measure acceptance. SPACE measures perceived acceptance of cash, while the survey on the use of cash by companies in the euro area measures acceptance as reported by companies. More importantly, SPACE measures acceptance at payment level, while the survey on the use of cash by companies in the euro area measures the share of companies that accept cash. For these reasons, the results of the two surveys are not fully comparable.
-
13 August 2026