
Results of a special survey of professional forecasters on the ECB’s new monetary policy strategy
Executive Summary
The new monetary policy strategy of the European Central Bank (ECB) was published on 8 July 2021. The ECB’s strategy had been last been reviewed in 2003. A monetary policy strategy serves two main purposes: first, it provides policymakers with a coherent analytical framework that maps actual or expected economic developments into policy decisions; second, it serves as a vehicle for communicating with the public. In October 2021 a special survey was conducted among the panel of participants in the ECB’s regular Survey of Professional Forecasters (SPF) to understand how they assessed the new strategy and what implications it had for their macroeconomic expectations. This document provides the aggregated results. Responses were received from 51 institutions, i.e. almost 90% of respondents to the regular survey round carried out at the same time.
Overall, respondents considered the new strategy to be an improvement. They identified the clear 2% inflation target and explicit reference to symmetry as key elements. Respondents were asked about 14 key dimensions of the outcome of the strategy review. On balance, they considered them important and an improvement, and thought the new strategy made it more likely that the ECB would meet its mandate and primary objective of price stability in the euro area. However, some cautioned that practical implementation in terms of actual policy changes would ultimately determine whether the inflation target would be met.
Around one-third of respondents indicated that they had revised or would revise their macroeconomic expectations as a consequence of the review. For inflation and cost variables (headline inflation, underlying inflation and labour costs), changes to near-term forecasts were limited, while changes to longer-term forecasts were generally to the upside. For real economy variables (real GDP and the unemployment rate), the changes reported were generally for medium-term forecasts. For elements of the ECB’s monetary policy toolkit (interest rates, forward guidance, asset purchases and longer-term refinancing operations (LTROs)), respondents had generally revised their forecasts in response to the new strategy in the direction of an easing of the policy stance.
The overall results point to a strong correspondence between what respondents saw as key elements and key improvements in the new strategy, but some respondents cautioned that actual actions would matter more than words. Participants considered it was not clear how owner-occupied housing was to be included, or to what extent or how long an overshooting of the inflation target might be tolerated. A number of respondents also thought that monetary policy might be distracted from its primary objective by the consideration of other aspects, such as climate change. Some respondents said that some dimensions of asset purchases (in particular possible limits on holdings) were not adequately clarified in the new strategy.
1 Background and introduction
In the SPF survey round for the fourth quarter of 2021, in addition to the regular questionnaire, respondents also received a special questionnaire to garner their assessment of the ECB’s new monetary policy strategy. The questionnaire (see Table A1 in the Annex) covered multiple dimensions of the strategy review and was designed such that respondents could provide very quick answers (via drop-down selections) to most of the questions and could add free-text comments should they wish to do so.
The response rate to the special survey was very high. Altogether 51 respondents replied to the questionnaire, i.e. almost 90% of participants in the fourth quarter round. In addition to the responses via the drop-down options, 40 respondents provided a total of 285 qualitative comments, allowing a richer understanding of the factors underlying the summary assessments provided via the drop-down options.[1]
2 Main findings
Three-quarters of respondents viewed the ECB’s new monetary policy strategy as an improvement (see Chart 1). In response to the question, “What is your overall assessment of the ECB’s new monetary policy strategy compared with the situation before?” (Question 1), almost 20% of respondents thought that the new monetary policy strategy was “much better”, with a further 60% considering it “somewhat better”. Almost 20% thought it was “about the same”. Only a small minority (three, i.e. 6%) of respondents said they considered the new monetary policy strategy to be “somewhat worse” and none thought it “much worse”. The net percentage balance was clearly positive, at +45%.[2]
Chart 1
What is your overall assessment of the ECB’s new monetary policy strategy compared with the situation before?
(percentages of responses)
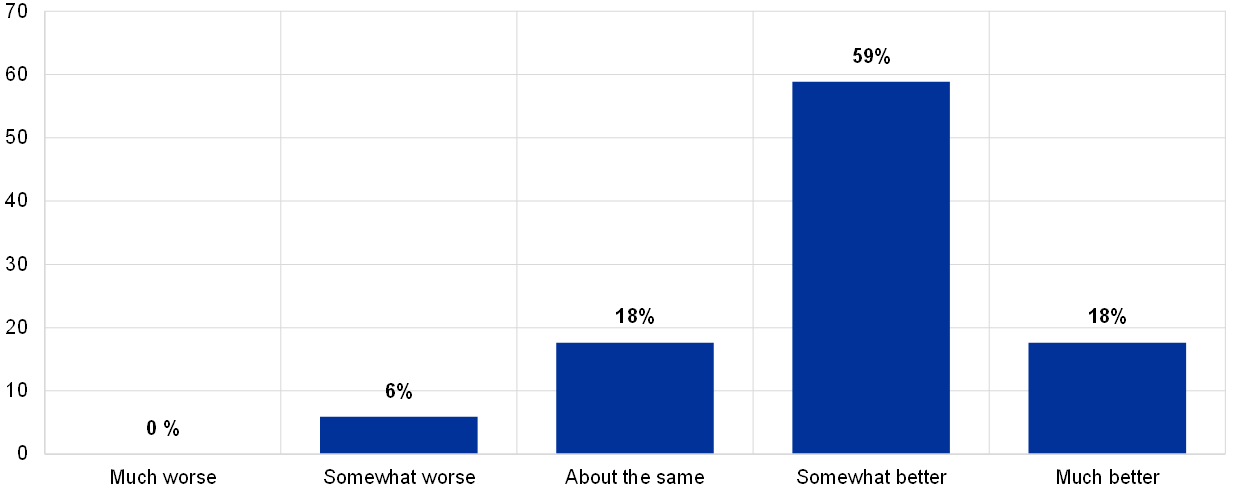
Note: 51 responses.
Respondents identified the clearer inflation target of 2% and the explicit reference to symmetry as the key aspects in the new strategy. In their qualitative comments in response to the question “What, in your opinion, are the key aspects/dimensions of the new monetary policy strategy?” (Question 11), respondents mentioned a large number of dimensions but focused unmistakably on the clearer 2% inflation target and the explicit reference to symmetry in the target. Other aspects identified by many respondents were (a) the statement that taking into account the implications of the effective lower bound (ELB) requires “especially forceful or persistent monetary policy measures”; (b) the statement that forward guidance, asset purchases and longer-term refinancing operations will remain part of the ECB’s monetary policy toolkit; (c) the confirmation, and what some respondents considered to be a strengthening, of the medium-term orientation of monetary policy; (d) the recognition that climate change has implications for price stability and the adoption of a climate-related action plan; (e) plans to better take into account owner-occupied housing costs in the measurement of inflation; and (f) the more explicit declaration that the Eurosystem, without prejudice to the price stability objective, shall support the general economic policies in the EU.
On balance, respondents considered that the new strategy would make it more likely that the ECB meets its primary objective of price stability in the euro area (see Chart 2). In response to the question “In your opinion, will the new strategy make it more or less likely that the ECB will meet its mandate and primary objective of price stability in the euro area?” (Question 2), almost 40% of respondents thought that the new strategy would make it either somewhat more likely or much more likely that the ECB would fulfil its mandate. Just over half (55%) thought it would be about the same as with the previous strategy (i.e. neither more nor less likely). Only three respondents (6%) thought it would make it somewhat less likely, and none thought much less likely. The net percentage balance was positive, at +19%.
Chart 2
In your opinion, will the new strategy make it more or less likely that the ECB will meet its mandate and primary objective of price stability in the euro area?
(percentages of responses)
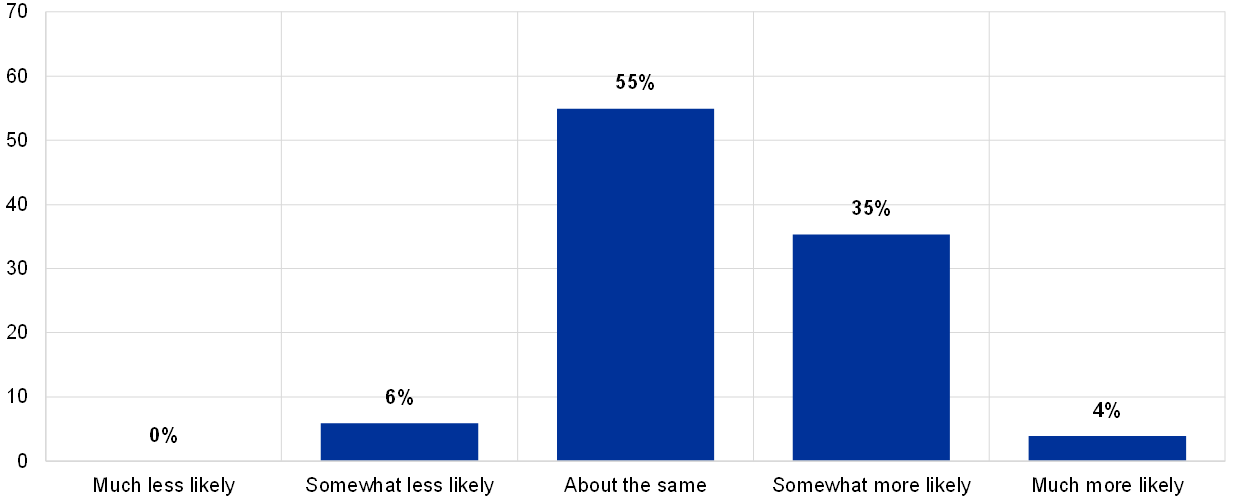
Note: 51 responses.
Respondents also considered the clearer inflation target and its symmetric nature to be the key improvements in the new strategy. In their qualitative comments in response to the question “What, in your opinion, are improvements or positive aspects?” (Question 12), respondents mentioned a number of different factors but considered the clearer, symmetric inflation target to be key, particularly as they facilitated communication with the general public and made it easier for the public to understand the strategy. Other positive aspects mentioned by a number of respondents were the support for a better inclusion of owner-occupied housing in inflation measures, the climate-related action plan and the statement that “especially forceful or persistent monetary policy measures are required when the economy is close to the ELB”.
Respondents expressed the opinion that practical implementation in terms of actual policy changes would ultimately determine whether the inflation target would be met. In their qualitative comments in response to the question “What, in your opinion, are negative or missing aspects?” (Question 13), respondents mentioned a wide range of issues. For example, a point frequently made was that it was not yet spelt out how the strategy would be implemented in practice and that this would ultimately determine whether the inflation target would be met. Another relatively common theme was perceived ambiguity in aspects such as the inclusion of owner-occupied housing in the strategy and the extent and duration of an overshooting of the inflation target that might be tolerated. A number of respondents also thought that monetary policy might be distracted from its primary objective by the consideration of other aspects, such as climate change. Some respondents said that some dimensions of asset purchases (in particular possible limits on holdings) were not adequately clarified in the new strategy.
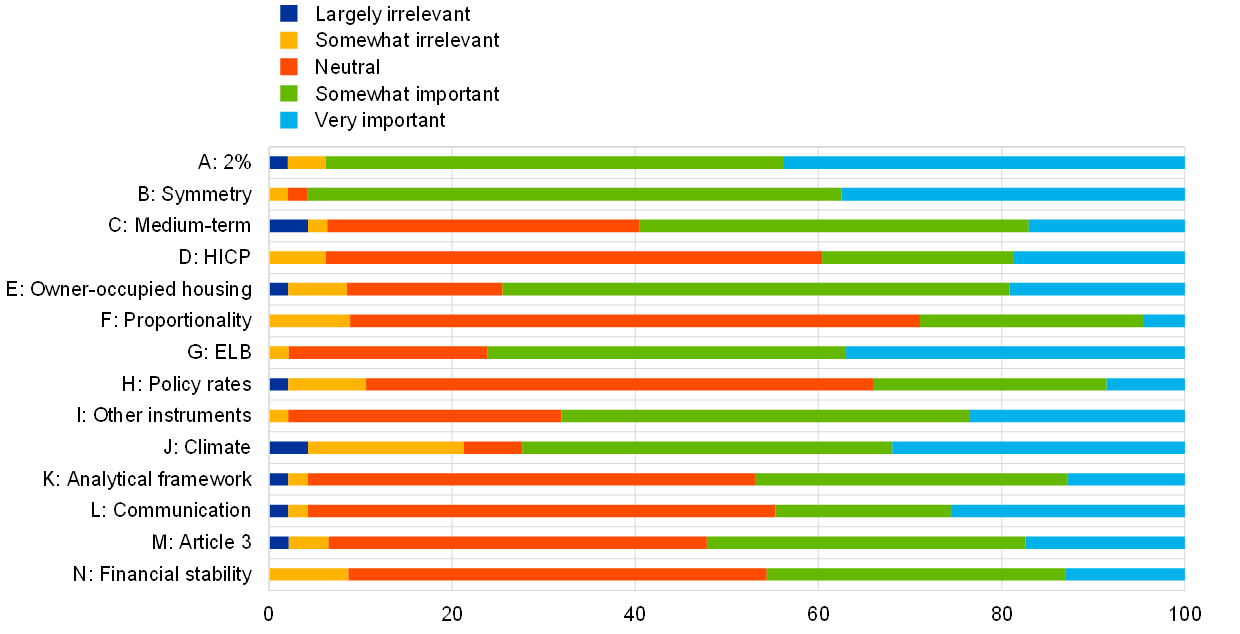
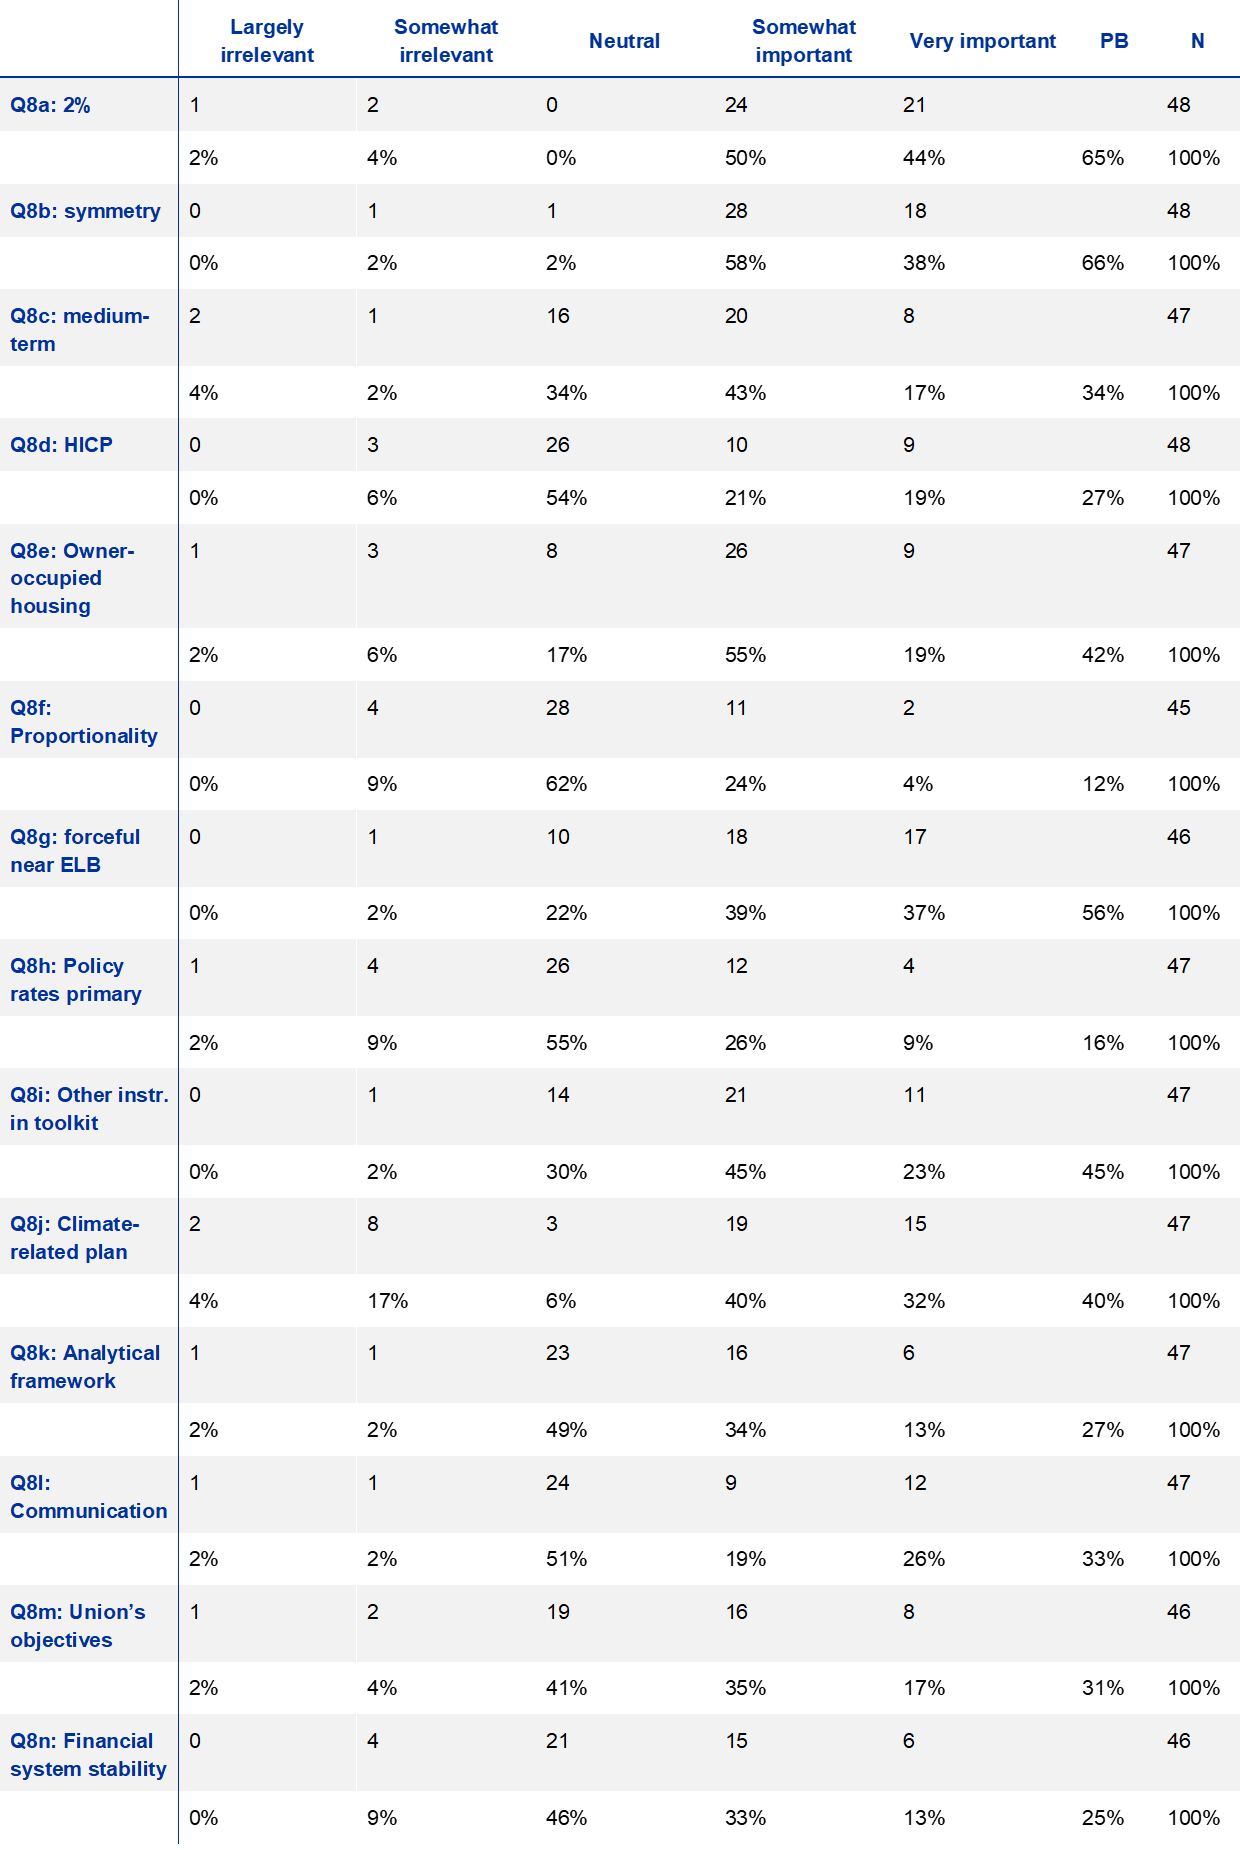
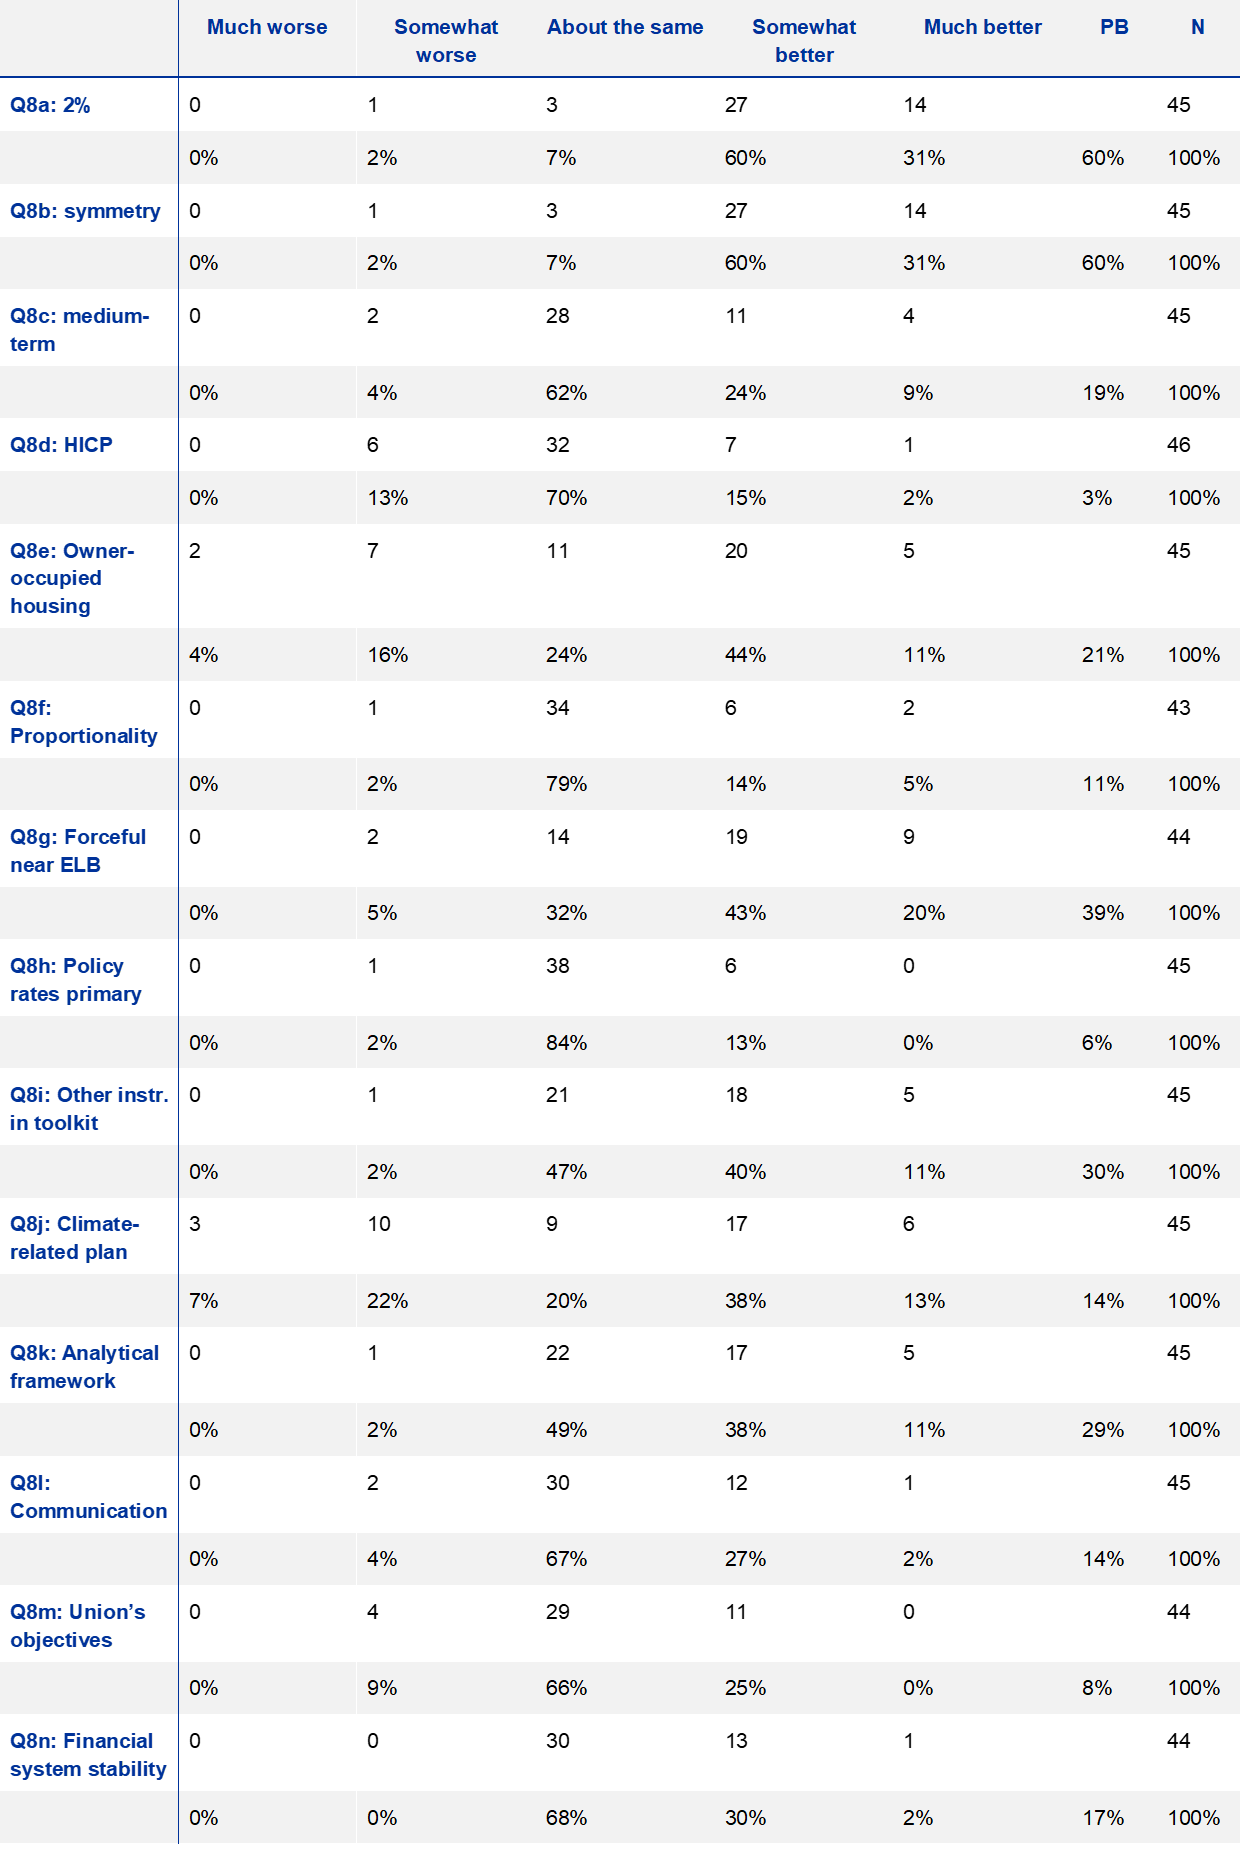
When asked about the importance of specific dimensions of the new strategy and whether these were now better or worse, most respondents considered them all to be at least somewhat important and all at least somewhat better (see Chart 3). For example, when asked about the move away from “below, but close to, 2%” to a target of 2% (Question 8a), a clear majority (94%) of respondents considered it to be either “very important” (44%) or “somewhat important” (50%). None considered it “neutral”, while only three respondents (6%) considered it either “somewhat irrelevant” or “largely irrelevant”. The net percentage balance was clearly positive, at +65%. In terms of whether the change constituted an improvement, again a clear majority (91%) thought it had made the strategy either “much better” (31%) or “somewhat better” (60%), while three respondents (7%) thought it was “about the same” and one (or 2%) thought it was “somewhat worse”. None thought it was “much worse”. The net percentage balance was clearly positive, at +60%. For detailed percentages of the answers on the other dimensions see Table A2 in the Annex.
Chart 3
Respondents were asked for their opinion of the following elements/statements in terms of their unimportance/importance and whether they represent a deterioration/improvement in the strategy
a) What is your assessment of the following elements/statements in terms of their unimportance/importance?
(percentages of responses)
b) What is your assessment of the following elements/statements in terms of whether they represent a deterioration/improvement in the strategy?
(percentages of responses)
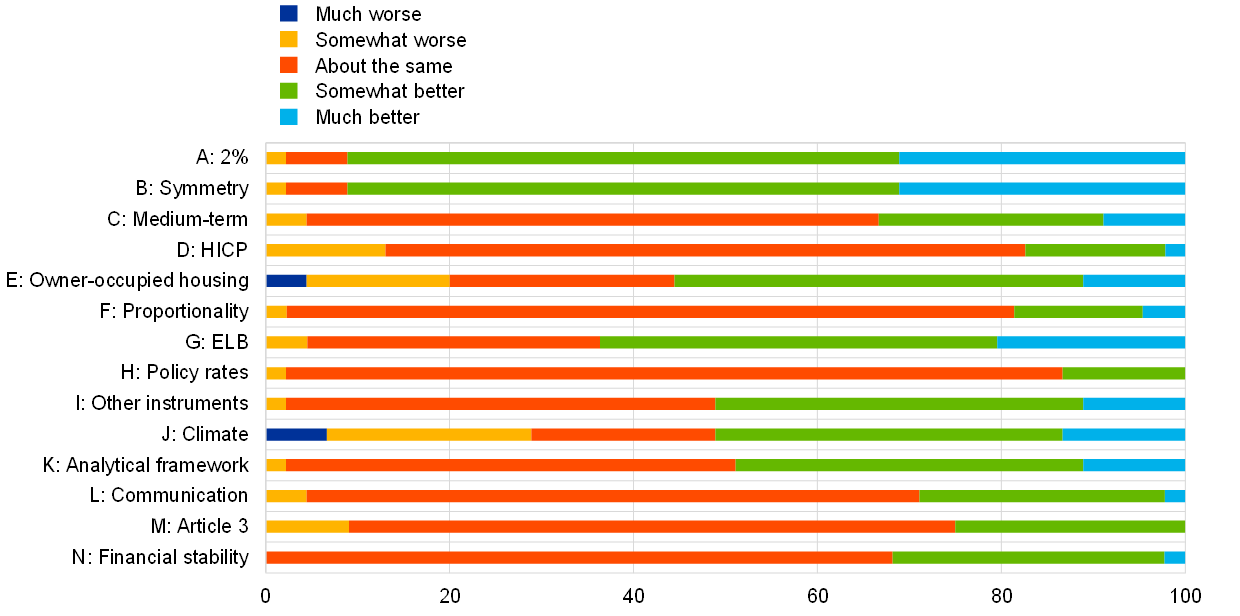
Notes: 43-48 responses per dimension. Element A refers to “Move away from ‘below but close to 2%’ to ‘2%’”; Element B refers to “Explicit reference to symmetry in the 2% inflation target”; Element C refers to “Confirmation of medium-term orientation”; Element D refers to “HICP remaining appropriate index for quantifying the price stability objective”; Element E refers to “Recommendation of roadmap to include owner-occupied housing in the HICP”; Element F refers to “Proportionality assessment”; Element G refers to “Especially forceful or persistent monetary policy measures when close to effective lower bound (ELB)”; Statement H refers to “Primary monetary policy instrument is the set of ECB policy rates”; Statement I refers to “Other instruments (forward guidance, asset purchases and longer-term refinancing operations) will remain an integral part of the toolkit”; Element J refers to “Adoption of climate-related action plan”; Element K refers to “Analytical framework (from two-pillar to integrated assessment of economic and monetary and financial analysis)”; Element L refers to “Communication”; Statement M refers to “Without prejudice to the price stability objective, the Eurosystem shall support the general economic policies in the EU with a view to contributing to the achievement of the Union’s objectives as laid down in Article 3 of the Treaty on European Union”; and Statement N refers to “The Eurosystem shall also contribute to the smooth conduct of policies pursued by the competent authorities relating to the prudential supervision of credit institutions and the stability of the financial system”.
In general, there was a strong correlation between the ranking of the various dimensions in terms of their perceived importance and in terms of the perceived improvement they led to. In terms of percentage balances, respondents ranked the explicit reference to symmetry and the move from “below, but close to, 2%” to “2%” as the two most important elements (see Table 1). Other elements with relatively high net percentage balances were the reference to especially forceful or persistent measures when close to the ELB, the permanently expanded toolkit and the climate-related action plan. However, all the dimensions surveyed received a positive net percentage balance, indicating that respondents considered them important. In terms of the ranking of improvement, the first four items (symmetry, the 2% target, especially forceful or persistent measures when close to the ELB and the expanded toolkit) were ranked the same as for their importance. More generally there was a strong correlation between the rankings of the various dimensions in terms of their perceived importance and the perceived improvement they led to, with a Pearson rank correlation coefficient of 0.87 and all the elements being in the upper right-hand quadrant of the importance/improvement matrix (see Chart 4).
Table 1
Ranking of elements/statements by (a) importance and (b) contribution to improvement
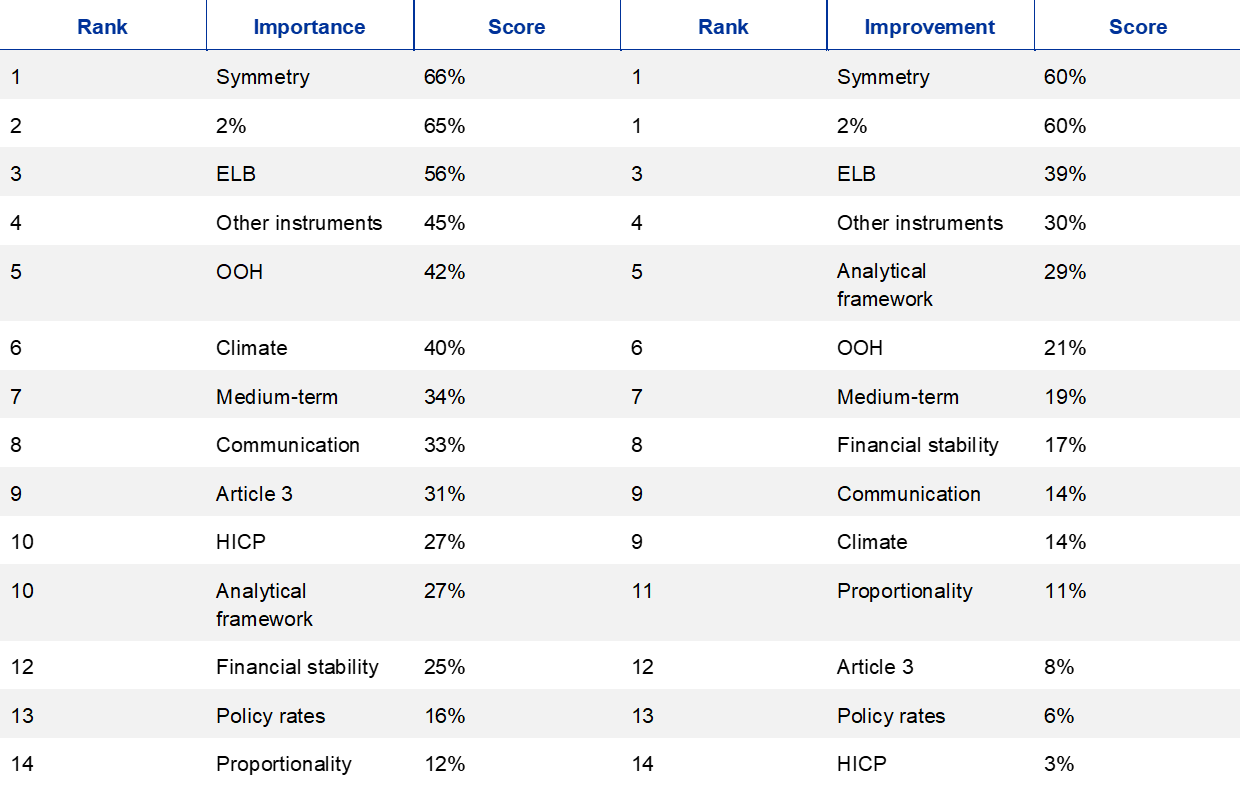
Notes: “Symmetry” refers to “Explicit reference to symmetry in the 2% inflation target”; “2%” refers to “Move away from ‘below, but close to, 2%’ to ‘2%’”; “ELB” refers to “Especially forceful or persistent monetary policy measures when close to effective lower bound (ELB)”; “Other instruments” refers to “Other instruments (forward guidance, asset purchases and longer-term refinancing operations) will remain an integral part of toolkit”; “OOH” refers to “Recommendation of roadmap to include owner-occupied housing in the HICP”; “Climate” refers to “Adoption of climate-related action plan”; “Medium-term” refers to “Confirmation of medium-term orientation”; “Communication” refers to “Communication”; “Article 3” refers to “Without prejudice to the price stability objective, the Eurosystem shall support the general economic policies in the EU with a view to contributing to the achievement of the Union’s objectives as laid down in Article 3 of the Treaty on European Union”; “HICP” refers to “HICP remaining appropriate index for quantifying the price stability objective”; “Analytical Framework” refers to “Analytical framework (from two-pillar to integrated assessment of economic and monetary and financial analysis)”; “Financial stability” refers to “The Eurosystem shall also contribute to the smooth conduct of policies pursued by the competent authorities relating to the prudential supervision of credit institutions and the stability of the financial system”; “Policy rates” refers to “Primary monetary policy instrument is the set of ECB policy rates”; and “Proportionality” refers to “Proportionality assessment”.
Chart 4
Correlation of assessments of the importance and contribution to improvement of various elements of the new strategy
(x-axis: percentage balance for importance; y-axis: percentage balance for improvement of strategy)
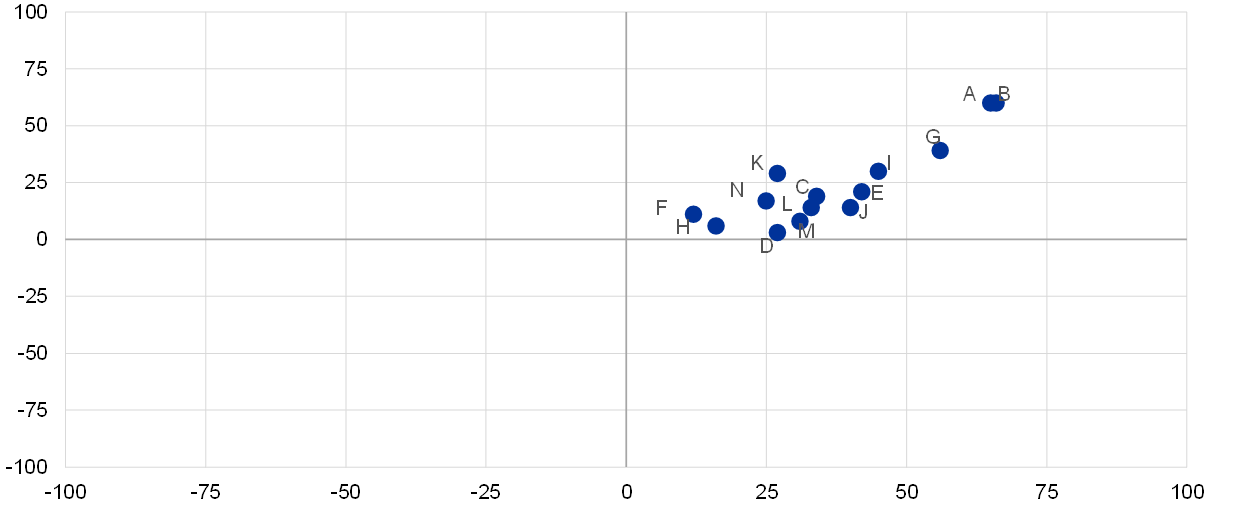
Notes: For explanation of elements A-N, see the notes to Chart 3
A clear majority of respondents said that the new strategy had improved their understanding of the ECB’s price stability target, and a small majority (just over 50%) said it had improved their understanding of the ECB’s monetary policy reaction function (see Chart 5). A clear majority of respondents (76%) said that the new strategy had significantly improved their understanding of the ECB's price stability objective and 24% said it had not, some of the latter arguing that the previous formulation was already clear enough and symmetry was also understood there. On balance, the new strategy has also helped improve respondents’ understanding of the ECB’s monetary policy reaction function, with 53% agreeing with this statement and 47% disagreeing. In their qualitative comments on Question 4, many respondents said that actions would ultimately determine whether the policy reaction function had become clearer.
Chart 5
Has the new monetary policy strategy enhanced your clarity of understanding of…?
(percentages of responses)
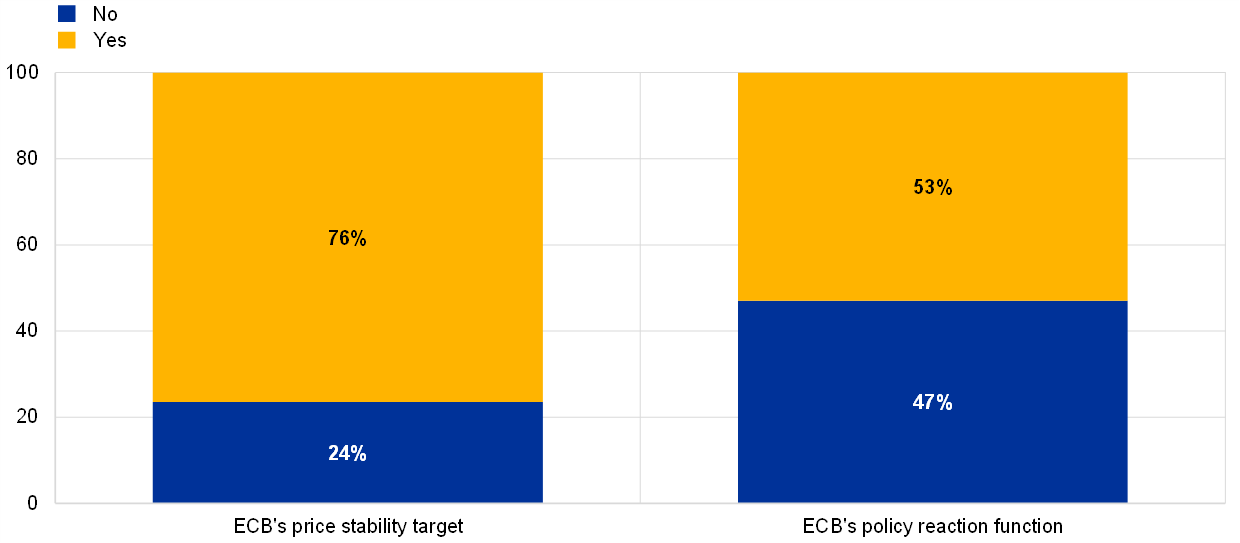
Note: 51 responses to both questions.
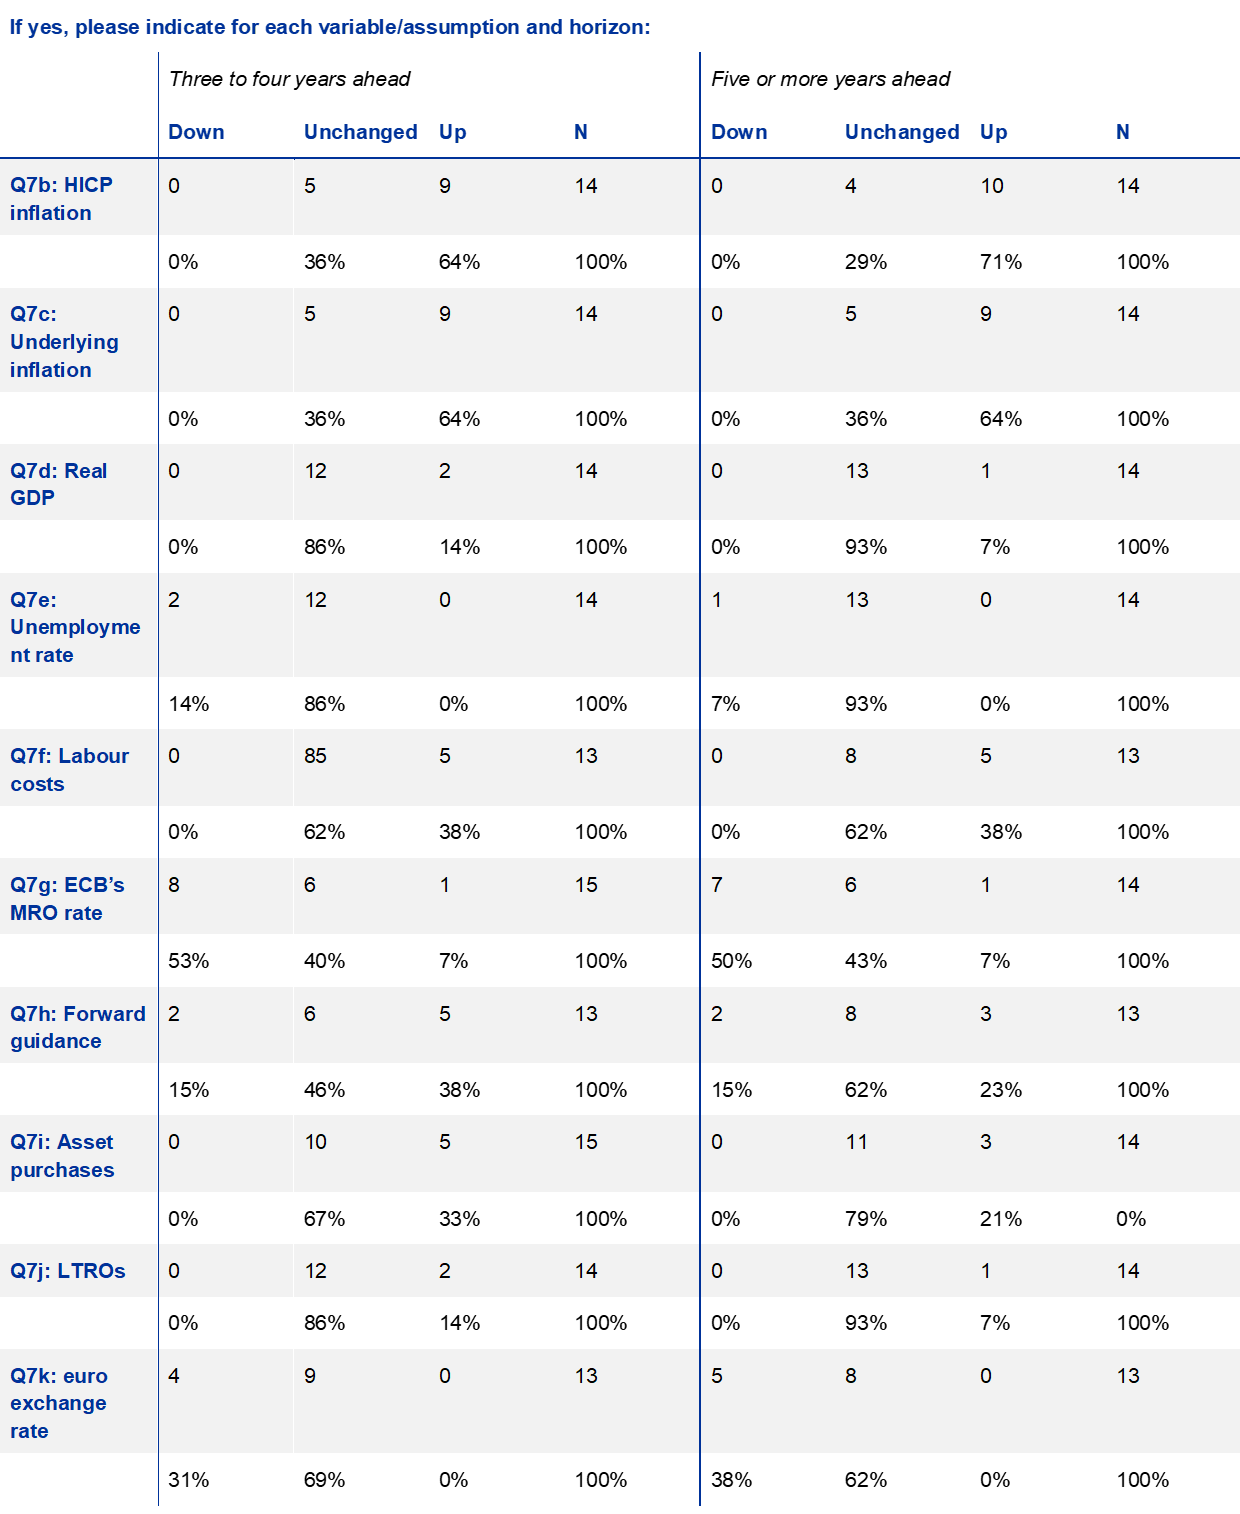
Around one-third of respondents said that they had changed their macroeconomic forecasts in response to the new strategy. Of the 50 respondents to Question 7, one-third (17) said they had revised their macroeconomic forecasts, while two-thirds (33) said they had not. Respondents that reported having changed their forecasts were then asked about a number of variables (HICP inflation, underlying inflation, real GDP, the unemployment rate, labour costs, interest rates, forward guidance, asset purchases, LTROs and the euro exchange rate) and horizons (up to one year ahead, one to two years ahead, three to four years ahead and five or more years ahead) – see Chart 6.
For headline inflation, underlying inflation and labour costs, changes to near-term forecasts were limited, while changes to longer-term forecasts were generally to the upside. In response to Questions 7b, 7c and 7f, which asked about HICP inflation, underlying inflation and labour costs respectively, respondents that reported having changed their macroeconomic forecasts in response to the new strategy indicated that they did not do so for the very near-term horizon (up to one year ahead). However, as the horizon lengthened, a growing number of respondents indicated that they had increased their forecasts to the upside. For example, for HICP inflation five or more years ahead, 71% of respondents reported that they had raised their forecasts. For the euro exchange rate (Question 7k), a number of respondents (14-38% depending on the horizon) indicated that they had revised down their forecasts.
For real economy variables (real GDP and the unemployment rate), reported changes as a result of the new strategy were generally for medium-term horizons. In response to Questions 7d and 7e, which asked about real GDP growth and the unemployment rate respectively, respondents that reported having changed their macroeconomic forecasts in response to the new strategy indicated that they did so for medium-term horizons (one to two years ahead and three to four years ahead) and less so for the near-term horizon (up to one year ahead) or the longer-term horizon (five or more years ahead).
For elements of the ECB’s monetary policy toolkit (interest rates, forward guidance, asset purchases and LTROs) respondents had generally revised their forecasts in response to the new strategy in the direction of an easing of the policy stance. In response to Questions 7g, 7h, 7i and 7j, which asked about the interest rate on the main refinancing operations (MRO), forward guidance, asset purchases and LTROs respectively, respondents that had revised their forecasts in response to the new strategy had generally done so in the direction of an easing of the policy stance (i.e. interest rates down, forward guidance lengthened and asset purchases and LTROs increased). For interest rates, although there was little change for the near term (up to one year ahead), around a quarter of respondents indicated they had revised down their forecast for the one to two-year ahead horizon, while around half had revised their forecasts down for the two to four-year ahead and five-year or more ahead horizons. On forward guidance, respondents had generally revised their forecasts in the direction of a lengthening of the current period of forward guidance. On asset purchases and LTROs, a number of respondents indicated that they had revised up their forecasts. This was more the case for asset purchases than LTROs and also more for the one to two-year ahead and three to four-year ahead horizons.
Chart 6
If you have changed your macroeconomic forecasts in response to the new monetary policy strategy, indicate down/unchanged/up for each variable/assumption and horizon
(percentages of responses)
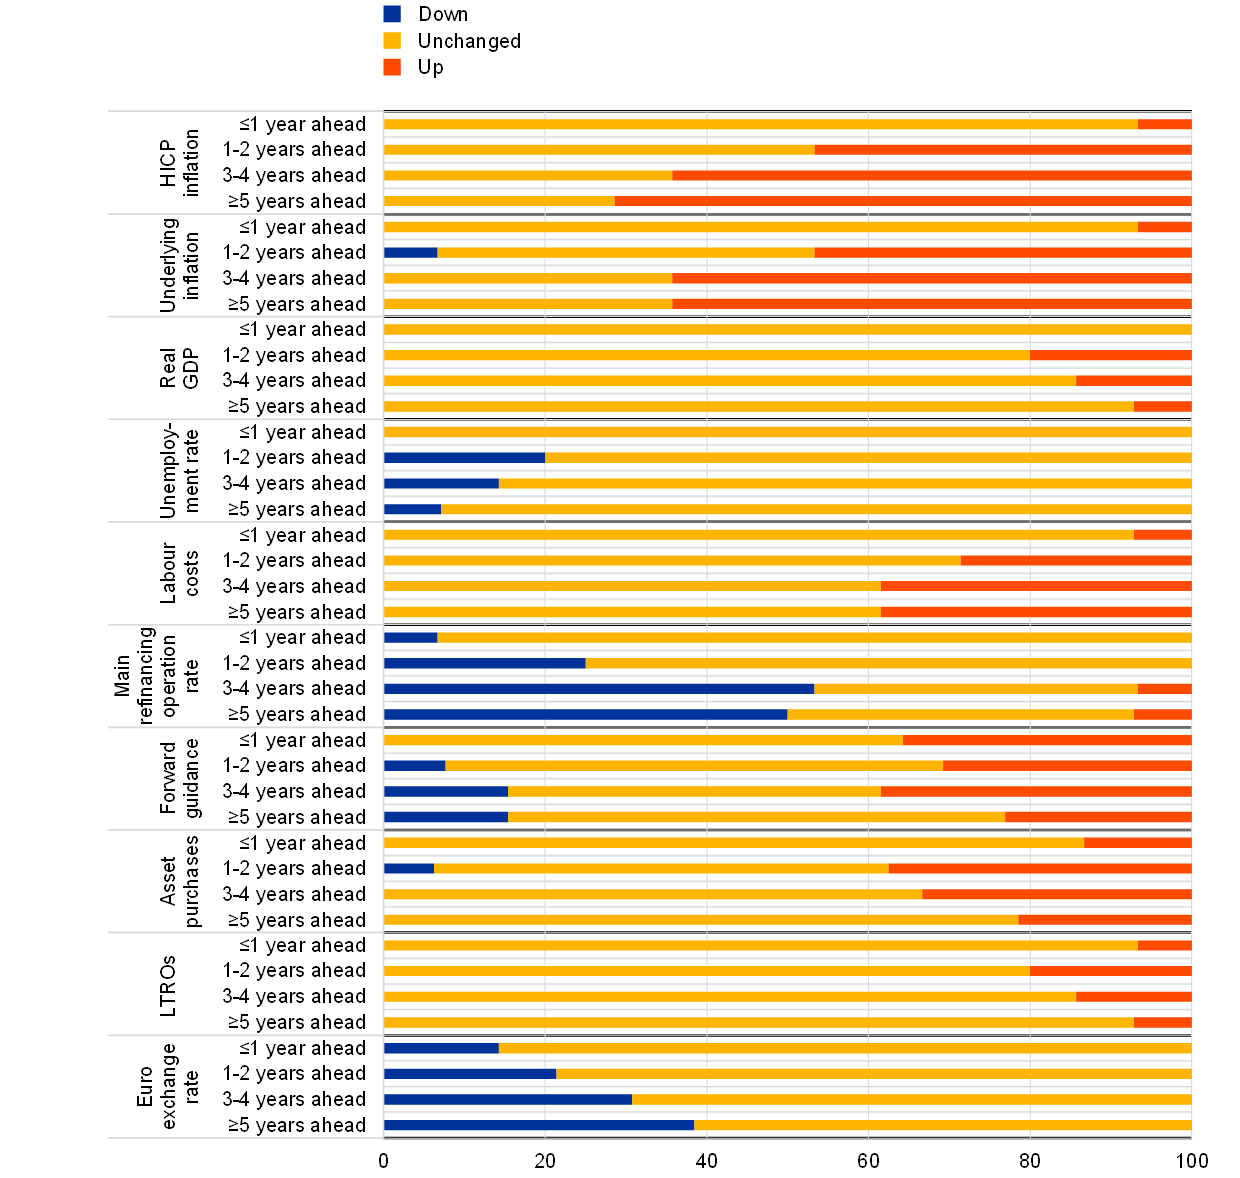
Notes: Between 13 and 16 responses for each dimension and horizon. For forward guidance, “shorter” is represented by “down” and “longer” is represented by “up”; for the euro exchange rate “down (depreciation)” is represented by “down” and “up (appreciation)” is represented by “up”.
Considering longer-term inflation expectations in more detail, a large share (about 60%) of respondents kept their five-year ahead inflation expectations unchanged in response to the new monetary policy strategy, but over one-third revised them up (see Chart 7). Slightly over one-third of respondents (36%) said they had revised their five-year ahead inflation expectations, while 64% said they had not. Of those saying they had revised their expectations, the vast majority (94%) had revised them upward.[3] When asked how by much they had changed their five-year ahead inflation expectations, 67% said by 0.1 percentage points, 17% said by 0.2 percentage points and 6% (one respondent) by 0.3-0.5 percentage points (see Chart 8). The remainder (11%) did not provide a quantitative answer.
Chart 7
In response to the new monetary policy strategy, have you revised or changed your assessment of
(percentages of responses)
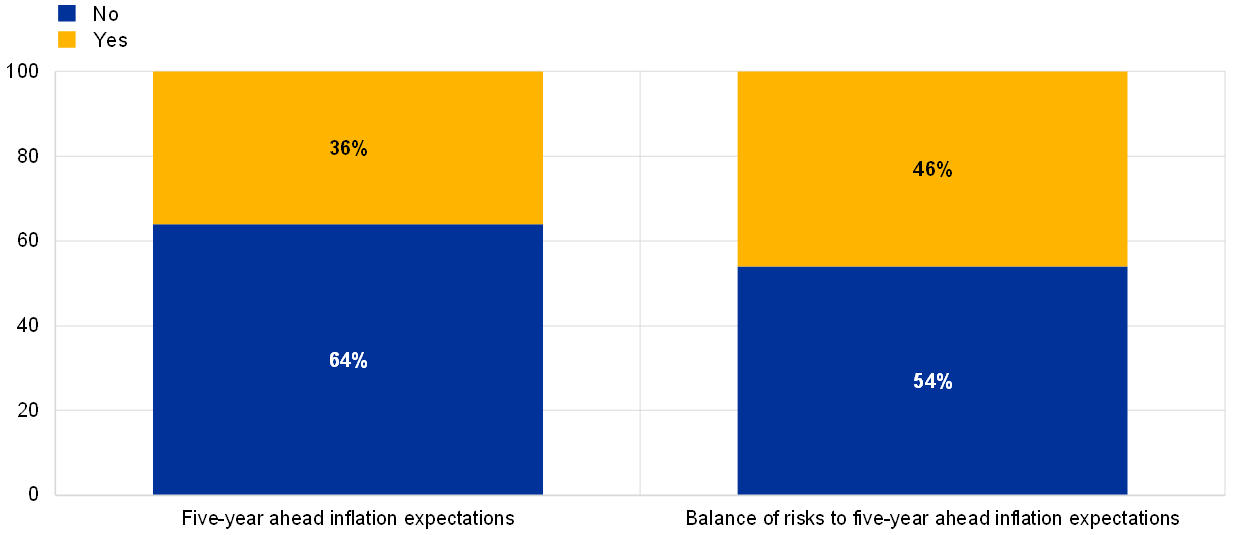
Note: 50 responses to both questions.
Chart 8
Revisions of five-year ahead inflation expectations in response to the new monetary policy strategy
(percentages of responses)
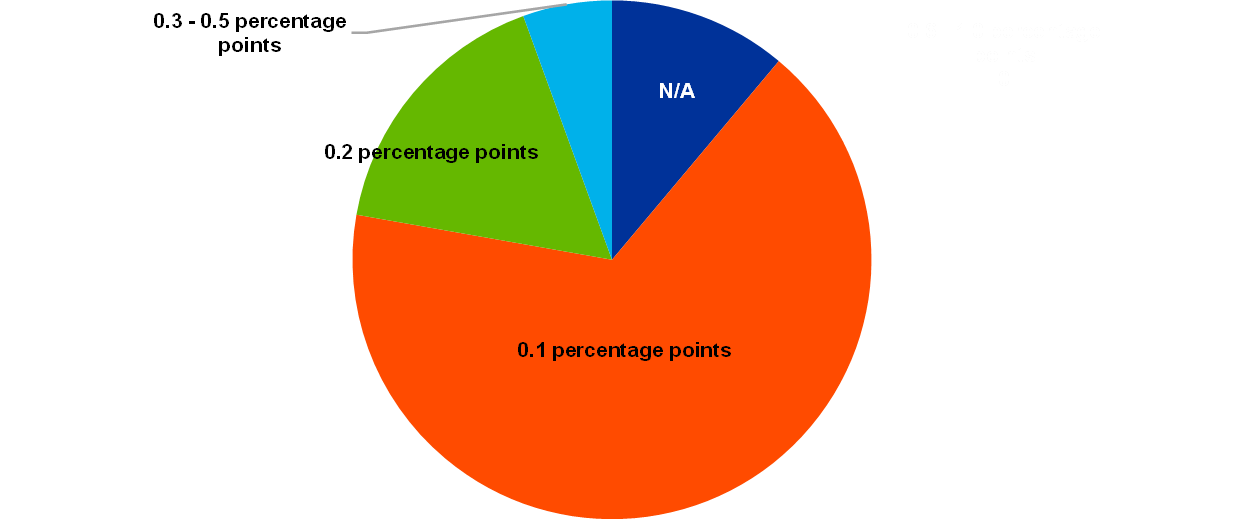
Note: 18 responses.
Relative to their point expectations, more respondents (nearly half) indicated that they had changed their assessment of the balance of risks to their five-year ahead inflation expectations (see Chart 7). Almost one-half of respondents (46%) said the new monetary policy strategy had changed their view of the balance of risks to their five-year ahead inflation expectations, with the vast majority (96%) saying this change was to the upside. In their qualitative comments, some respondents noted that the upward revision to the balance of risks essentially meant that they were now less to the downside (the question focused on the change in the assessment of the balance of risks and not the level of risk per se).
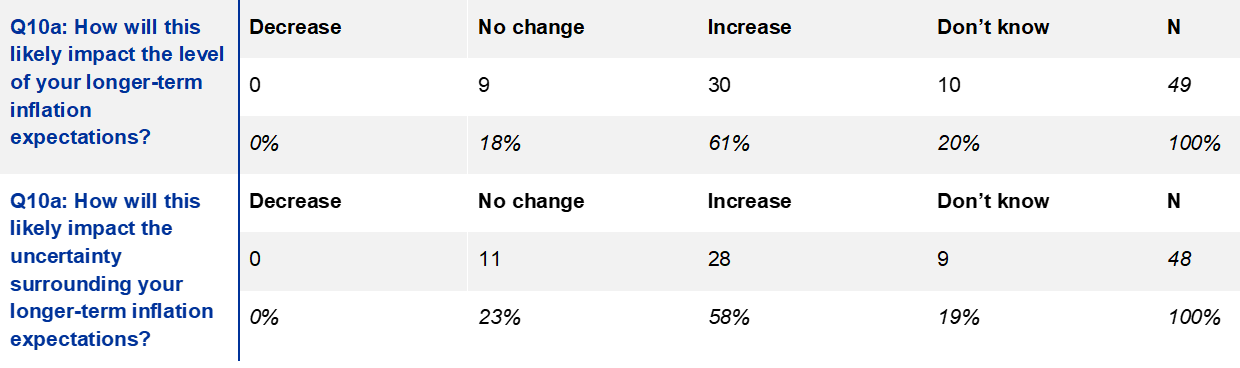
Respondents indicated that the eventual inclusion of owner-occupied housing in the HICP would likely increase their longer-term inflation expectations as well as the degree of uncertainty surrounding them. Questions 10a and 10b asked “When the criterion (i.e. with high quality, monthly frequency and sufficient timeliness) for the fourth stage of the roadmap for including owner-occupied housing in the HICP is satisfied: (a) how will this likely impact the level of your longer-term inflation expectations? and (b) how will this likely impact the uncertainty surrounding your longer-term inflation expectations?”. The responses to the two parts of this question were broadly similar, with approximately the same portion (61% and 58% respectively) indicating an increase in the level of their longer-term inflation expectations and in the uncertainty surrounding them – see Chart 9. Around one-fifth of respondents indicated no change, while another fifth said that they did not know.
Chart 9
When the criterion for the fourth stage of the roadmap for including owner-occupied housing in the HICP is satisfied, how will this likely impact the following aspects?
(percentages of responses)
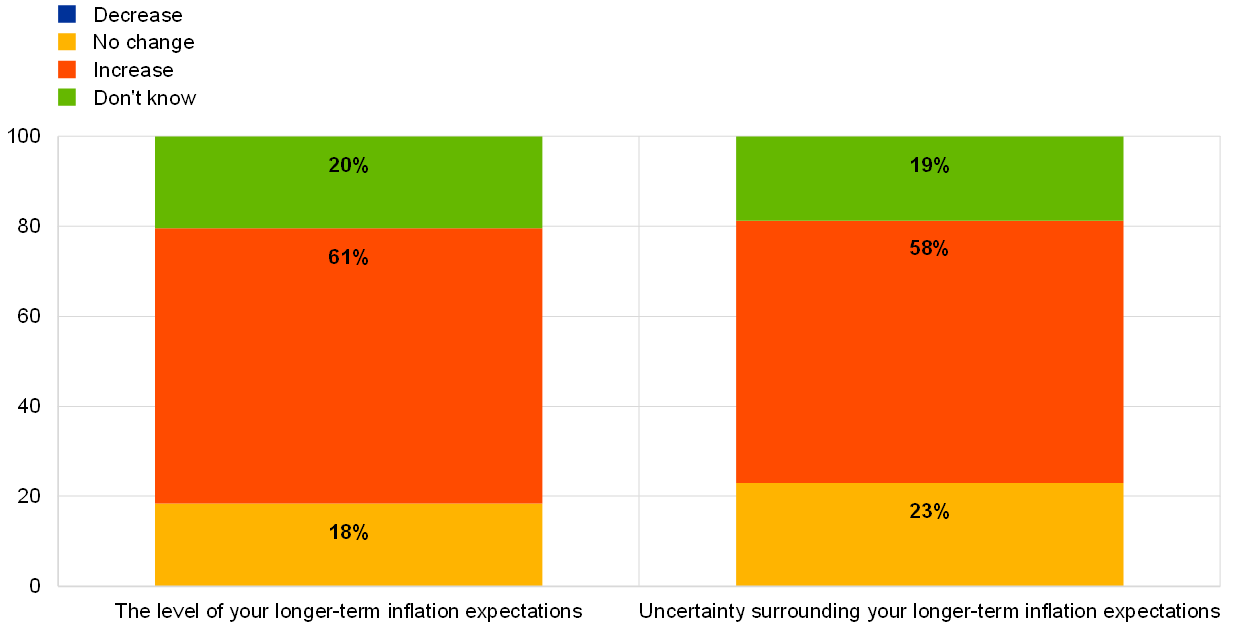
Note: 49 and 48 responses respectively.
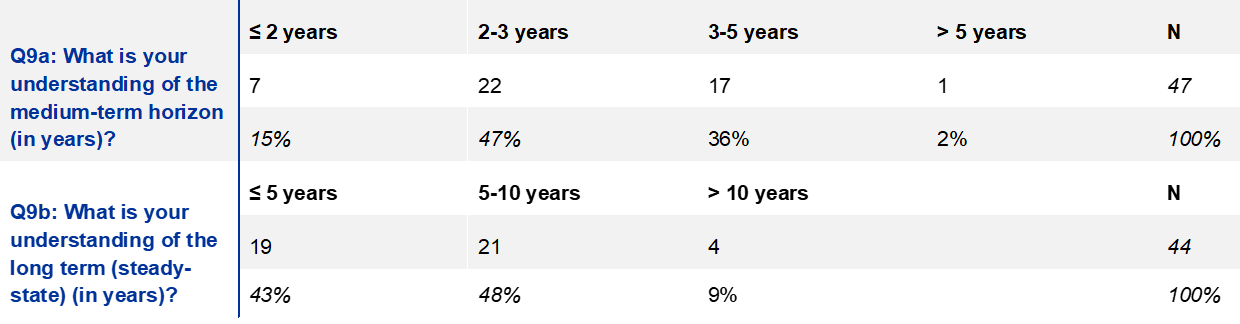
The modal understanding of the medium-term horizon was two to three years ahead, while the modal answer for the long term (or steady-state) was five to ten years ahead. In Questions 9a and 9b respondents were asked for their understanding of the “medium-term horizon” and of the “long term (steady-state)”. Respondents were asked to provide their answers in terms of years, with no other guidance or direction. Although there were a wide range of answers, it was possible to bunch them into a number of categories. For the medium-term horizon, the modal response was two to three years ahead, with 47% of responses – see Chart 10. A noteworthy portion (36%) indicated three to five years ahead. An approximate weighted average of the various categories would suggest a mean response of slightly more than three years. In their qualitative comments, some respondents noted a degree of “state-dependency” on the stage of the business cycle and the nature of shocks being faced. For the understanding of the long term (steady-state), the modal answer (48%) was five to ten years, although a considerable portion (43%) reported up to five years – see Chart 11. A smaller portion (9%) reported more than ten years. Overall, the responses suggest a horizon of slightly less than five years to ten years. Among the qualitative comments, some respondents again noted possible “state-dependency” or said that forecasts were not made for specific actions over that horizon.
Chart 10
Understanding of the medium-term horizon
(percentages of responses)
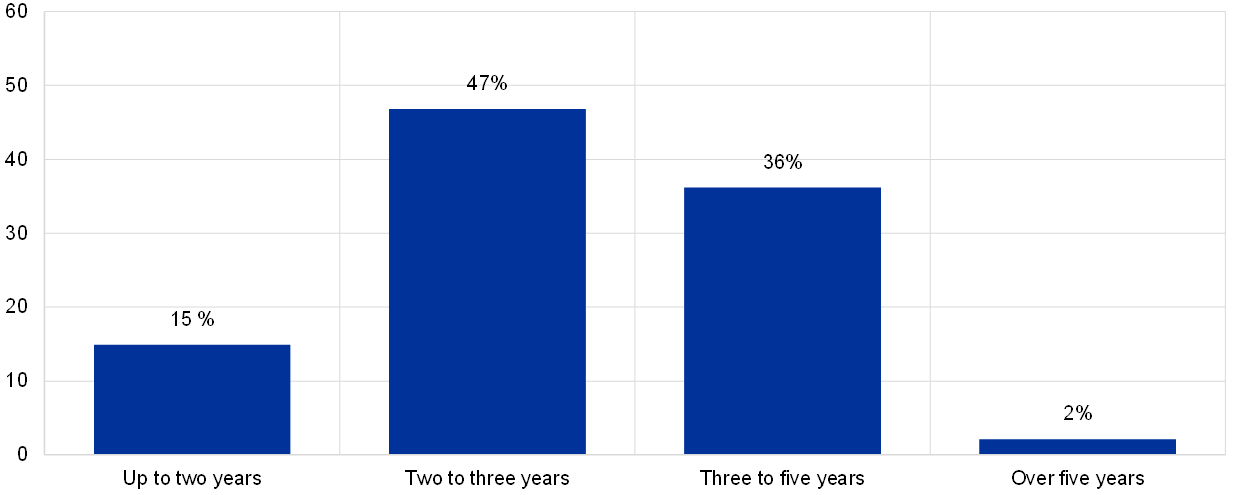
Note: 47 responses.
Chart 11
Understanding of the long term (steady-state)
(percentages of responses)
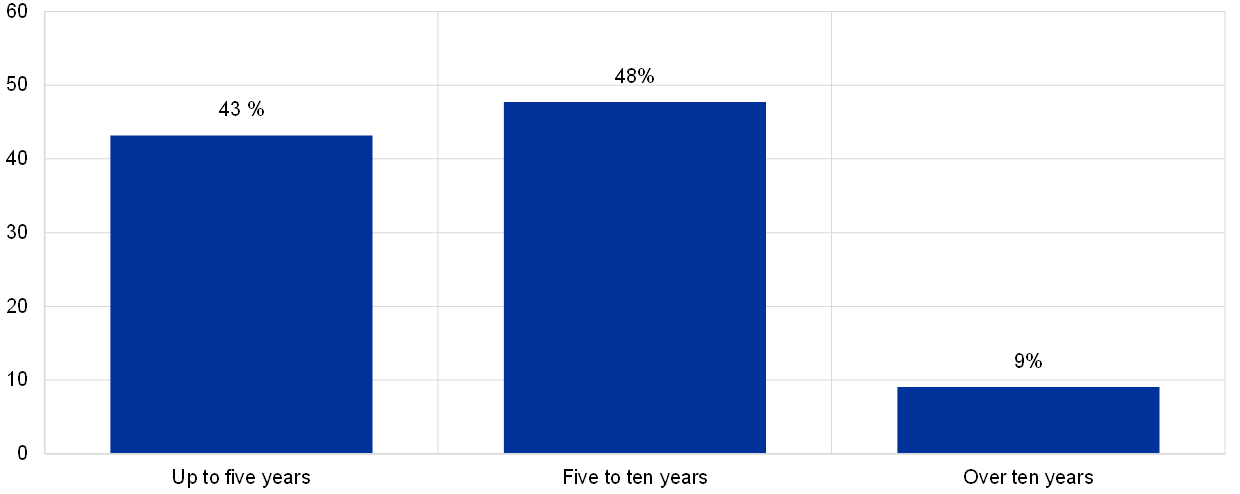
Note: 44 responses.
Annex - Survey questionnaire and responses
Table A1
Survey questionnaire
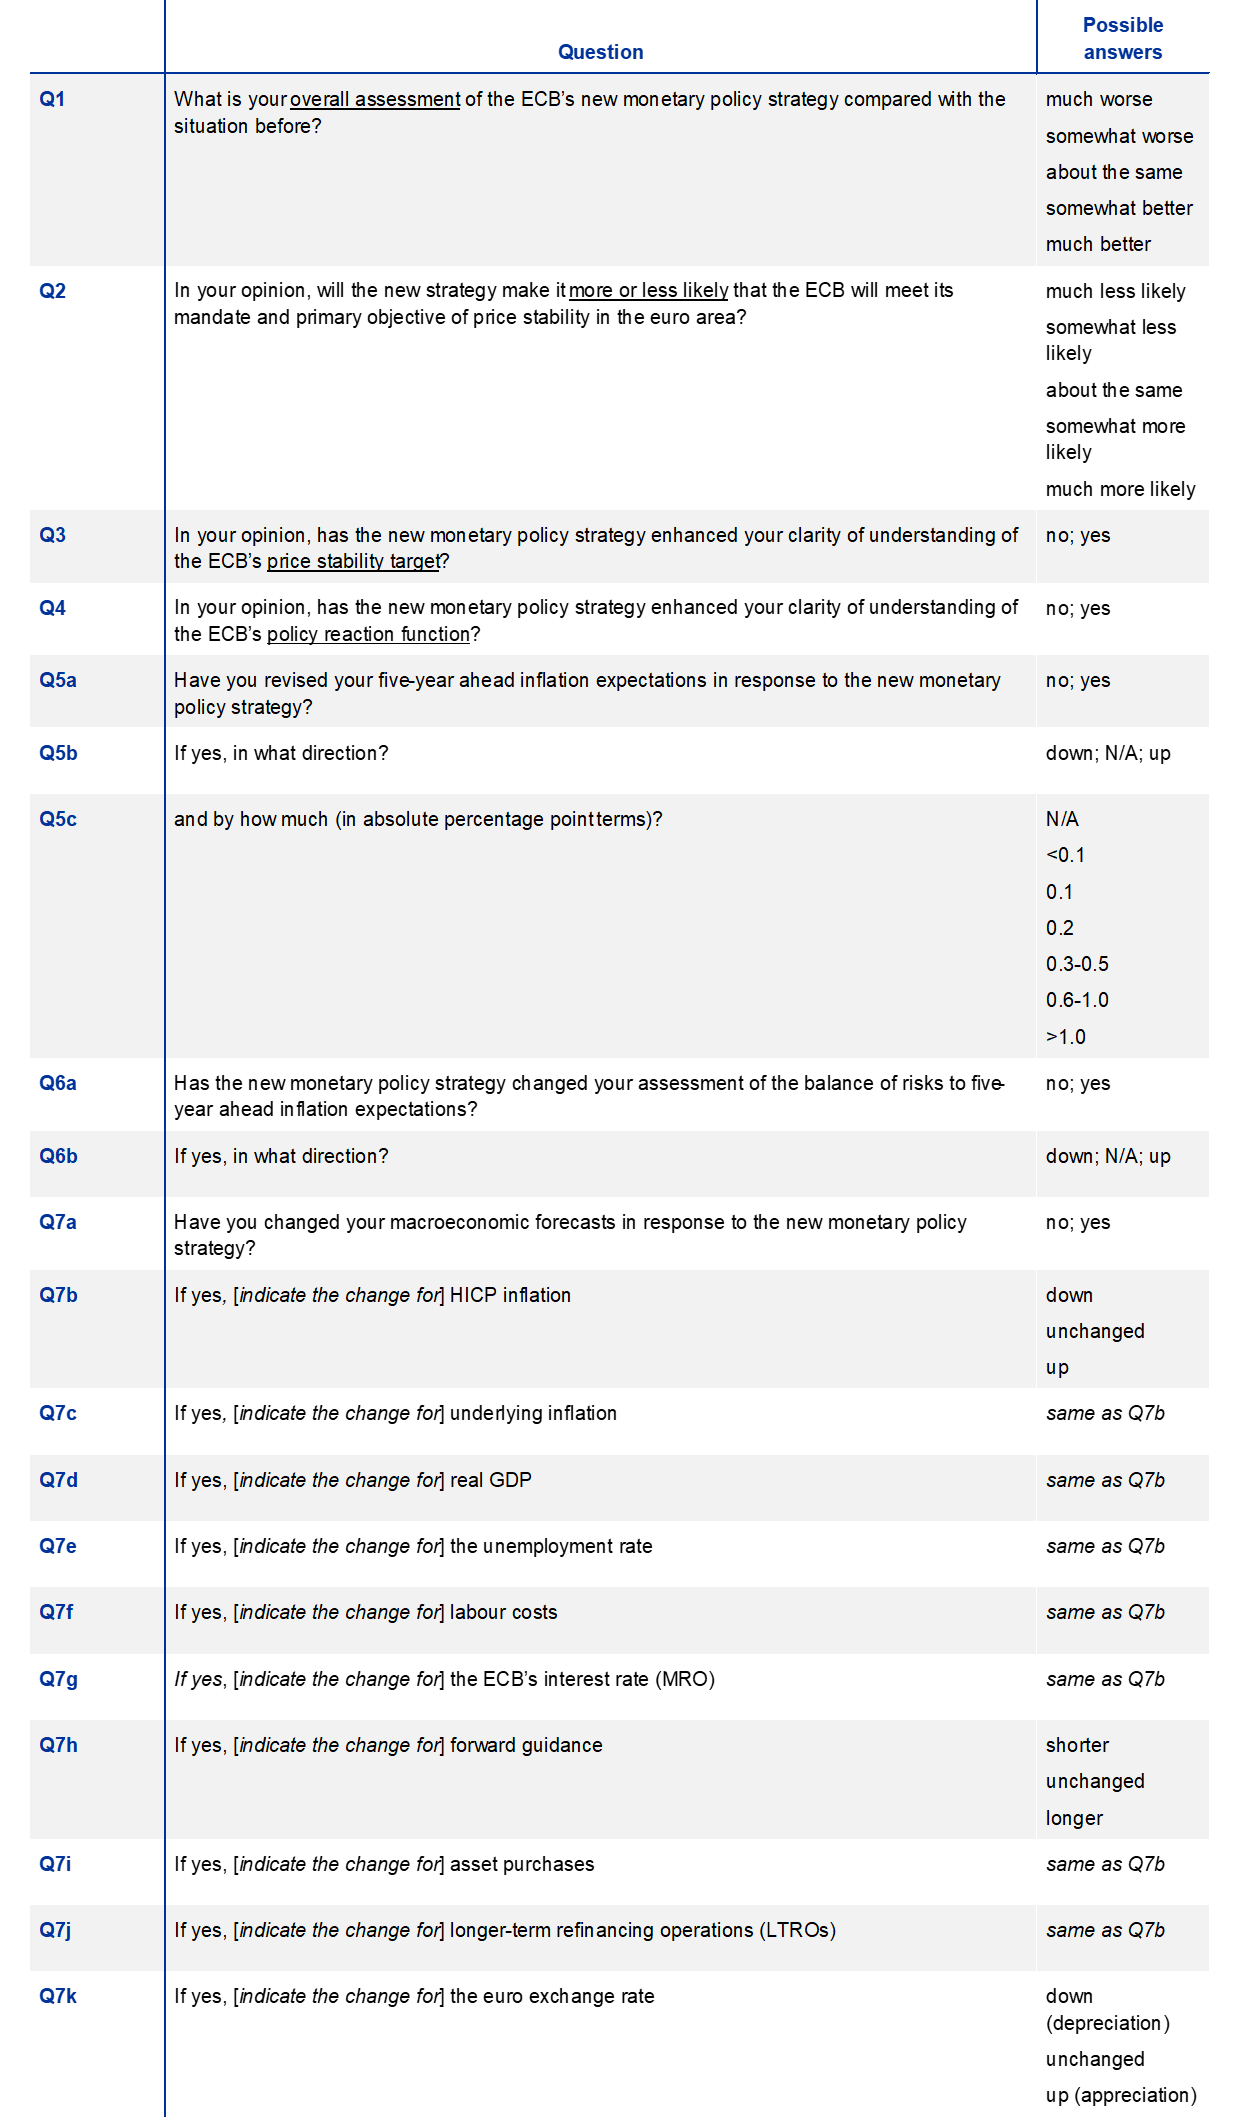
Note: for questions 7b-7k the same question was asked for four horizons: (i) up to one year ahead, (ii) one to two years ahead, (iii) three to four years ahead and (iv) five or more years ahead.
Table A2
Summary of responses to Questions 1-6
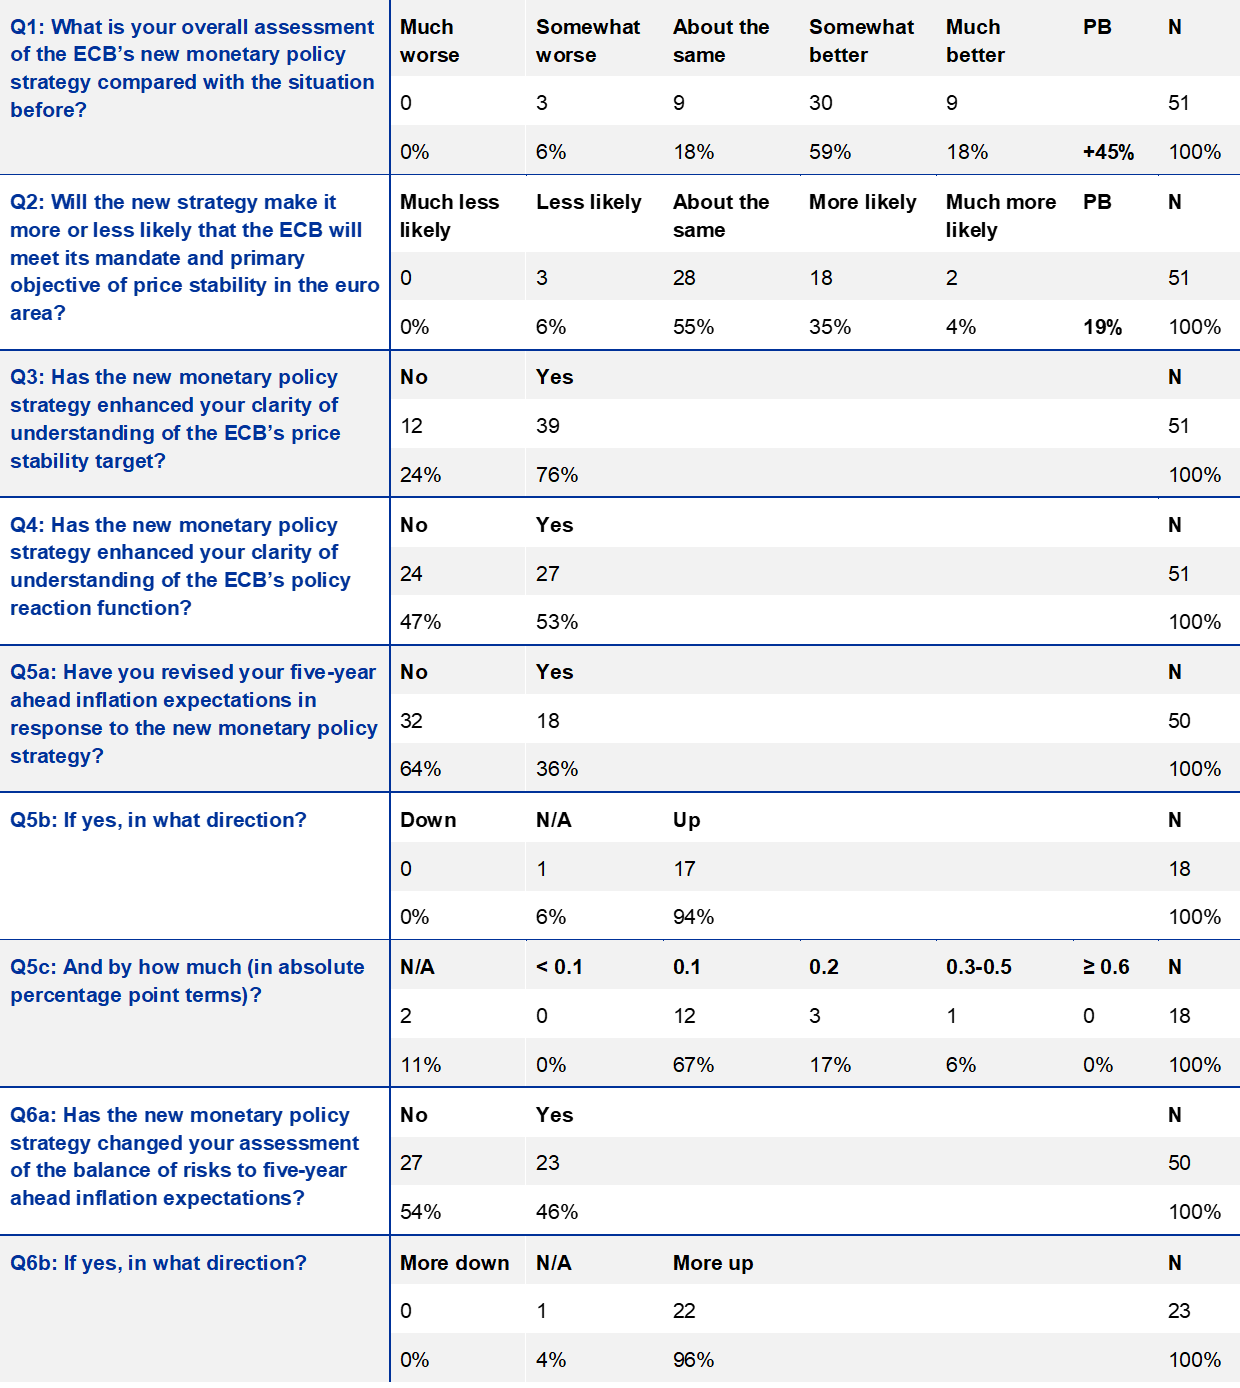
Notes: PB: percentage balance; N: number of respondents. The percentage balance is calculated as e + (d/2) - (b/2) - a (where, for example, e = much better, d = somewhat better, b = somewhat worse and a = much worse).
Summary of responses to Question 7
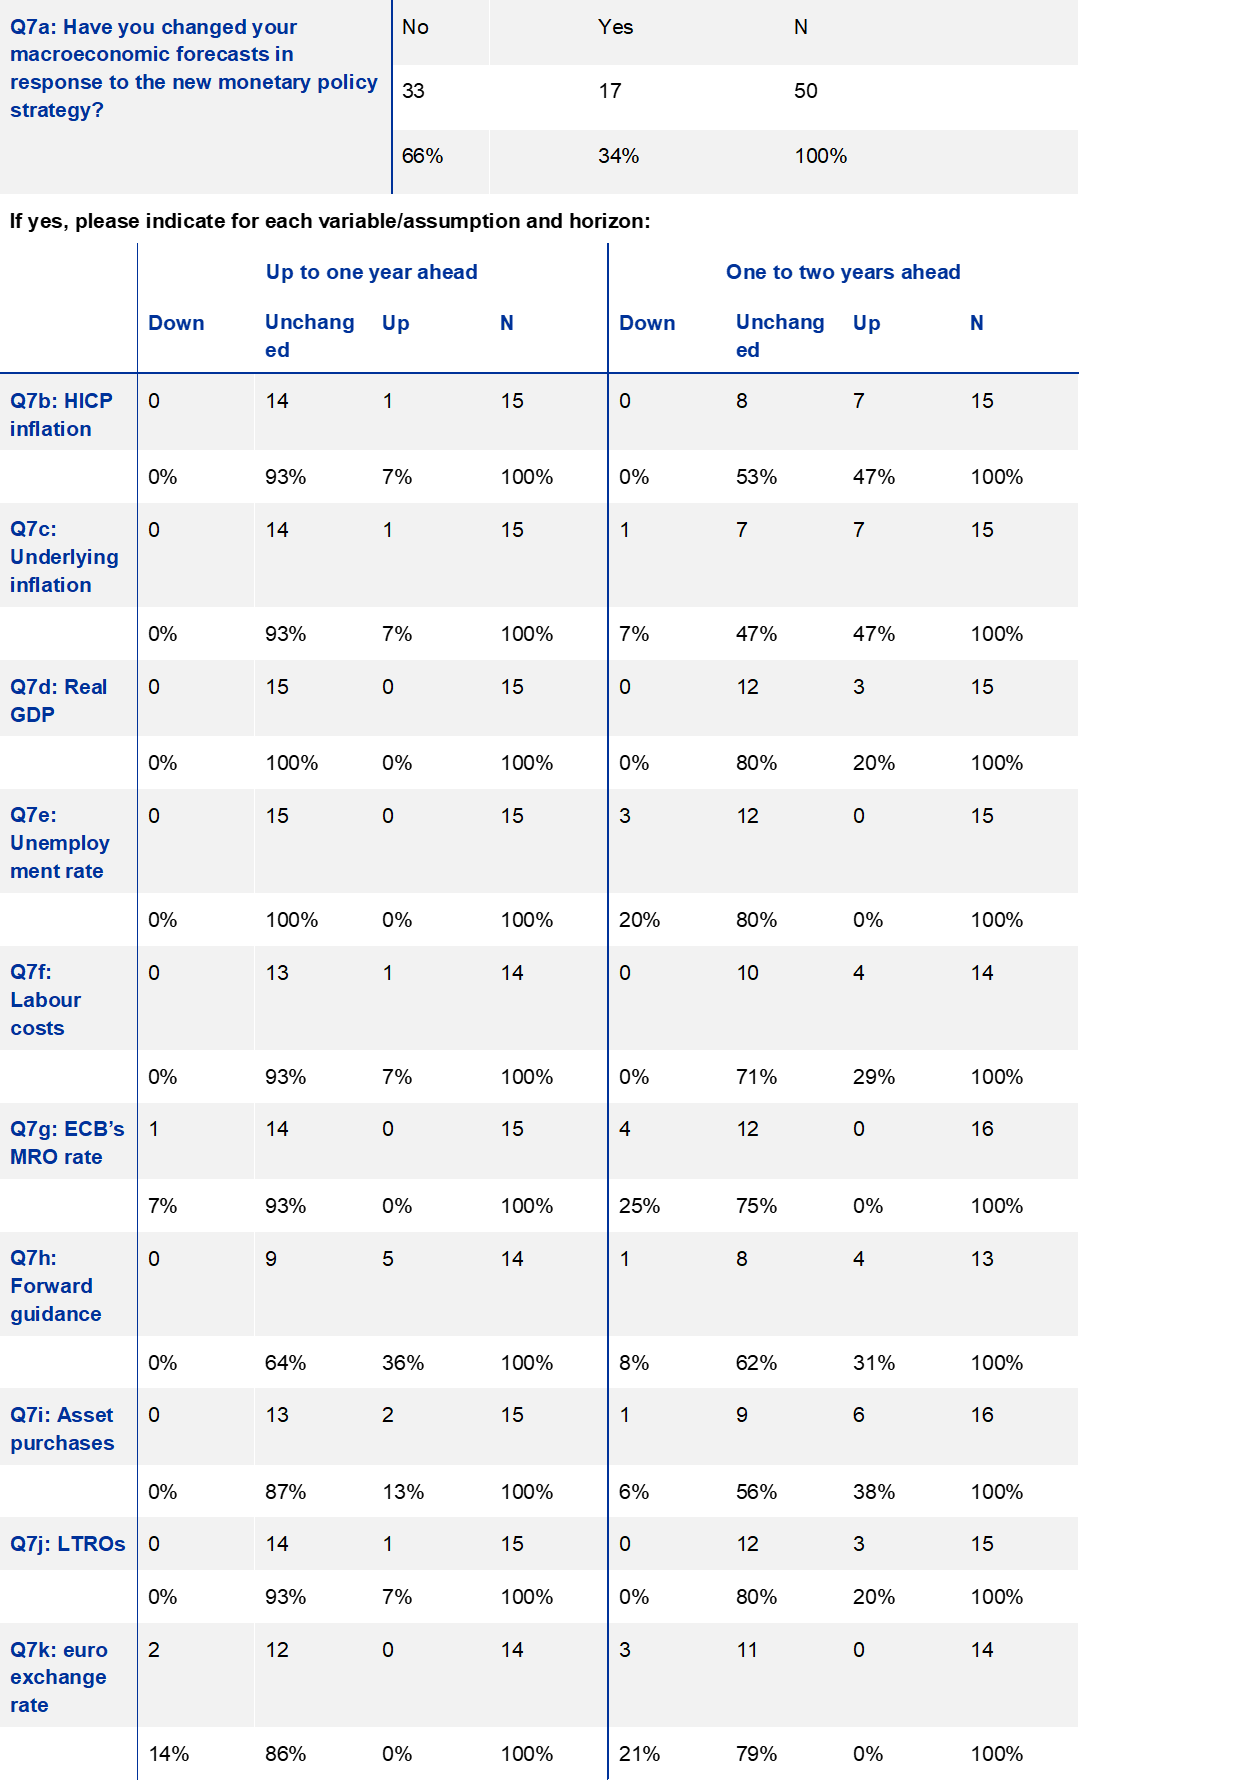
Note: For Question 7h (forward guidance) the possible answers are “shorter” (represented by “down”), “unchanged” and “longer” (represented by “up”); for Question 7k “down” represents depreciation and “up” appreciation.
Notes: N: number of respondents.
Summary of responses to Question 8
Notes: PB: percentage balance; N: number of respondents.
Summary of responses to Question 9
Notes: N denotes number of respondents
Summary of responses to Question 10 “When the criterion (i.e. with high quality, monthly frequency and sufficient timeliness) for the fourth stage of the roadmap for including owner-occupied housing in the HICP is satisfied”
Notes: N denotes number of respondents
© European Central Bank, 2021
Postal address 60640 Frankfurt am Main, Germany
Telephone +49 69 1344 0
Website www.ecb.europa.eu
All rights reserved. Reproduction for educational and non-commercial purposes is permitted provided that the source is acknowledged.
For specific terminology please refer to the ECB glossary (available in English only).
PDF ISSN 2363-3670
HTML ISSN 2363-3670
- This represents an average of just over seven qualitative comments per respondent who provided a qualitative comment. The median number of qualitative comments provided was five, with a minimum of one and a maximum of 23.
- The net percentage balance is a summary statistic frequently used with survey data where answers follow a format such as up/down, better/worse. For this question the net percentage is calculated as (a) the portion of respondents saying “much better” plus half the portion saying “somewhat better” minus (b) half the portion saying “somewhat worse” plus the portion saying “much worse”. The score is bounded in the range ±100%, with +100% meaning all respondents said “much better” and -100% meaning all respondents said “much worse”. A positive (negative) net percentage balance would generally indicate that more respondents felt the situation was better (worse).
- The other respondent did not provide an answer to the directional question. Respondents were offered the option of responding that they had revised down their expectations, but none indicated this.