
The ECB Survey of Professional Forecasters (SPF) - Second quarter of 2019
Summary
The results of the ECB Survey of Professional Forecasters (SPF) for the second quarter of 2019 show further downward revisions to inflation and real GDP growth expectations.[1] HICP inflation expectations stood at 1.4%, 1.5% and 1.6% for 2019, 2020 and 2021, respectively. Longer-term inflation expectations were stable at 1.8%. Real GDP growth expectations stood at 1.2%, 1.4% and 1.4% for 2019, 2020 and 2021, respectively. Expectations for real GDP growth in the longer term were revised down to 1.4%. Unemployment rate expectations were broadly unchanged and continued to point to further falls towards a longer-term rate of 7.4%.
Table 1
Results of the SPF in comparison with other expectations and projections
(annual percentage changes, unless otherwise indicated)
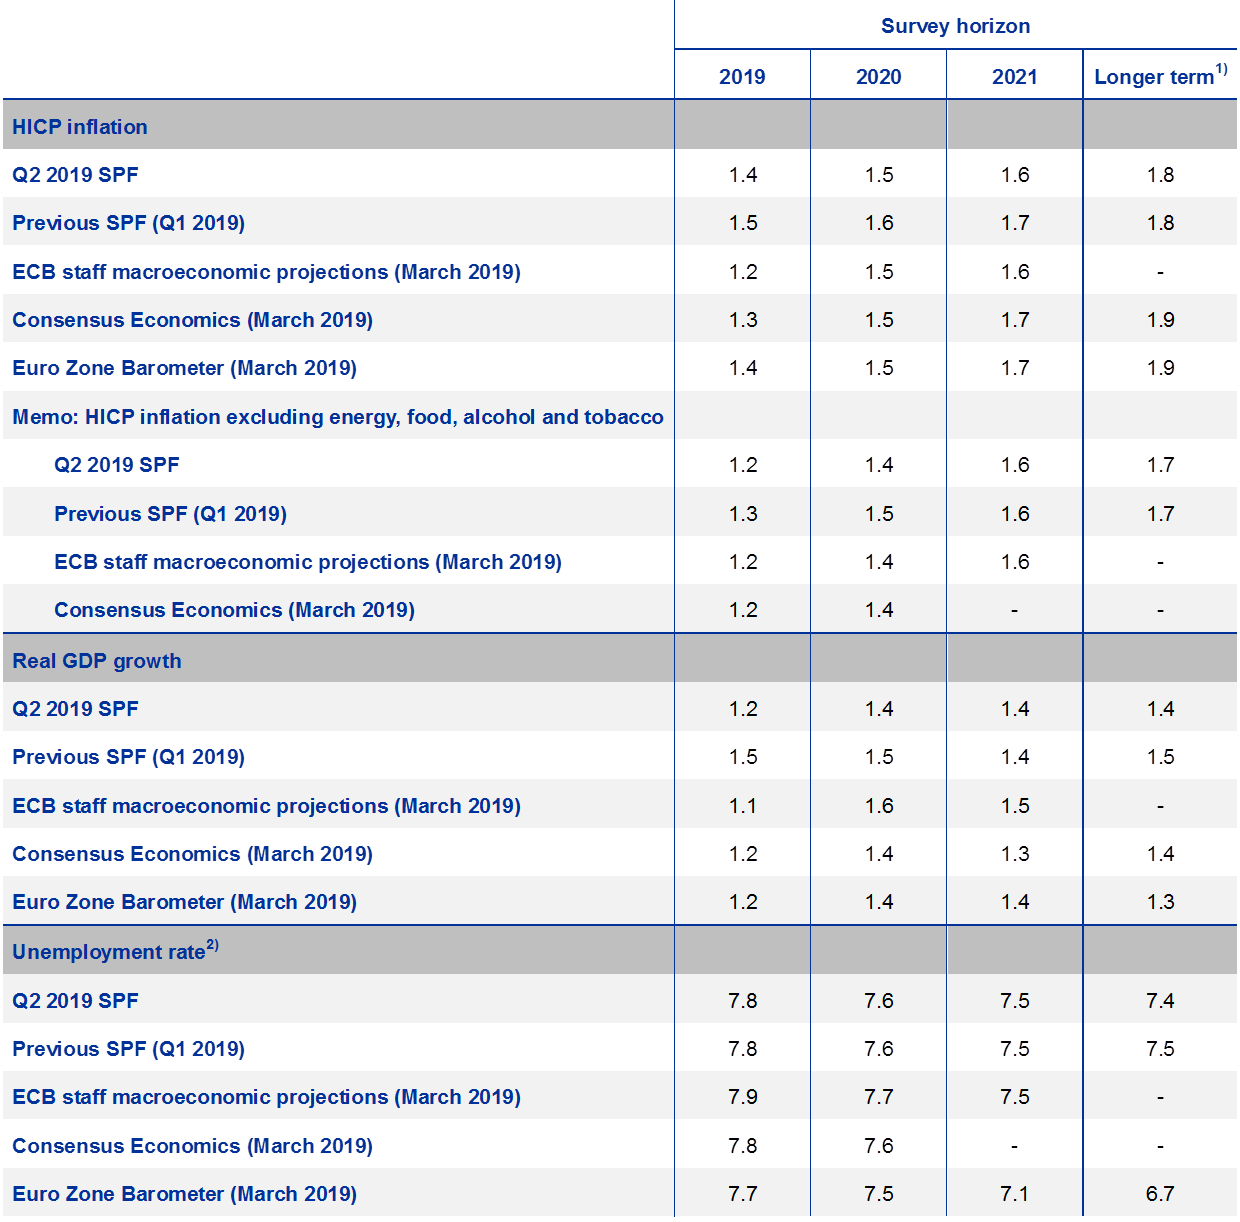
1) Long-term expectations refer to 2023. The forecasts of Consensus Economics and Eurozone Barometer for 2021 and the longer term are taken from the January 2019 surveys.
2) As a percentage of the labour force.
1 Inflation expectations for the period 2019-21 revised down
The results for the second quarter of 2019 show average HICP inflation expectations of 1.4%, 1.5% and 1.6% for 2019, 2020 and 2021, respectively (see Chart 1). Relative to the previous survey, this represents downward revisions of 0.1 percentage points (p.p.) for each of those years. In their qualitative comments, many forecasters identified the weaker growth outlook (see Section 3) as well as downward surprises to their forecasts for inflation in January and February as factors driving their downward inflation revisions, despite the higher oil price. The latest SPF results for inflation in 2019 and 2020 are comparable with the expectations reported in other surveys (see Table 1).
Average expectations for inflation excluding energy, food, alcohol and tobacco (HICPX) stood at 1.2%, 1.4% and 1.6% for 2019, 2020 and 2021, respectively. This represents downward revisions of 0.1 p.p. for both 2019 and 2020, but no change for 2021. However, when calculated using the unrounded results, the downward revisions are of a similar magnitude for all three years (see Chart 1).
Chart 1
Inflation expectations: overall HICP and HICP excluding energy, food, alcohol and tobacco
(annual percentage changes)

The reported probability distributions continued to indicate relatively high uncertainty around expected inflation in two years’ time. The width of the forward-looking probability distributions indicates the perceived degree of overall uncertainty, whereas the asymmetry of the distributions indicates whether that uncertainty is more concentrated on higher or lower outturns, i.e. it measures the perceived balance of risks. In addition, the aggregate probability distributions shifted to the left, mirroring the reductions in the point forecasts (see Chart 2). In general, forecasters’ probability distributions remained wide by historical standards, suggesting that uncertainty about future inflation outcomes at this horizon remained elevated. The balance of risks remained skewed towards the downside, though to a much lesser extent than seen over the period 2016-17. As in other recent survey rounds, respondents’ qualitative comments also tended to cite downside risks, which were mainly seen as stemming from the downside risks to economic growth.
Chart 2
Aggregate expected probability distributions for inflation in 2019, 2020 and 2021
(x-axis: HICP inflation expectations, annual percentage changes; y-axis: probability, percentages)


Note: The SPF asks respondents to report their point forecasts and to separately assign probabilities to different ranges of outcomes. This chart shows the average probabilities they assigned to inflation outcomes in 2019, 2020 and 2021.
2 Longer-term inflation expectations unchanged at 1.8%
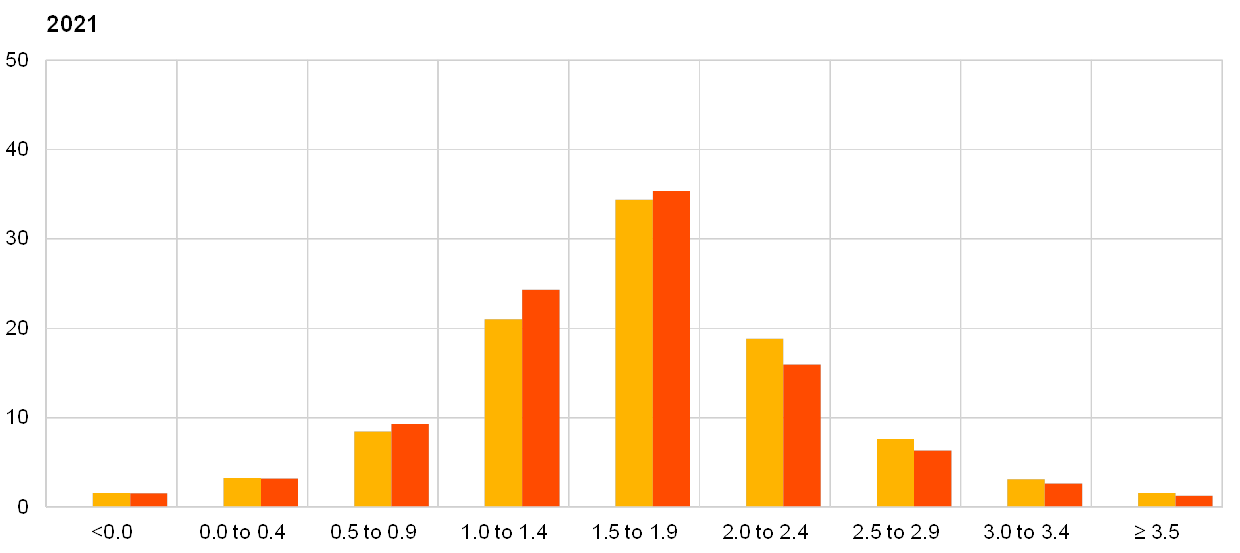
The average point forecast for inflation in the longer term (2023) was unchanged at 1.8%. Other summary statistics also pointed to stable longer-term inflation expectations: the median point forecast and the mean of the aggregate probability distribution were both unchanged, at 1.8% and 1.7%, respectively (see Chart 3). Compared with the previous survey, the proportion of respondents reporting a longer-term point forecast of 1.8% increased, while the proportion reporting a longer-term point forecast of 1.7% decreased (see Chart 4). Nevertheless, relative to the survey for the fourth quarter of 2018 and earlier, the overall cross-section of individual point forecasts remained disperse, indicating an elevated degree of disagreement amongst professional forecasters regarding the most likely outcome. Longer-term expectations for HICP inflation excluding energy, food, alcohol and tobacco were also unchanged, at 1.7%.
Chart 3
Longer-term inflation expectations
(annual percentage changes)

Chart 4
Distribution of point expectations for HICP inflation in the longer term
(x-axis: HICP longer-term inflation expectations, annual percentage changes; y-axis: percentages of respondents)

Notes: The SPF asks respondents to report their point forecasts and to separately assign probabilities to different ranges of outcomes. This chart shows the spread of point forecast responses
As with shorter-term inflation expectations, perceptions of overall uncertainty remained high, with the balance of risks remaining to the downside. Although the width of forecasters’ probability distributions for inflation in the longer term narrowed slightly, it remained high, indicating elevated uncertainty. Mirroring the pattern for two-year inflation expectations, the balance of risks remained to the downside (see Chart 5), but to a lesser extent than seen over the period 2016-17. This result is part of a more general picture seen in recent years, with the longer-term balance of risks remaining tilted towards more adverse economic outcomes across all main survey variables, i.e. towards slower growth, higher unemployment and lower inflation.
Chart 5
Aggregate probability distribution of longer-term inflation expectations
(x-axis: HICP inflation expectations, annual percentage changes; y-axis: probability, percentages)
Notes: The SPF asks respondents to report their point forecasts and to separately assign probabilities to different ranges of outcomes. This chart shows the average probabilities they assigned to inflation outcomes in the longer term.
3 Real GDP growth expectations revised down
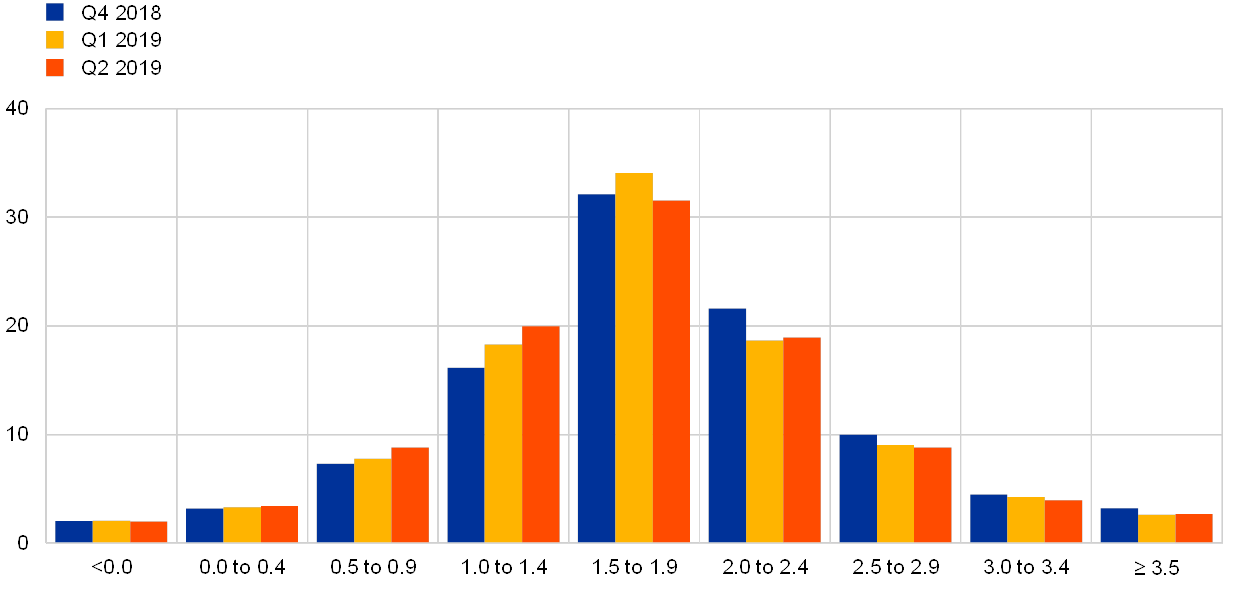
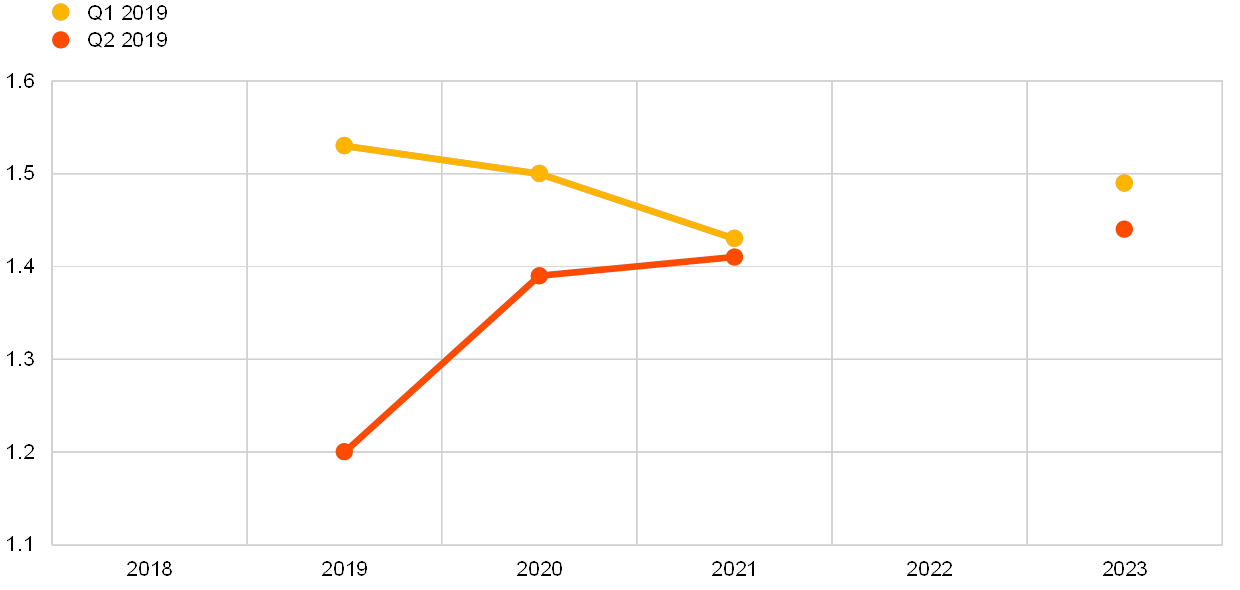
Expectations for real GDP growth stood at 1.2%, 1.4% and 1.4% for 2019, 2020 and 2021, respectively (see Chart 6). That implies downward revisions of 0.3 p.p. and 0.1 p.p. for 2019 and 2020, respectively. Longer-term growth expectations were also revised down by 0.1 p.p. to 1.4%. Respondents largely attributed their revisions for 2019 to the weaker than expected outturns in the second half of 2018, implying less economic momentum to carry over into 2019, and to lower foreign demand weighing on trade and investment. While many forecasters considered the current slowdown to be driven by predominantly temporary special factors, with a rebound expected during 2019, there was an emerging view amongst some respondents that the euro area economy is entering a later stage of the business cycle, such that growth is likely to remain lower. The latest SPF results for 2019 and 2020 are broadly comparable with those published in other surveys (see Table 1). In line with the downward revisions to point forecasts, the probability distributions surrounding them shifted towards lower values, such that the highest probabilities were assigned to GDP growth outcomes in the range between 1.0% and 1.4% (see Chart 7 and Chart 8).
Chart 6
Expectations for real GDP growth
(annual percentage changes)
Respondents considered the current level of uncertainty to be very high and to be having an economic impact, mainly via companies’ investment decisions. In this survey round, respondents were invited to elaborate on their view of economic uncertainty over the next year, on what the key uncertainty factors are and via which channels these could affect real economic growth in the euro area. Most respondents who commented on uncertainty judged that it is first and foremost impacting companies’ investment decisions, with increased uncertainty leading them to postpone or even cut back their plans. Indeed, some respondents already considered the elevated uncertainty as a reason for the weakness already visible in the data on manufacturing orders and exports. High uncertainty was also thought to be affecting households’ consumption and saving decisions, and may have driven the recently rather high saving ratio and low consumption of durable goods and registrations of new cars (which had been expected to normalise more following the resolution of the issues related to emissions testing). Finally, given the tightness of the labour market, only a few respondents mentioned that increased uncertainty may affect companies’ hiring decisions.
Risks to the forecasts for real GDP growth remained to the downside. The balance of risks, as measured by the asymmetry of the forecast distributions, was broadly unchanged in this survey at all horizons. This is consistent with the broader trend observed over the past years of a gradual normalisation from the strong downside risks recorded in 2016. In respondents’ qualitative comments, the most cited downside risk was the potential impact of a hard Brexit. In addition, many respondents continued to refer to a further escalation of the trade conflict between the United States and China, and the apparent slowdown in China turning out stronger than expected, spilling over to other emerging economies. Very few forecasters mentioned upside risks. On the domestic side, some respondents saw a risk that the European automotive industry might not recover from the recent slowdown as fully as envisaged in their baseline forecasts.
Chart 7
Aggregate probability distributions for GDP growth expectations for 2019, 2020 and 2021
(x-axis: real GDP growth expectations, annual percentage changes; y-axis: probability, percentages)


Notes: The SPF asks respondents to report their point forecasts and to separately assign probabilities to different ranges of outcomes. This chart shows the average probabilities they assigned to real GDP growth outcomes in 2019, 2020 and 2021.
Chart 8
Aggregate probability distribution for longer-term GDP growth expectations
(x-axis: real GDP growth expectations, annual percentage changes; y-axis: probability, percentages)

Note: The SPF asks respondents to report their point forecasts and to separately assign probabilities to different ranges of outcomes. This chart shows the average probabilities they assigned to real GDP growth outcomes in the longer term.
4 Unemployment rate expectations broadly unchanged
The average point forecasts for the unemployment rate for 2019, 2020 and 2021 were unchanged at 7.8%, 7.6% and 7.5%, respectively (see Chart 9). Thus, while inflation expectations were revised down together with the downward revisions to growth, consistent with a Phillips curve relationship, unemployment expectations were not. This might suggest that SPF respondents see the labour market as being particularly resilient at this point in time. Longer-term unemployment rate expectations also remained unchanged, at 7.5%.
Chart 9
Expectations for the unemployment rate
(percentages of the labour force)

The balance of risks remained to the upside, and longer-term unemployment rate expectations remained very uncertain. At all horizons, the probability distributions remained skewed towards higher unemployment rate outcomes, indicating that the balance of risks is to the upside (see Chart 10 and Chart 11). As with other variables (across horizons), forecasters’ uncertainty about the unemployment rate in the future, as measured by the width of their probability distributions, has been greater since the financial crisis than it was before. For longer-term unemployment rate expectations, the rise in uncertainty was particularly marked, and in the surveys for both the first and second quarter of 2019, this measure stood at levels significantly higher than those previously seen.
Chart 10
Aggregate probability distributions for the unemployment rate in 2019, 2020 and 2021
(x-axis: unemployment rate expectations, percentages of the labour force; y-axis: probability, percentages)
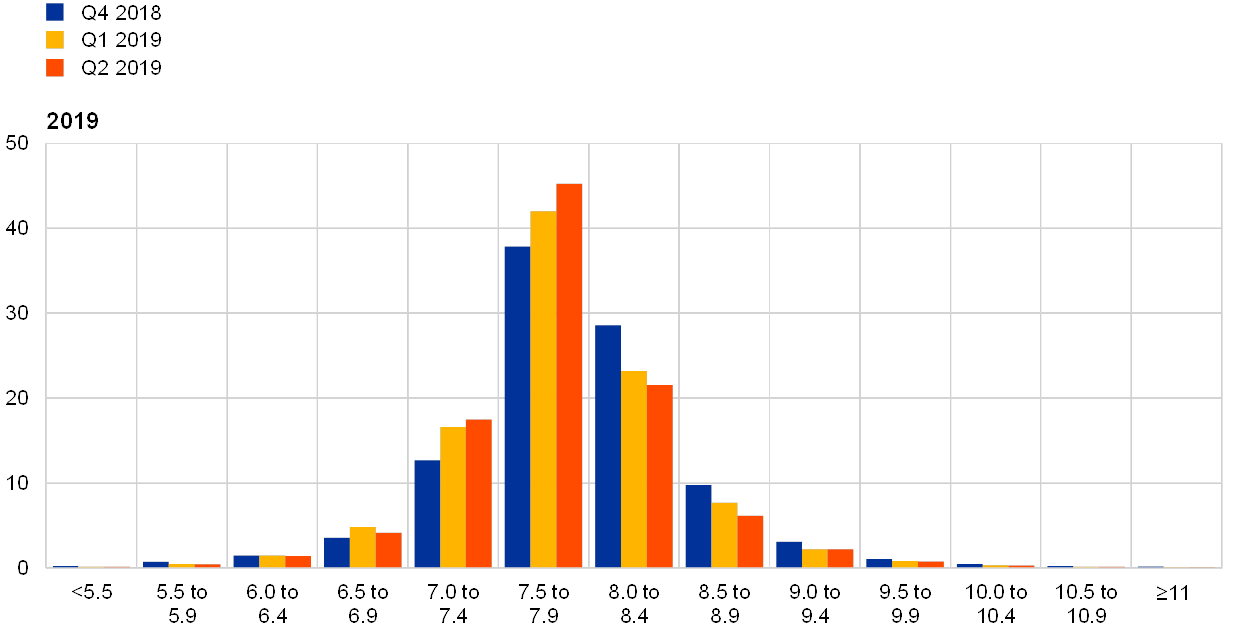


Notes: The SPF asks respondents to report their point forecasts and to separately assign probabilities to different ranges of outcomes. This chart shows the average probabilities they assigned to unemployment rate outcomes for 2019, 2020 and 2021.
Chart 11
Aggregate probability distribution for the unemployment rate in the longer term
(x-axis: unemployment rate expectations, percentages of the labour force; y-axis: probability, percentages)
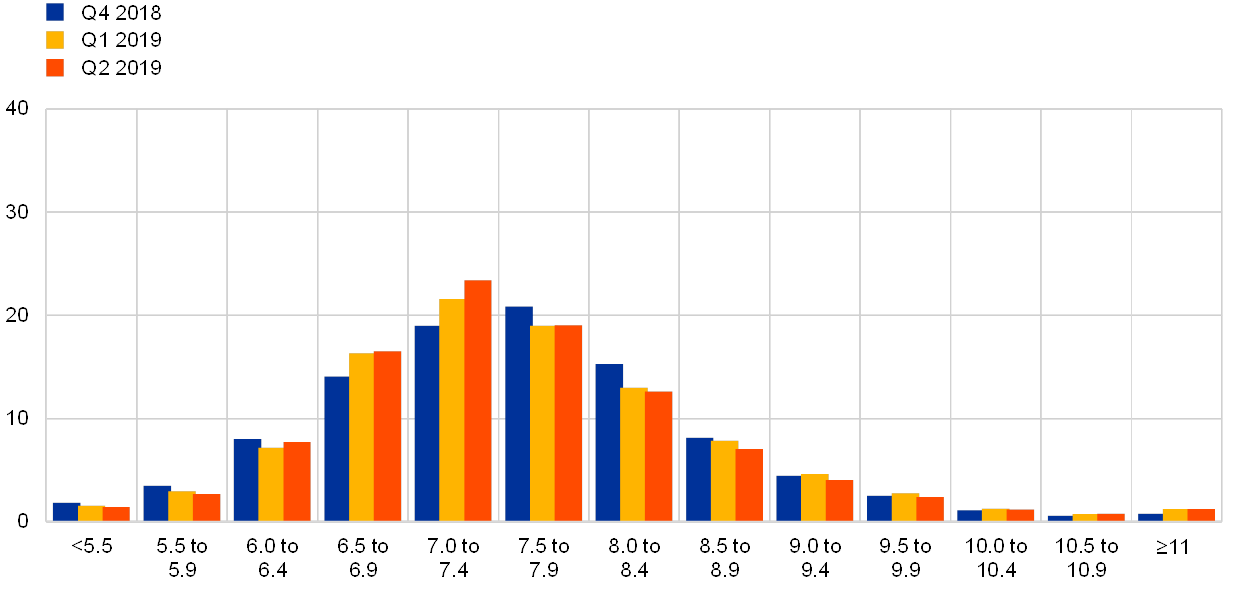
Notes: The SPF asks respondents to report their point forecasts and to separately assign probabilities to different ranges of outcomes. This chart shows the average probabilities they assigned to unemployment rate outcomes in the longer term.
5 Expectations for other variables
Respondents’ average expectations were for: the ECB’s main refinancing rate to stay at zero throughout 2019; the euro to continue appreciating against the US dollar until 2021; USD oil prices to remain broadly unchanged; and labour cost growth to increase slightly until 2021 and then start to slow.
The mean expectation for the rate on the ECB’s main refinancing operations was for it to remain around 0% in the near term, increasing a little to 0.13% in 2020 and then to 0.37% in 2021 (see panel (a) of Chart 12). Both the aggregate expectation for the near-term, quarterly profile and the expected policy rate in 2020 and 2021 were revised down from the previous round.
The average expected USD/EUR exchange rate decreased at all horizons compared to the previous round, but more so in the nearer term. Thus, relative to that lower starting point, the expected pace of future appreciation of the euro has decreased for the third quarter of 2019, while remaining broadly unchanged at all other horizons (see panel (b) in Chart 12).
US dollar-denominated oil prices (per barrel) were expected to average $65.5 for 2019, $65.1 for 2020 and $65.3 for 2021, thus remaining stable across all horizons. This implies that forecasters now expect prices to be between 1.3% and 2.7% higher at all horizons except the longer term than they had expected in the previous survey (see panel (c) of Chart 12). When combined with expectations of a slight weakening – between 0.9% and 2.3% - in the USD/EUR exchange rate, these results imply a profile for the oil price in euro that is around 3.0% higher relative to the previous survey.
On average, annual growth in compensation per employee was expected to be 2.3% for 2019. 2.3% for 2020, and 2.4% for 2021 and 2.3% for 2023, unchanged at all horizons except 2020 when compared with the previous survey (see panel (d) of Chart 12).
Chart 12
Expectations for other variables

6 Annex (chart data)
Excel data for all charts can be downloaded here.
© European Central Bank, 2019
Postal address 60640 Frankfurt am Main, Germany
Telephone +49 69 1344 0
Website www.ecb.europa.eu
All rights reserved. Reproduction for educational and non-commercial purposes is permitted provided that the source is acknowledged.
For specific terminology please refer to the ECB glossary (available in English only).
PDF ISSN 2363-3670, QB-BR-19-002-EN-N
HTML ISSN 2363-3670, QB-BR-19-002-EN-Q
- The survey was conducted between 18 and 22 March 2019; 58 responses were received. Participants were provided with a common set of the latest available data for annual HICP inflation (February 2019: all items, 1.5%; excluding energy, food, alcohol and tobacco, 1.0%), annual GDP growth (Q4 2018, 1.1%) and the unemployment rate (January 2019, 7.9%).
-
11 April 2019