
Assessing corporate vulnerabilities in the euro area
Published as part of the ECB Economic Bulletin, Issue 2/2022.
1 Introduction
The coronavirus (COVID-19) crisis was a major shock for the non-financial corporate (NFC) sector. The pandemic and the associated containment measures translated into a large drop in sales for firms. The rapid pace of the decline in revenue in conjunction with the difficultly of adjusting costs sufficiently quickly led to a sudden increase in liquidity needs. These liquidity needs, if left unaddressed, could have easily morphed into broader solvency issues, leading to a sharp increase in corporate defaults and bankruptcies.
The COVID-19 pandemic hit the services sector and small firms particularly hard. There is a high concentration of small businesses in contact-intensive sectors. This creates additional challenges when assessing the vulnerability of the euro area economy, as comprehensive information on the health of small companies’ balance sheets typically becomes available only with significant time lags. The information contained in the Survey on the Access to Finance of Enterprises in the euro area (SAFE) was particularly useful to fill, at least partially, the information gap.[1]
The timely and forceful policy response at national and EU level mitigated the short-term impact of the pandemic. Fiscal, monetary and supervisory measures have substantially supported corporates by preventing large corporate losses and a rise in non-performing loans for banks. Government support to firms helped to reduce their costs (for instance via job retention schemes) and provided liquidity support, while monetary policy helped to provide favourable financing conditions and supervisory policies freed up capital that banks could use for lending. The effect of these policy measures is also reflected in exceptionally low numbers of corporate insolvency cases over the past two years.
Two years after the onset of the pandemic, the short-term vulnerabilities of the corporate sector seem to have abated somewhat amid the ongoing recovery, but risks remain, especially for smaller firms and for sectors most affected by the pandemic. Corporate revenues recovered after some of the strictest containment measures were eased, thus also improving debt servicing capacity. At the same time, weaker corporate balance sheets and heterogenous indebtedness across firms pose risks to the recovery. Higher gross corporate debt, in particular for those firms that also face an increase in net debt, may hamper the capacity of firms to support the recovery via an increase in capital spending, especially once policy support is phased out. The higher debt ratios render firms vulnerable to potential shifts in risk sentiment, a rise in real interest rates or a fall in profits. Weaker corporate balance sheets also pose a risk for banks, potentially activating adverse feedback loops and financial stability concerns through increases in non-performing loans and corporate bankruptcies.
Aside from the COVID-19 pandemic, the corporate sector also faces broader structural challenges. The pandemic has accelerated several structural transformations already under way in the euro area economy. A non-exhaustive list of structural challenges includes new forms of work (including remote working), the use of e-commerce and digital technologies, a reconfiguration of global value chains and the transition to a carbon-neutral economy. Such changes require a comprehensive modernisation of firms’ capital stock, which may be harder for small and medium-sized enterprises (SMEs) to implement, partly owing to their pre-existing weaknesses compared with larger firms.
This article is structured as follows. Section 2 reviews recent developments, focusing on vulnerabilities stemming from corporate indebtedness. Section 3 looks at implications for corporate insolvencies, complemented by Box 1, which views this through the lens of bank asset quality. Section 4 looks at the possible investment implications of increased levels of corporate indebtedness. Box 2 discusses some structural features of euro area SMEs in the context of the COVID-19 pandemic. Section 5 concludes.
2 Recent developments in the non-financial corporate sector
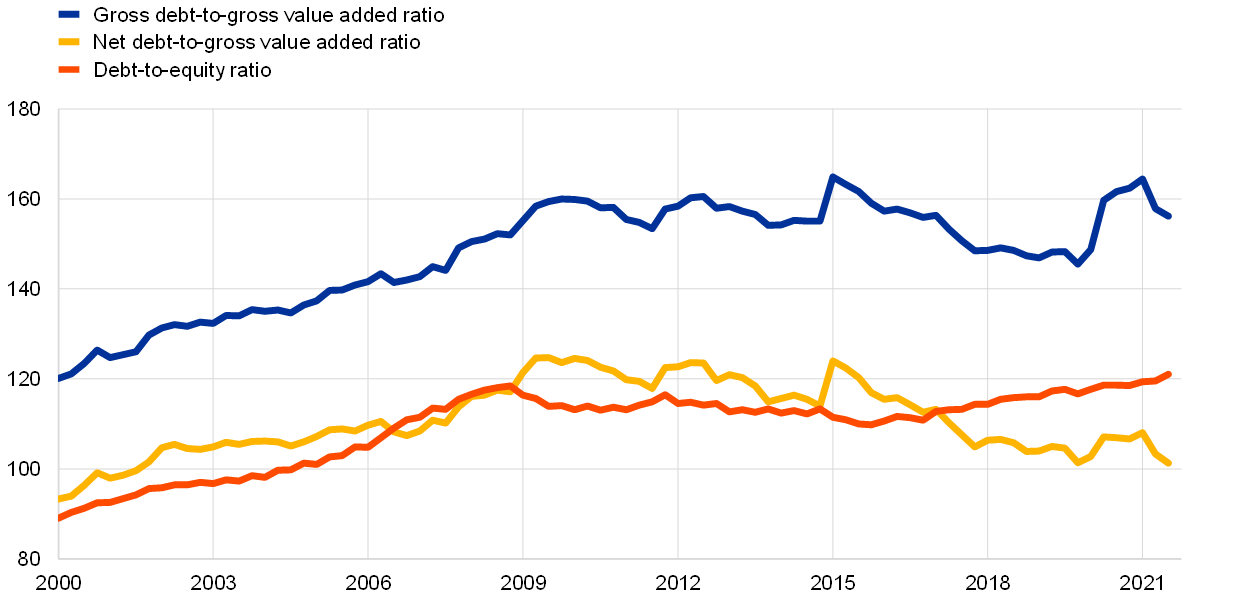
Euro area NFC sector gross indebtedness increased strongly during the pandemic. The NFC gross debt-to-value added ratio (debt ratio) increased by 18.8 percentage points between the end of 2019 and early 2021, to peak at 164.4%, only 0.5 percentage points lower than its record in early 2015 (Chart 1, panel a). This increase was explained almost equally by firms’ stronger recourse to debt financing and by the marked decline in gross value added. At the end of the third quarter of 2021, the debt ratio still stood 10.6 percentage points above its level at the end of 2019, which is almost entirely due to stronger recourse to debt financing rather than lower gross value added (Chart 1, panel b). The debt-to-equity ratio also increased significantly between the fourth quarter of 2019 and the third quarter of 2021, as the increase in debt was compensated only partly by greater equity issuance.
Chart 1
NFC debt and leverage in the euro area
a) Level of consolidated debt and leverage
(percentages)
b) Change in consolidated debt and leverage between the fourth quarter of 2019 and the third quarter of 2021
(percentage points, percentage point contributions)

Sources: Eurostat, ECB and ECB estimates.
Notes: Consolidated gross debt is defined as the sum of total loans granted to NFCs, debt securities issued and pension liabilities minus intra-sectoral lending. Consolidated net debt is defined as consolidated gross debt net of currency and deposit holdings. The debt-to-equity ratio is at book value, which is proxied by notional stocks. In panel b, in the first column the blue dot represents the change in the gross debt-to-gross value added ratio, in the second column it represents the change in the net-debt-to-gross value added ratio, and in the third column it represents the change in the debt-to-equity ratio. The latest observations are for the third quarter of 2021.
The increase in gross NFC debt has been accompanied by a strong accumulation of liquid assets, especially by large corporates. NFC deposits increased by €713 billion between the fourth quarter of 2019 and the third quarter of 2021. As a result, the net debt ratio increased much less than gross indebtedness, and in the third quarter of 2021 net debt stood 0.4 percentage points below its level at the end of 2019 (Chart 1, panel b).[2] During the early stages of the pandemic, firms parked a substantial part of the proceeds from new bank loans and debt securities issuance in deposits in order to pre-fund working capital needs and necessary investment, as well as to prepare for possible cash shortages due to the collapse of sales and operating cash flows. More recently, the improvements in profits and retained earnings have contributed to an increase in liquid asset holdings. These holdings can act as a mitigating factor for high corporate debt at an aggregate sectoral level.[3]
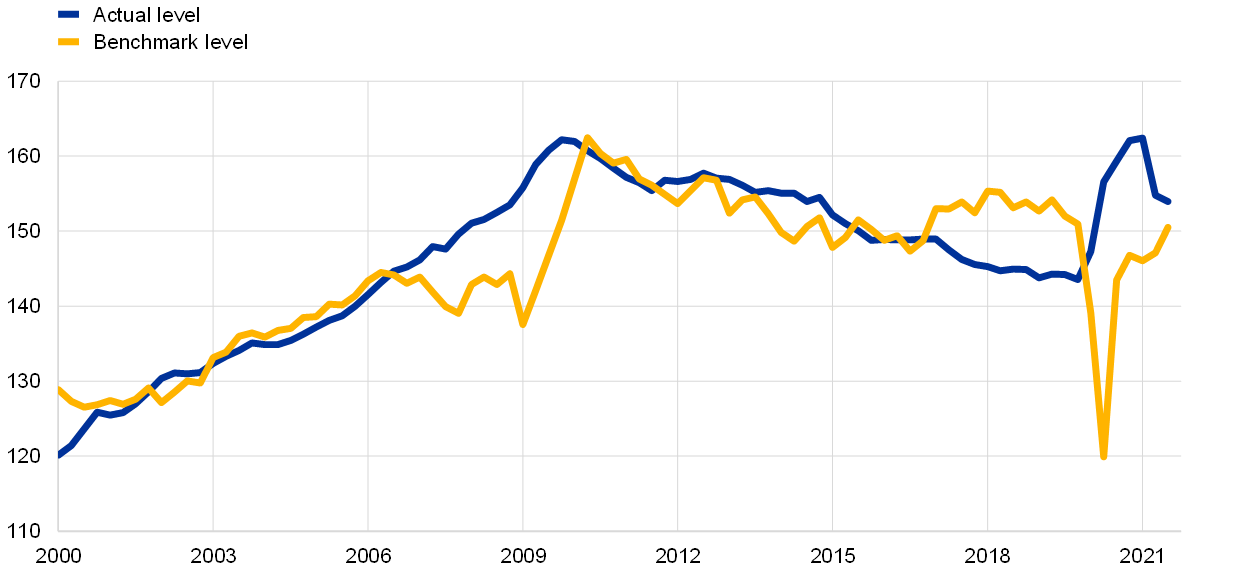
Indebtedness remains significantly above a benchmark level estimated on the basis of macro-financial conditions. Since mid-2020 gross indebtedness has exceeded its estimated benchmark level by a large margin (Chart 2).[4] Observed indebtedness rose sharply after the end of 2019, mirroring the marked increase in borrowing in the period from March to June 2020. Meanwhile, benchmark indebtedness declined strongly in the second quarter of 2020 and has since remained significantly below actual indebtedness. This was due first to the collapse of economic activity and then to its continued weakness, which historically would normally have been accompanied by lower indebtedness. The observed indebtedness also exceeded by a considerable margin its benchmark level between the end of 2006 and early 2010. This period was characterised by strong credit growth in the run-up to the global financial crisis in 2008 and a collapse in economic activity after the crisis erupted, followed by a lengthy period of deleveraging. The gap is projected to narrow and close in the coming quarters as the debt overhang and liquid asset holdings limit the demand for debt financing and the economy recovers.
Chart 2
NFC consolidated gross debt and its estimated benchmark level in the euro area
(percentages of NFC gross value added, notional stocks)
Sources: Eurostat, Merrill Lynch, Bloomberg, Thomson Reuters, ECB and ECB estimates.
Notes: Consolidated gross debt is the sum of loans to NFCs, debt securities issued and pension liabilities minus intra-sectoral lending (all notional stocks). Benchmark levels are estimates based on an error correction model relating NFC consolidated gross debt to NFC output, the relative cost of debt financing and the term spread (i.e. the difference between the euro area ten-year government bond yield and the euro area three-month money market rate). The relative cost of debt financing is defined as the composite cost of debt minus the cost of equity financing. The estimation period is from the first quarter of 1999 to the fourth quarter of 2019. The latest observations are for the third quarter of 2021.
The uneven distribution of debt reflects vulnerabilities among SMEs and micro firms – especially in the sectors most affected by the pandemic. Gross debt increased to different degrees across firms, depending on their exposure to the COVID-19 pandemic and the related lockdown measures. Among listed firms, those with sales below the median in 2020 increased their debt by about 3 percentage points more than firms with sales above the median (Chart 3). While data for non-listed companies are not available, estimates based on sectoral turnover suggest that for an average firm in the most affected sectors (e.g. accommodation), the increase in leverage could be close to 10 percentage points, even after considering a scenario in which only a third of corporate losses are filled by additional debt (the red line in Chart 3), while the rest are offset by government support policies.
Chart 3
Ratio of debt to assets of firms with different sales performance in 2020
(percentages of total assets)

Sources: Refinitiv and extrapolation based on Eurostat data.
Notes: The exercise underlying this chart documents the relationship between decreasing sales and increasing debt. The blue and yellow lines compare debt dynamics for listed firms with net sales growth above or below the median in 2020. The red and green lines (“Firms most affected by the crisis”) extrapolate debt dynamics for firms in the most affected euro area sector (i.e. accommodation), for which no hard data are yet available. The prediction is based on a panel model with turnover (entering into the model as linear and quadratic term) explaining the increase in the debt-to-assets ratio, after controlling for individual firm effects. The model is estimated for the post-COVID-19 period and used to extrapolate the unobserved debt-to-assets ratio using observed Eurostat turnover. For “policy reduces losses to one-third” (red line) it is assumed that government support policies (e.g. short-time working schemes) cover two-thirds of the costs, while for “policy reduces losses to one-half” (green line) it is assumed that only one-half is covered. The latest observations are for the first quarter of 2021.
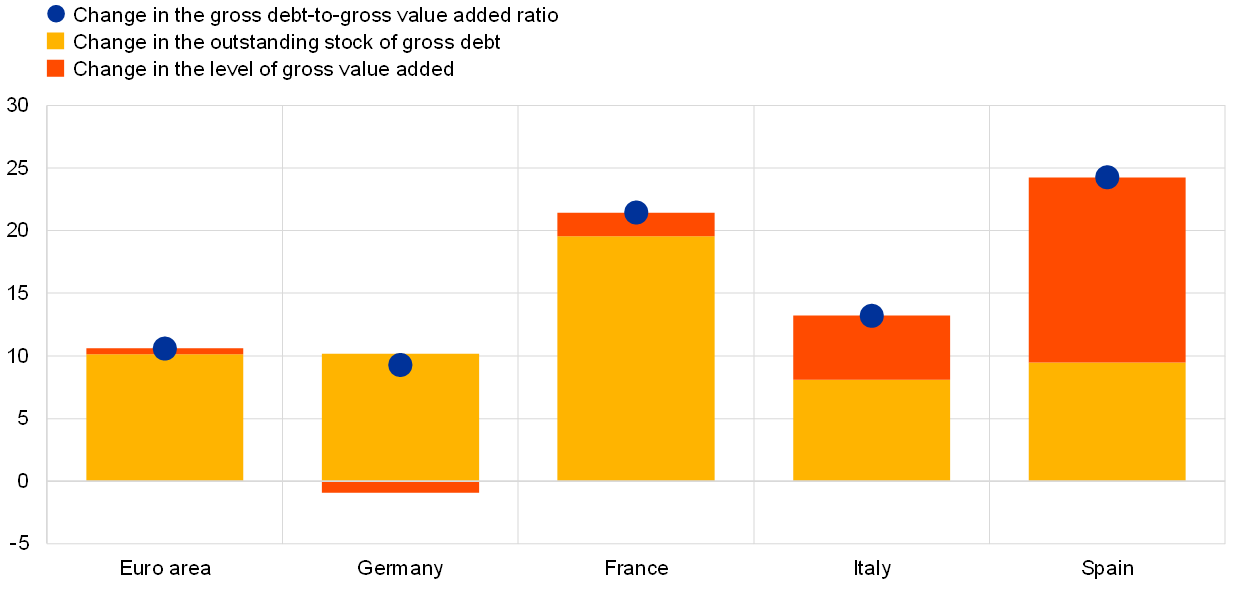
There are also significant differences in corporate indebtedness across countries. The NFC gross debt-to-value added ratio amounted to close to 200% in France in the third quarter of 2021, compared with around 120% in Germany (Chart 4, panel a). In France, the gross debt ratio has increased continuously since the end of 2007, as firms have financed their capital expenditure and mergers and acquisitions mostly with debt instruments. In Germany, indebtedness remains significantly lower than in other large euro area economies, as firms had financed their expansion mainly with internal funds before the pandemic. At the same time, the increase in the debt ratio since the end of 2019 was most significant in Spain, where, like in Italy, a large part of the decline observed between 2012 and 2019 was reversed (Chart 4, panel b). The decline in the level of net debt was particularly large in Italy, while in Germany, France and Spain net debt has increased (Chart 4, panel c). Differences between countries in the size of debt increases during the pandemic can largely be explained by (i) differences in the severity of the COVID-19 crisis and the resultant length and extent of lockdowns, (ii) differences in the take-up of state-guaranteed bank loans, and (iii) differences in economic and financial structures.
Chart 4
NFC debt in the euro area
a) Level of consolidated gross debt
(percentages of NFC gross value added)

b) Change in consolidated gross debt between the fourth quarter of 2019 and the third quarter of 2021
(percentage points, percentage point contributions)
c) Change in consolidated net debt between the fourth quarter of 2019 and the third quarter of 2021
(percentage points, percentage point contributions)

Sources: Eurostat, ECB and ECB estimates.
Notes: Consolidated gross debt is defined as the sum of total loans granted to NFCs, debt securities issued and pension liabilities minus intra-sectoral lending. Consolidated net debt is defined as consolidated gross debt net of currency and deposit holdings. The latest observations are for the third quarter of 2021.
Despite the increase in gross indebtedness, the debt service burden has continued to decline to new record lows. Gross interest payments by firms in the large euro area countries have decreased by between 1.8% and 9.1% since the end of 2019, despite the increase in the level of debt. This decline reflects the favourable financing conditions promoted by the policy response to the crisis, which have alleviated corporate debt sustainability concerns and supported the recovery. However, debt servicing costs as a percentage of profits continue to vary significantly across countries (Chart 5, panel a). This mainly reflects differences in gross debt levels and sectoral compositions across countries, the latter of which affects the gross operating surplus-to-value added ratio (Chart 5, panel b).[5]
Chart 5
NFC interest payments and profit margins in selected euro area countries
a) Gross interest payments
(four-quarter moving sums as a percentage of gross operating surplus)

b) Gross operating margins
(percentages)

Sources: Eurostat, ECB and ECB calculations.
Notes: Gross interest payments are calculated before financial intermediation services indirectly measured. Gross operating margins are calculated by dividing the gross operating surplus by the gross value added. The latest observations are for the third quarter of 2021.
Government and supranational support measures have contributed to a sizeable reduction in the liquidity risks of firms.[6] First, governments provided loan guarantees and direct liquidity support to corporates, while short-time working arrangements alleviated the wage bill. Second, deferrals of social security contributions and taxes also supported the liquidity position of firms. In aggregate, corporates received around €550 billion through these direct and indirect government support measures (Chart 6). Without these measures, corporate savings net of capital depreciation would have been significantly negative in 2020. Third, temporary supervisory measures for banks allowed them to offer loan payment moratoria. Fourth, the ECB provided support through its monetary policy measures. Firms also markedly reduced their investment expenditure compared with 2019. Total net credit flow was about €280 billion higher in 2020 than in 2019, supported to a considerable extent by the third series of longer-term refinancing operations (TLTRO III), the pandemic emergency purchase programme (PEPP)[7], government loan guarantees and supervisory measures.[8] All in all, NFC cash holdings increased by about €400 billion more in 2020 than the year before, although the increase was mainly concentrated in large firms. Also, in 2021 firms received significant amounts of extra resources from governments (about €325 billion), which further limited the decline in savings.
Chart 6
Euro area NFCs: sources and uses of funds, including fiscal support measures
(EUR billions)

Sources: Eurostat, ECB and ECB estimates.
Notes: “Fiscal support” is defined as the sum of the wage bill savings of firms due to job retention schemes, the effect of moratoria on loan interest payments and rents, tax deferrals and direct grants to firms. “Savings” is gross savings minus consumption of capital. “Credit” includes borrowing from banks and net issuance of debt securities, while “cash” includes currency and deposits. “Capital formation” is gross fixed capital formation plus change in inventories minus consumption of capital. The latest observations are for 2020.
The improved debt servicing capacity of firms and low financing/rollover risks underpin the currently moderate level of corporate vulnerabilities. NFC vulnerabilities – as measured by the ECB’s composite vulnerability index based on aggregate data – increased sharply following the outbreak of the COVID-19 pandemic, exceeding by a large margin the levels observed in the aftermath of the global financial crisis (Chart 7, panel a).[9] The rise was mostly driven by a fall in activity and profitability and an increase in leverage. However, the corporate vulnerability index has been declining since mid-2020, reaching a historical low in the second quarter of 2021. This reflected increases in the interest coverage ratio and savings, the very low cost of debt financing, the record high cash holdings and the observed shift from short-term debt financing towards instruments with longer maturities. Leverage also contributed slightly to the decline in the vulnerability index in the third quarter of 2021. This was because of the decline in the gross and net debt ratios following the continued improvement in the economy and the significant accumulation of cash at the height of the pandemic. However, the gross debt and debt-to-equity ratios remain at elevated levels and significantly above their end-2019 levels, increasing firms’ sensitivity to negative shocks. A counterfactual exercise shows that without the combined policy interventions, the vulnerability index would have reached a considerably higher value in mid-2020 and remained significantly above its current level (Chart 7, panel b).[10]
Chart 7
Corporate vulnerabilities for euro area NFCs
a) Composite index and its components
(Z-scores)

b) Composite index and its counterfactual
(Z-scores)

Sources: Eurostat, ECB, Merrill Lynch, Refinitiv and ECB calculations.
Notes: Positive values indicate higher vulnerability, negative values indicate lower vulnerability. The latest observations are for the second quarter of 2021. ECB staff estimates from the third quarter of 2021 to the fourth quarter of 2024.
3 Corporate balance sheet health and insolvency risk
Corporate insolvencies during the COVID-19 pandemic turned out to be historically low. In the past, insolvencies tended to be countercyclical and to lag real GDP growth (Chart 8, panel a). In 2020 this relationship between economic growth and insolvency procedures broke down. A key reason was the policy measures that were implemented to attenuate the negative economic effects of the pandemic crisis. As a result of these measures, insolvencies did not rise along with the collapse in economic activity. Instead, they decreased by around a third in 2020 and remained at low levels throughout 2021.
Chart 8
Economic activity and corporate insolvencies
a) Real GDP and insolvencies
(annual percentage changes)

b) Estimated insolvency gaps
(percentages)

Sources: Haver Analytics, Cerved, Eurostat and ECB staff calculations.
Notes: Panel a: the latest observations are for the third quarter of 2021 for GDP and the second quarter of 2021 for insolvencies. Panel b: annual data, seasonally adjusted. Insolvency forecast based on Bayesian vector autoregression models at country level, estimated up to 2019 and simulated for 2020, conditional on the observed paths of GDP and unemployment. The gaps are computed as the percentage distance between the predicted annual number of insolvencies and annual observed insolvencies. EA4 is the four largest euro area countries (Germany, France, Italy and Spain).
There are sizeable gaps between the predicted and observed number of insolvencies in the euro area. Insolvencies are predicted using country-level models reflecting the historical relationship between real GDP, unemployment and insolvencies. In 2020 the predicted number of insolvency cases for the four largest euro area countries exceeded observed cases by around 50% (Chart 8, panel b). In addition to policy support, these large gaps may also reflect business closures without insolvency procedures, especially for very small SMEs and sole proprietors. Overall, the large estimated insolvency gaps in conjunction with the fact that debt increases are more likely for smaller firms suggests that insolvency cases could still rise, particularly among smaller firms in sectors that are most affected by the pandemic.[11]
Chart 9
Balance sheet health and corporate insolvencies
a) Insolvencies and Altman Z-score
(x-axis: score; y-axis: index: 2019 = 100)
b) Insolvencies and Altman Z-score over time
(left-hand scale: score; right-hand scale: index: 2019 = 100)
Sources: Haver Analytics, Cerved, Eurostat and ECB staff calculations.
Notes: Panel a: the dots denote quarterly country-level observations from the first quarter of 2005 to the second quarter of 2021. The Altman score is computed as 0.717 x working capital/total assets + 0.847 x retained earnings/total assets + 3.107 x EBIT/total assets + 0.420 x equity/debt + 0.998 sales/total assets, where EBIT stands for earnings before interest and taxes. A higher Altman score corresponds to a healthier balance sheet structure. Panel b: the insolvency index is computed as the average across the four countries – Germany, France, Italy and Spain. The latest observation for insolvencies and the Altman score is for the second quarter of 2021.
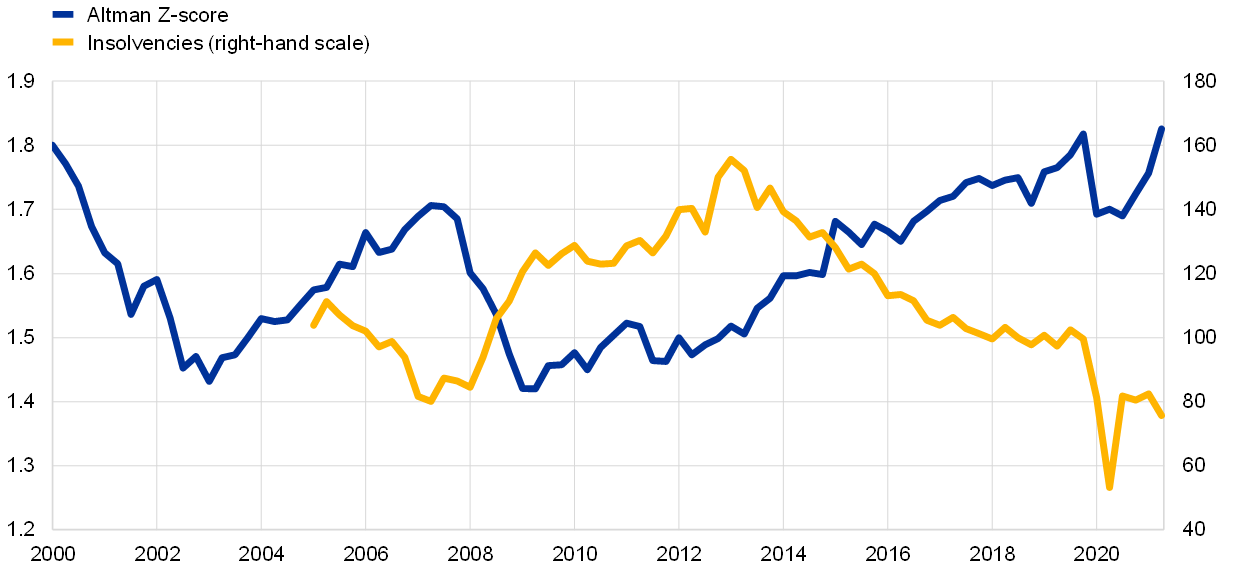
On aggregate, the balance sheets of firms suggest limited insolvency risks. The Altman Z-score[12] provides one indicator for assessing corporate balance sheet health and insolvency risk. While this indicator was designed to assess the insolvency risk of an individual firm, it can also be computed for the NFC sector as whole, as the availability of timely data is better at the aggregate level than for individual non-listed companies. At the country level, the index shows a negative relationship with insolvencies (Chart 9, panel a). Following a sharp deterioration in 2020 due to the pandemic, the Z-score partially rebounded in 2021, reflecting improved corporate balance sheets.
The recent general decline in insolvencies notwithstanding, developments are heterogenous across countries. Differences persist in national insolvency laws and in the culture of using insolvency procedures to close a business. Other ways of handling solvency problems include, for example, voluntary closures and out-of-court procedures. Such differences also affect the link between insolvencies at firm level and macroeconomic developments.[13] Although all euro countries introduced temporary relief from existing insolvency rules, there were notable differences in scope and time. National differences, whether structural or temporary, are reflected in different insolvency rates across countries (Chart 10, panel a), in differences in estimated insolvency gaps (Chart 8, panel b) and in the varying linear relationships between Altman scores and the number of insolvency cases.
Chart 10
Insolvency rates and SME loan recoveries across countries
a) Insolvency rates across countries
(insolvencies per 10,000 firms)

b) Duration and effect of SME loan recoveries
(left-hand scale: years; right-hand scale: percentages)
Sources: Haver Analytics, Cerved, Eurostat, European Banking Authority and ECB staff calculations.
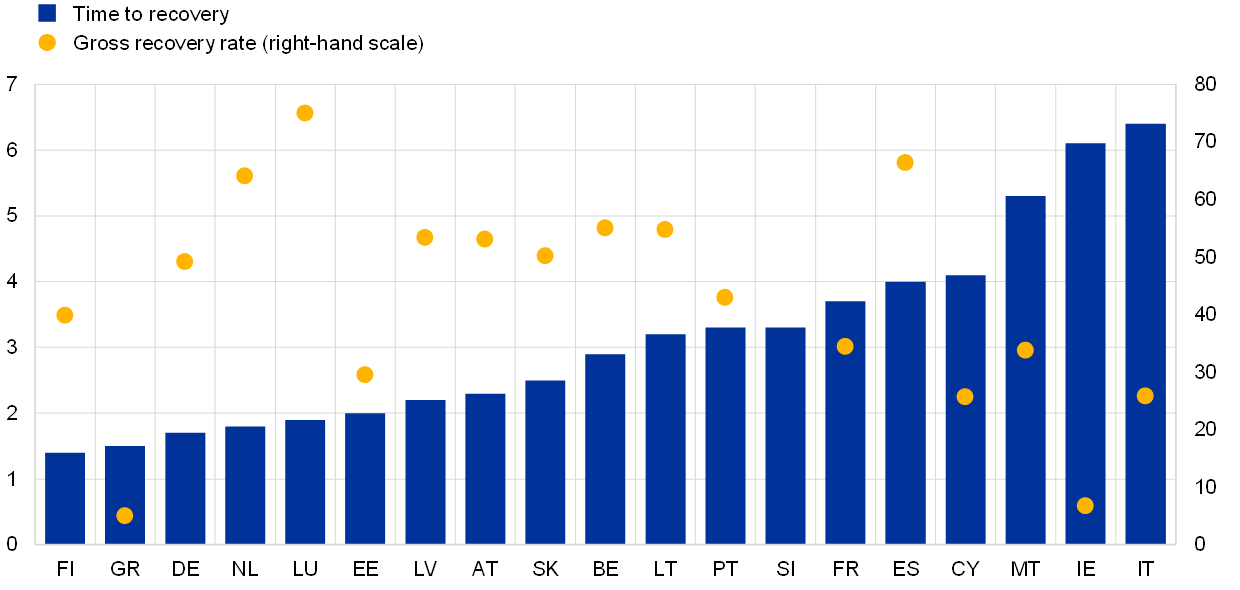
Notes: Panel b: data were collected for the period between 2015 and 2018 and refer to formal insolvency procedures launched by creditors with respect to SME lending and do not consider non‐judicial settlements. Cross-country comparability may be limited by differences in bank practices. The gross recovery rate is defined as the percentage of the bank claim before deducting the cost of recovering the claim. Data on recovery rates are not available for Slovenia.
There are also noteworthy differences in the functioning of insolvency frameworks across euro area countries. For example, the recent European Banking Authority insolvency benchmarking exercise found that recovery value and recovery time vary substantially across euro area countries.[14] For the euro area, the recovery of value from a distressed SME loan takes around four years on average, and creditors recover only about 40% of the loan amount (Chart 10, panel b). Unfavourable insolvency procedure metrics could be a motivation for seeking alternative ways to restructure or close a business.
Whether insolvencies and business closures will rise in the future also depends on how vulnerable corporates are to future economic shocks. Corporate vulnerabilities judged through the lens of bank asset quality suggest that some deterioration could be observed during the pandemic (Box 1), as also reflected in the vulnerability index shown in Chart 7 and the Altman score shown in Chart 9, panel b. The vulnerability index is projected to remain significantly below its average historical level at least until the end of 2024, indicating a limited level of corporate vulnerability. This outcome is, however, conditional on a further strengthening of economic activity and favourable financing conditions, which would keep the cost of debt servicing low.
Box 1
Bank asset quality in the COVID-19 pandemic and prior corporate vulnerabilities
An analysis of deterioration in corporate loan quality shows that pre-existing borrower vulnerabilities, such as elevated leverage, low liquidity buffers and low profitability, were more frequently associated with increased credit risk resulting in a reclassification of exposures to IFRS 9 Stage 2 (elevated credit risk) in 2020.
In the first year of the COVID-19 pandemic, euro area banks recognised a significant increase in corporate credit risk in their balance sheets. Banks reclassified 11.3% of their previously performing (IFRS 9 Stage 1) corporate loan books to IFRS 9 Stage 2 (loans that have a significant increase in credit risk but remain performing).[15] The frequency of reclassifications almost doubled compared with 2019, mainly driven by the economic sectors most affected by the lockdowns. However, only a small share of loans ended up in Stage 3 (credit impaired). This box investigates the role played by pre-existing corporate vulnerabilities, sectoral shocks, bank-level factors and policy support measures in the reclassification of loans in 2020.
Pre-existing corporate vulnerabilities, such as a heavy debt load, a weak liquidity position and low profitability, are associated with significant increases in credit risk (Chart A). Combining firm-level data with loan-level data from AnaCredit (the euro area credit dataset) indicates that firms entering the crisis with higher leverage and lower liquid assets were more likely to have loans that were reclassified to Stages 2 and 3 than other firms. In addition, firms with loans that moved to Stage 2 were generally less profitable than those with loans that remained in Stage 1, while most loss-making companies moved directly to Stage 3. The distribution of firms’ financial ratios across the three categories thus suggests that pre-existing vulnerabilities played an important role in banks’ decisions on reclassification.
Chart A
Distribution of borrowers’ financial ratios by IFRS 9 stage classification at the end of 2020
(x-axis: multiples; bars: histogram; lines: kernel density)

Sources: ECB (supervisory data, AnaCredit), Bureau van Dijk (Orbis) and ECB calculations.
Notes: According to IFRS 9, banks must classify loans into three stages (see footnote 15). The panels show that loans to more leveraged, less liquid and less profitable firms were more likely to be reclassified from IFRS 9 Stage 1 to Stages 2 and 3 between the end of 2019 and the end of 2020. The sample covers 1,500,000 firms with an active lending relationship classified as Stage 1 at the end of 2019 that remained active at the end of 2020 and for which financial ratios are available in Orbis. The panels show the distribution of three financial ratios for firms whose lending relationships remained in Stage 1 (blue), migrated to Stage 2 (yellow) or migrated to Stage 3 (red) during 2020. Firms with multiple credit relationships classified in different IFRS 9 stages are assigned to the stage corresponding to the worst credit quality. The liquidity ratio is defined as the ratio of cash and cash equivalents to current liabilities.
Sectoral shocks arising from business closures and restrictions on economic activity also contributed to weaker corporate asset quality (Chart B, panel a). Firms operating in sectors most affected by the lockdowns were more likely to see their loans reclassified to Stage 2 or 3, although the noisiness of the relationship between sectoral turnover shocks and loan migrations suggests that other factors were significant too. This relationship is particularly strong in the services sector and much weaker in the construction sector, while manufacturing displays heterogeneous behaviours across countries.
Chart B
Turnover losses, pre-pandemic vulnerabilities and loan migrations during the first year of pandemic
a) Change in turnover relative to 2019 and Stage 2 migration rates in 2020
(percentages)

b) Impact of deteriorating fundamentals on migration to Stages 2 and 3
(percentage changes in odds of migration from Stage 1)

Sources: ECB (supervisory statistics, AnaCredit), Eurostat, Bureau van Dijk (Orbis) and ECB calculations.
Notes: Panel a: each data point indicates a subsector-country pair (e.g. travel agents in Greece). Letters refer to NACE, the statistical classification of economic activities in the EU. “Services” includes subsectors of the following NACE sections: H – Transportation and storage; I – Accommodation and food service activities; J – Information and communication; M – Professional, scientific and technical activities; and N – Administrative and support service activities. “Trade” includes wholesale and retail trade, and repair of motor vehicles and motorcycles. Panel b: odds ratios estimated using a multinomial logit model with bank and debtor country fixed effects, with about 750,000 firm-level observations. All estimated parameters are statistically significant at the 1% level. pp stands for percentage points.
Results from regression analysis confirm that prior fundamentals and sectoral shocks explain the observed asset quality deterioration. A multinomial logit model is used to assess the role of several factors in driving the deterioration in corporate credit quality. The dependent variable is defined as the IFRS 9 stage in which the firm’s loans were classified at the end of 2020, while three groups of explanatory variables are considered: firm-level financial variables, representing the pre-pandemic fundamentals of the borrower; macro variables, representing the country and sector-specific impact of the pandemic; and bank-specific factors. Firms’ profitability and leverage played a particularly important role: a 1 percentage point increase in the debt-to-assets ratio raised the odds of migration to Stage 2 by 3.6% for an average firm, and a 5 percentage point decrease in return on assets increased these odds by over 4% (Chart B, panel b). Among the macro factors, sectoral cash flow changes show a strong negative relationship with migration to both Stage 2 and Stage 3.
The take-up of moratoria and guarantees interacted with loan classification in 2020. While policy support measures were key in avoiding large-scale asset quality deterioration, banks have nonetheless recognised that their use may be associated with higher vulnerability of individual corporate borrowers. Indeed, the take-up of guarantees and moratoria translated into heightened reclassification of loans to Stage 2. Focusing on moratoria, this reclassification tendency was stronger for borrowers with high leverage than for borrowers with liquidity problems, which was in line with the stated purpose of the moratoria of preventing liquidity-driven defaults.
4 The impact of weakened corporate balance sheets on investment
The increased corporate indebtedness could inhibit investment spending and the economic recovery. Even if insolvencies were not to rise strongly in the period ahead, the increase in the corporate debt burden compared with the pre-COVID-19 period as well as the heterogenous distribution of debt across firms could still put a drag on the economic recovery by impeding investment growth. This could occur through several channels. High corporate indebtedness implies higher interest expenses and thus fewer funds available for investment. Firms with high leverage also find it harder to obtain new funds from external sources due to their higher default risk. Moreover, the desire to repair weak balance sheets leads firms to deleverage, and thereby forgo investment opportunities, potentially with negative implications for profits as well.[16]
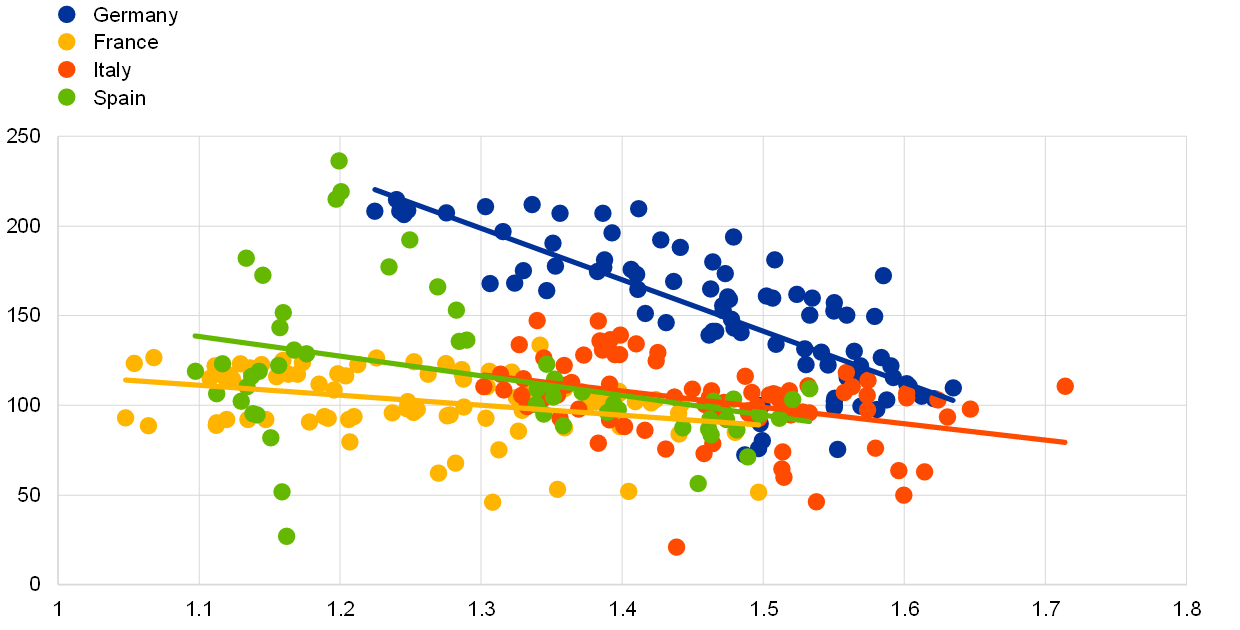
A negative link between high debt and investment is empirically well established. A large body of literature has investigated the link between indebtedness and investment at the firm level. Recent studies highlight in particular the non-linear nature of this relationship by identifying a threshold level beyond which the structural relationship between debt and investment changes.[17] While low and medium levels of leverage do not have a negative impact on investment, highly indebted firms report lower investment (Chart 11, panel a). Empirical evidence for the euro area suggests that in particular a sizeable number of micro, small and medium-sized firms are located in “vulnerability regions” where debt, and hence reliance on external finance, negatively affects investment. By contrast, investment by larger firms, which typically face lower financial frictions, does not seem to be influenced by higher leverage (Chart 11, panel b).
Chart 11
Corporate debt and investment in the euro area
a) Debt-to-assets and investment ratios
(x-axis: debt-to-assets ratio, percentiles; y-axis: tangible fixed capital, annual percentage changes)

b) Debt-to-assets and investment ratios by firm size
(x-axis: debt-to-assets ratio, percentiles; y-axis: tangible fixed capital, annual percentage changes)

Source: Barrela, R., Lopez Garcia, P. and Setzer, R., “Medium-term investment responses to activity shocks: the role of corporate debt”, Working Paper Series, ECB, forthcoming.
Notes: The percentiles of the debt-to-assets ratio are defined at the two-digit sector level for a sample of 14 euro area countries from 2005 to 2018. The investment ratio is defined as the annual change in tangible fixed assets over previous year’s tangible fixed assets. Firm size is defined according to the number of employees. Micro firms have fewer than ten employees, small firms are those with fewer than 50 employees, medium-sized firms have fewer than 250 employees, and large firms have more than 250 employees.
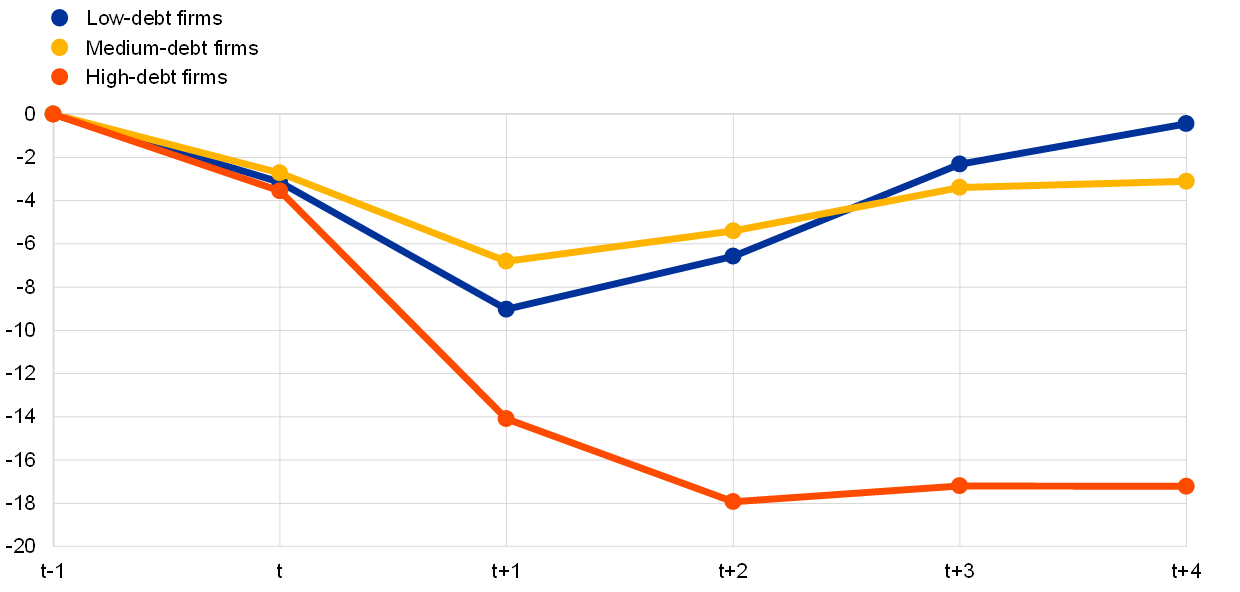
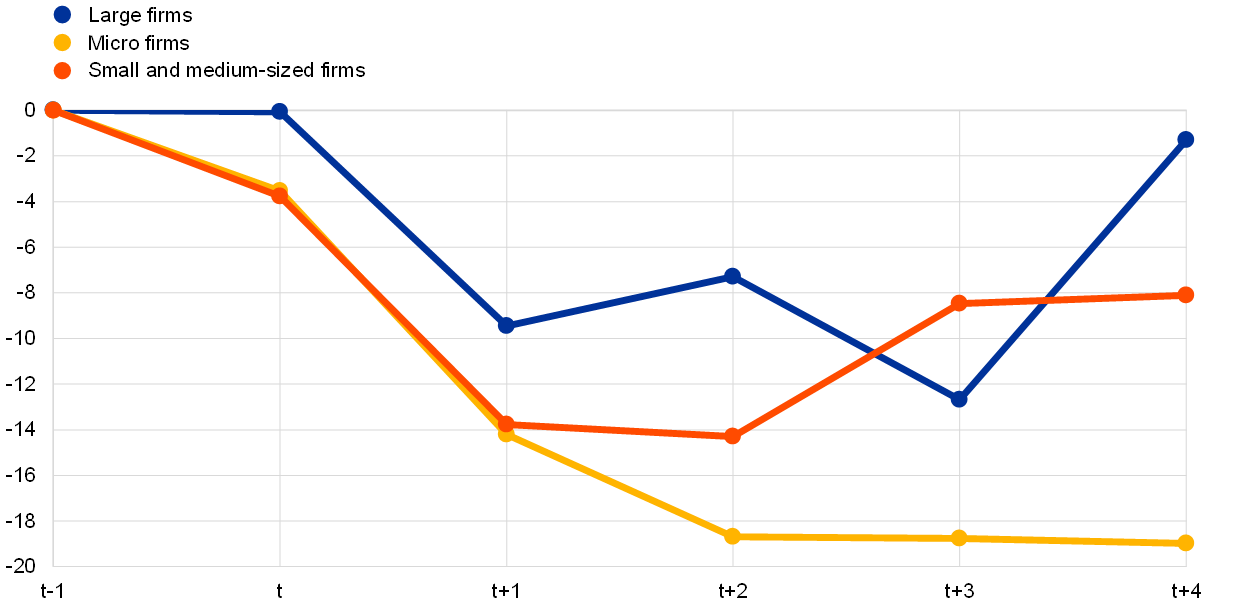
High debt is associated with low investment in the aftermath of economic crises. The sensitivity of investment to debt differs in economic booms and economic busts. ECB analysis based on firm-level data for 14 euro area countries from 2005 to 2018 suggests that investment by high-debt firms is significantly depressed for an extended period following an economic crisis.[18] Over the four years after a large economic contraction, the growth rate of tangible fixed capital of high-debt firms is some 15 percentage points below that of their counterparts with lower debt burdens (Chart 12, panel a). This result is driven in particular by micro firms, which experience a more protracted fall in investment post-crisis than larger firms (Chart 12, panel b). Applying these findings to the COVID-19 crisis suggests that the COVID-19 shock may lead to a 5% drop in the aggregate stock of tangible fixed assets by 2024.
Improving the equity position of firms could strengthen the prospect of sustainable investment growth in euro area countries. Investment needs in the post-COVID-19 period are likely to be substantial. The COVID-19 pandemic has accelerated large-scale structural transformations that are likely to be associated with high investment needs. New forms of work that necessitate additional hardware and software to allow staff to work from home effectively, an increased take-up of digital technologies and the transition to a carbon-neutral economy all require a comprehensive modernisation of firms’ capital stock. The European Commission estimates that the private and public investment needs related to the green and digital transitions will amount to nearly €650 billion per year until 2030, corresponding to 4.5% of EU GDP in 2021, and around one-fifth of total private and public investment in the EU in 2021.[19] Such high levels of investment would be facilitated by a corporate sector that improves its ability to access the credit needed by strengthening its reliance on equity instead of debt.[20]
Chart 12
Investment response to a contraction in economic activity
a) Investment by firm leverage
(cumulative growth of tangible fixed capital, percentages)
b) Investment of high-debt firms by firm size
(cumulative growth of tangible fixed capital, percentages)
Source: Barrela, R., Lopez Garcia, P. and Setzer, R., “Medium-term investment responses to activity shocks: the role of corporate debt”, Working Paper Series, ECB, forthcoming.
Notes: A contraction in economic activity is defined as a large drop in sector value added growth (1.5 standard deviations below the sectoral historical average). The chart shows the cumulative impact (in percent) on tangible fixed capital at time t+h vis-à-vis t-1 of such an activity shock at time t. The impulse response functions are estimated using the local projection approach in Jordà, O., “Estimation and Inference of Impulse Responses by Local Projections”, American Economic Review, Vol. 95, No 1, March 2005, pp. 161-182. The sample comprises 14 euro area countries from 2005 to 2018. Firm size is defined according to the number of employees. Low-debt firms are defined as firms in the bottom 20th percentile of the debt ratio distribution, medium-debt firms are firms between the 20th and the 80th percentile, and high-debt firms are firms standing above the 80th percentile of the distribution. Micro firms have fewer than ten employees, small and medium-sized firms are those with fewer than 250 employees, and large firms have more than 250 employees.
Box 2
Some structural features of SMEs
SMEs are the dominant form of business organisation in the euro area (Chart A, panel a). They represent a heterogeneous segment, ranging from single, unincorporated entrepreneurs to medium-sized companies listed on a stock exchange. They account for about 62% of total employment and 50% of value added in the euro area. In all euro area countries, SMEs typically deliver less value added per number of employees than large firms. At the euro area level, the productivity gap relative to large firms amounted to 44%, 34% and 16% for micro, small and medium-sized firms respectively in 2019 (Chart A, panel b). In Ireland, Greece and Portugal in particular, SMEs are less productive than larger firms, while the productivity differences are less pronounced in the Netherlands, Luxembourg, Estonia and Malta, for instance. This notwithstanding, according to the Organisation for Economic Co-operation and Development (OECD), smaller firms often outperform larger enterprises on account of competitive advantages in responding to niche demand and greater flexibility to customise and differentiate products. Start-ups and young firms, which are generally small or micro firms, are also the primary source of job creation in many countries.[21]
Chart A
Structural features of SMEs in the euro area
a) Employment share by firm size, 2019
(percentages of the total population of employed persons)
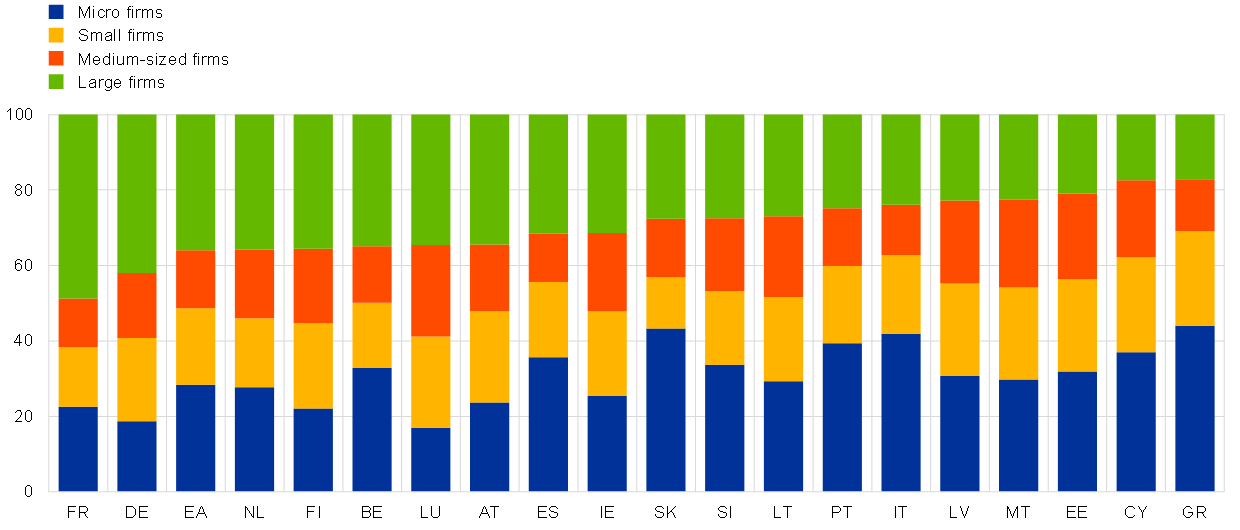
b) Productivity gap between SMEs and large firms, 2019
(percentage differences compared with the productivity of large companies in the same country)

Sources: Eurostat (annual enterprise statistic) and ECB calculations.
Notes: Panel a: countries are ordered according to the combined share of employment of SMEs. Panel b: productivity is defined as value added divided by the number of employees at the sector level. For some countries, data exclude certain sectors for which no data were available. Countries are ordered according to the size of the productivity gap for all SMEs (green dot).
The productivity gap between small and large firms can be explained by some specific features of small firms and by institutional factors. This has been attributed to lower diversification, the existence of barriers to entry and growth (due to size-contingent regulations), and obstacles to entrepreneurial capacity. The latter are associated among other things with family-owned company structures and, in some cases, a system of managerial selection based on loyalty rather than competence.[22] Furthermore, micro firms record lower productivity than larger SMEs, which are more export-oriented, compete with large multinationals and are often among the market leaders in their particular niches.
The COVID-19 crisis has further exposed the vulnerability of SMEs. While differences across sectors and countries exist, the higher vulnerability of SMEs compared with larger firms relates to their prevalence in COVID-19-sensitive sectors (such as tourism) and their more difficult access to finance.[23] Risks associated with corporate undercapitalisation are stronger for SMEs than for larger firms. SMEs are also less likely to access equity markets due to the disproportionate costs (e.g. various fees) and concerns over undue influence of new investors.
At the same time, the COVID-19 pandemic has led to the acceleration of pre-existing structural trends, such as the deglobalisation of global value chains and the digital and green transitions. These trends may provide new opportunities for SMEs, for instance by strengthening their comparative advantages in terms of radical innovation and capacity to respond rapidly to changing market conditions. Digitalisation also opens up new ways for SMEs to reach global markets at lower cost. A sound business environment and conducive framework conditions are preconditions for all firms to reap the benefits of digitalisation trends, but this is particularly the case for SMEs as they are disproportionately affected by inefficient insolvency regimes and the high costs associated with administrative burdens and red tape.[24]
5 Conclusions
Corporate indebtedness increased during the pandemic. On aggregate, firms’ higher debt has been partly offset by additional cash holdings, especially for larger firms. Bank loans and policy support have helped to cover the liquidity needs of firms and mitigate the risk of immediate insolvencies as cash flows plummeted. As a result, the number of corporate bankruptcies in the euro area has declined significantly since the start of the pandemic, reinforced by the suspension of mandatory insolvency filings in some countries. Corporate insolvency rates are likely to rise, but probably by less than would be predicted by historical regularities.
The heterogenous impact of the pandemic on the balance sheets of firms and ongoing structural transformations will influence the outlook for the corporate sector. High corporate leverage could deter investment during the recovery. While large firms are more resilient to future shocks on account of their large cash holdings, a failure to address the high leverage of SMEs, most notably in sectors hit hard by the pandemic, could also lead to an increase in the number of non-viable firms, which could crowd out viable firms from available credit. This would negatively affect the capacity of the corporate sector to pursue the investment required to support the green and digital transitions.
Broadening the funding sources of firms beyond debt financing could foster sustainable investment growth. Several measures have been proposed to strengthen incentives for private investors to provide equity to viable firms in distress or support balance sheet restructuring.[25] These include reducing the tax bias against equity financing and ensuring access to timely and reliable information for equity investors. Changes to accounting rules could improve access to equity provided by private investors, with notable benefits for SMEs.
Sound structural policies could further promote the capacity of the corporate sector to support the recovery. Shorter insolvency procedures might enable a smoother reallocation of resources from less productive firms to firms that are more likely to thrive in the post-pandemic economy. Reducing barriers to entry and investment for new, innovative market entrants could further strengthen the corporate sector, especially through greater use of digitalisation and low-emission technologies. Advancing the banking and capital markets unions and rolling out the Next Generation EU programme could play a strong supporting role in increasing corporate resilience and strengthening the recovery.[26]
- The survey is conducted twice a year: once by the ECB, covering euro area countries, and once in cooperation with the European Commission, covering all EU Member States plus some neighbouring countries. For the latest survey, see Survey on the access to finance of enterprises.
- Consolidated net debt, defined as consolidated gross debt net of currency and deposit holdings.
- See the box entitled “Non-financial corporate health during the pandemic”, Economic Bulletin, Issue 6, ECB, 2021.
- An error-correction model relates the long-run level of gross debt to output, the relative cost of debt financing and the term spread. Based on these fundamentals, it allows a time-varying benchmark level to be derived that is consistent with historical regularities.
- For different classifications of “quasi-corporations” across countries, see Lequiller, F. and Blades, D., Understanding National Accounts: Second Edition, OECD Publishing, 2014.
- For a comprehensive list of EU-level interventions to support jobs and the economy after the pandemic, see “Jobs and economy during the coronavirus pandemic”, European Commission.
- Under the PEPP and the corporate sector purchase programme (CSPP), the ECB purchases corporate bonds and commercial paper of the NFC sector in both the primary and secondary markets.
- For bank-level microprudential measures, see the ECB’s banking supervision website; for macroprudential measures, see the special feature entitled “Financial stability considerations arising from the interaction of coronavirus-related policy measures”, Financial Stability Review, ECB, November 2020.
- The composite measure is based on a broad set of indicators along five different dimensions: debt service capacity (measured by the interest coverage ratio, corporate savings and revenue generation), leverage (debt-to-equity ratio, net debt-to-EBIT ratio and gross debt-to-income ratio), activity (sales growth, trade creditors ratio and change in accounts receivable turnover ratio), profitability (return on assets, profit margin and market-to-book value ratio), and financing/rollover (short-term debt-to-long-term debt ratio, quick ratio, overall cost of debt financing and credit impulse). For the construction of the index in more detail, see the box entitled “Assessing corporate vulnerabilities in the euro area”, Financial Stability Review, ECB, November 2020.
- Without cost relief from governments, NFCs’ debt financing would have increased by €550 billion in 2020 and €325 billion in 2021 to compensate for revenue shortfalls. This would have translated, in the corporate vulnerability index, into higher leverage and corporate gross interest payments while lowering their internally generated funds. The simulation assumes that the effective interest rate on firms’ outstanding debt and the share of long-term debt in total debt would have remained at around their end-2019 levels in the absence of the additional monetary policy measures, supervisory measures and government loan guarantees.
- See, for example, Cros, M., Epaulard, A. and Martin, P., “Will Schumpeter Catch Covid-19?”, CEPR Discussion Papers, No 15834, Centre for Economic Policy Research, 2021.
- See Altman, E.I., “Financial Ratios, Discriminant Analysis and the Prediction of Corporate Bankruptcy”, The Journal of Finance, Vol. 23, No 4, September 1968, pp. 589-609. For details of the computation, see the notes to Chart 9, panel a.
- See, for example, Corporate insolvencies in Europe 2020, Creditreform, 2021.
- See “Report on the benchmarking of national loan enforcement frameworks”, EBA/REP/2020/29, European Banking Authority, 2020.
- Under the IFRS 9 accounting framework, loans are classified as Stage 1 if their credit risk has not increased significantly since initial recognition; Stage 2 if their credit risk has increased significantly since initial recognition, but they are still performing; and Stage 3 if they are credit impaired.
- See Myers, S.C., “Determinants of corporate borrowing”, Journal of Financial Economics, Vol. 5, Issue 2, November 1977, pp. 147-175.
- See Kalemli-Özcan, S., Laeven, L. and Moreno, D., “Debt overhang, rollover risk, and corporate investment: evidence from the European crisis”, Working Paper Series, No 2241, ECB, February 2019; and Gebauer, S., Setzer, R. and Westphal, A., “Corporate debt and investment: A firm-level analysis for stressed euro area countries”, Journal of International Money and Finance, Vol. 86, Issue C, September 2018, pp. 112-130.
- See Barrela, R., Lopez Garcia, P. and Setzer, R., “Medium-term investment responses to activity shocks: the role of corporate debt”, Working Paper Series, ECB, forthcoming.
- See Gentiloni, P., “Opening remarks at the press conference on the relaunch of the review of EU economic governance”, European Commission, 19 October 2021.
- Several studies have shown that high debt can exacerbate constraints on firms’ access to credit, which restrains corporate investment and employment. See Cherchye, L., De Rock, B., Ferrando, A., Mulier, K. and Verschelde, M., “Identifying financial constraints”, Working Paper Series, No 2420, ECB, June 2020; and De Haas, R. and Popov, A., “Finance and carbon emissions”, Working Paper Series, No 2318, ECB, September 2019.
- See “Small, Medium, Strong. Trends in SME Performance and Business Conditions”, OECD, 2017.
- See Crouzet, N. and Mehrotra, N.R., “Small and Large Firms over the Business Cycle”, American Economic Review, Vol. 110, No 11, 2020, pp. 3549-3601; and Pellegrino, B. and Zingales. L., “Diagnosing the Italian Disease”, NBER Working Paper, No 23964, National Bureau of Economic Research, 2017.
- See “Coronavirus (COVID-19): SME policy responses”, OECD, 2020.
- See “Enhancing the Contributions of SMEs in a Global and Digitalised Economy”, OECD, 2017.
- See, for instance, “Reviving and Restructuring the Corporate Sector Post-Covid: Designing Public Policy Interventions”, Working Group on Corporate Sector Revitalization, Group of Thirty, 2020.
- See de Guindos, L., “Banking Union and Capital Markets Union after COVID-19”, keynote speech at the CIRSF (Research Centre on Regulation and Supervision of the Financial Sector, Portugal) online Annual International Conference 2020 on Major Trends in Financial Regulation, 12 November 2020; and the article entitled “Next Generation EU: a euro area perspective”, Economic Bulletin, Issue 1, ECB, 2022.