
Owner-occupied housing and inflation measurement
Published as part of the ECB Economic Bulletin, Issue 1/2022.
In the context of monetary policy decision-making, consumer price indices (CPIs) are prominently used as measures of inflation. The ECB’s recently published monetary policy strategy review concluded that the Harmonised Index of Consumer Prices (HICP) remains the appropriate measure for assessing price stability in the euro area. However, it also acknowledged that the inclusion of costs related to owner-occupied housing (OOH) would better represent inflation relevant for households. This article elaborates on the treatment of OOH in CPIs in general, and in the HICP in particular, with a focus on the net acquisition approach recommended by the Governing Council. The article also presents the new analytical quarterly HICP combined with the owner-occupied housing price index (OOHPI) based on ECB calculations.[1]
1 Owner-occupied housing in the context of the HICP: concept, developments and housing market characteristics
Owner-occupied housing and the HICP
The European Statistical System (ESS)[2] has been considering how to treat owner-occupied housing (OOH) since the early stages of the harmonisation of CPIs in the EU. The ESS started harmonising CPIs in the EU in the 1990s. However, so far, OOH has not been included in those harmonised indices. Owing to the very different treatment of OOH in the national CPIs of EU Member States, there was no agreement on a common approach to including OOH in the HICP. Moreover, residential property price indices based on actual purchases of houses and flats were rarely available.
Since the establishment of the HICP in 1997, it has only covered a small part of owner-occupiers’ housing costs. The HICP includes OOH expenditures pertaining to material and services for minor repairs, insurance connected with the dwelling, electricity, gas and other fuels, water supply, waste water removal and waste collection. However, the most important part of household OOH costs – purchases of houses and flats and expenditures related to owning a dwelling or, alternatively, the estimated cost of living in an owner-occupied dwelling – was not included in the HICP.
In line with the HICP’s conceptual foundation of covering transactions between households and other sectors of the economy, OOHPIs have been designed according to the net acquisition approach. In the early 2000s, the ESS decided to quantify OOH-related costs according to the “net acquisition approach”. In the broadest sense, acquisitions of houses and flats by households encompass all purchases of residential dwellings. For the purpose of measuring OOH-related costs in a CPI like the HICP, however, buy-to-let purchases are disregarded. As the buyers do not intend to live in the property themselves, the housing is not “owner-occupied” and such purchases are investments rather than consumption.[3] Furthermore, the HICP concept of covering transactions between households and non-households, applied to OOH, disregards purchases of dwellings by households from other households.[4] Net acquisition is determined by deducting sales to sectors other than the household sector (outflows) from purchases from other sectors (inflows). Hence, sales of owner-occupied dwellings to parties outside the household sector have to be deducted from total purchases of owner-occupied dwellings by households.[5] The ESS also developed price indices for the additional components of OOHPIs, for self-built houses, for maintenance and major repair, and for expenditures related to the purchase (ownership transfer) and ownership of owner-occupied dwellings, such as home insurance. In 2013, Member States started to provide OOHPIs and their breakdowns based on a dedicated legal act – at first only internally within the ESS. Since then, further improvements have been implemented. In 2016, Eurostat began publishing a set of stand-alone OOHPIs, while euro area and EU totals of OOHPIs were published for the first time in October 2021.
The importance of including owner-occupied housing in the HICP
Including OOH-related costs in the HICP, as far as statistically possible, would improve the HICP as an indicator of inflation and increase its representativeness and cross-country comparability. The public “ECB Listens” events conducted in the context of the ECB’s monetary policy strategy review demonstrated that European citizens consider changes in house prices to be an important element of overall inflation.[6] For an analysis of consumer perceptions of OOH-related costs, see the box entitled “Housing costs: survey-based perceptions and signals from price statistics” in this issue of the Economic Bulletin.
High rates of home ownership motivate the inclusion of OOH-related costs in the HICP. Chart 1 shows the percentage of owner-occupiers in total households in euro area countries. The share of owner-occupiers ranges from 50% to 90%, with rates around or above 70% in 16 out of the 19 euro area countries. In view of the relatively high home ownership rates and the large differences across countries, the inclusion of OOH-related costs in the HICP will improve the representativeness of the inflation measure with respect to household expenditure within a country and will enhance cross-country comparability. The cross-country heterogeneity of OOH-related costs is reflected in the euro area price index through weighted averages, where expenditure weights may vary greatly across countries. However, when including OOH-related costs according to the net acquisition approach, it has to be borne in mind that the broadened representation of housing expenditure in the inflation index largely reflects net purchases of OOH by the household sector (the net increase in the stock of OOH), while costs related to ownership (the stock of OOH) are included in the form of maintenance, repair, insurance and other types of expenditure.
Chart 1
Home ownership rates in euro area countries, 2019
(percentages)
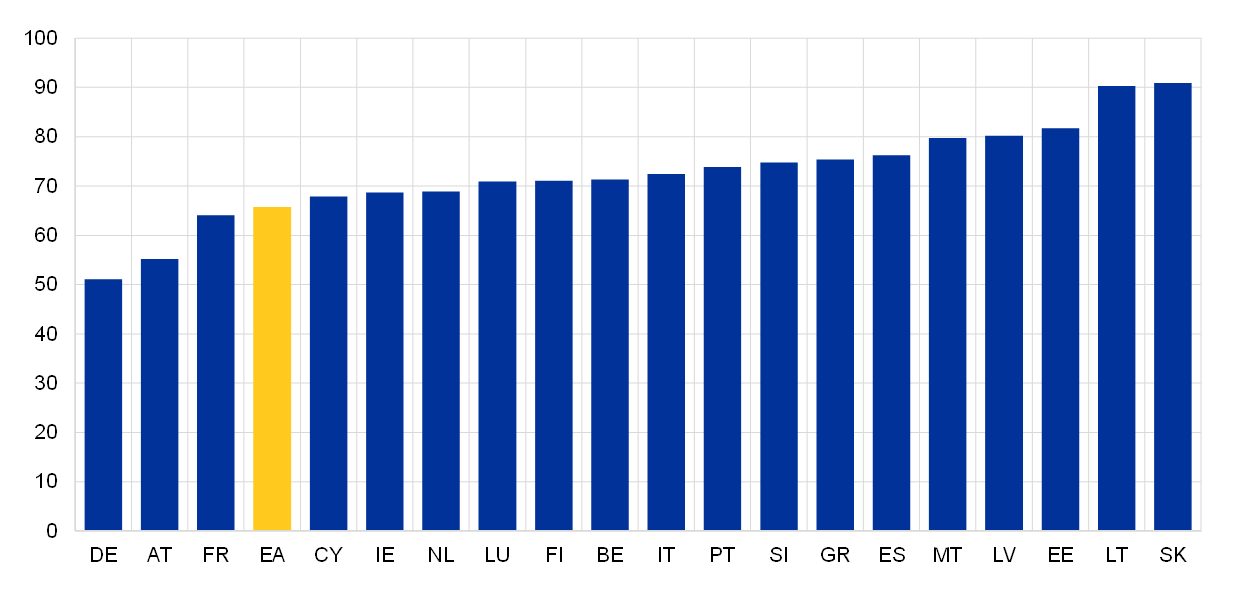
Source: Eurostat (EU Statistics on Income and Living Conditions, EU-SILC).
2 Approaches to owner-occupied housing in consumer price indices
Generally, changes in consumer prices over time can be measured on the basis of acquisitions (expenditure), use (consumption or user costs) or payments.[7] Acquisition-based price indices record actual transaction prices of products, including durable goods, when these are purchased.[8] By contrast, use approaches aim to quantify the cost of using durable products over the period of time that these are consumed. Finally, price indices constructed according to the payments approach represent changes over time in prices related to monetary outlays in all periods in which households actually pay for products acquired in earlier periods. In CPI implementations worldwide, acquisition, use and payments approaches differ primarily in the area of OOH, where use approaches are implemented in the form of equivalent rents or user costs.
Alternative approaches to including housing costs in inflation measurement focus on specific elements of housing market segments. Chart 2 shows housing costs as measured by rents, house prices and OOHPIs. Rent price developments in the euro area demonstrate remarkably stable inflation rates, with an average of 1.6% over the longer-term (20 years)[9], partly reflecting indexation to past inflation trends and stickiness of long-term rental contracts. By contrast, changes in house prices tend to be more closely linked to business cycles and sometimes also financial market dynamics, with considerable variation around their longer-term average of 3.3%[10]. OOHPIs can be seen as an intermediate measure that improves the capture of housing price dynamics and price changes in ownership-related expenditures. OOHPI annual growth rates are less volatile in the long term than changes in house prices. The approach chosen for including OOH-related costs in inflation measurement, whether it is based on imputing rents or on price developments of purchased houses (and flats), will thus have an impact on the resulting index. OOH price indices based on equivalent rents lead to a dampening of inflation cyclicality, while including a house price-based OOH index implies adding a component with higher cyclicality, at least during our observed sample (see Chart 2).[11]
Chart 2
Measures of housing costs: house prices, rents and the OOHPI in the euro area
(annual percentage changes)

Sources: Eurostat and ECB calculations.
While the size of OOH weights is generally high when included in CPIs, it varies significantly across OOH inclusion methods. However, the size of the OOH weight depends on whether OOH pricing refers to the stock of owner-occupied houses and flats, as in the rental equivalence and user cost approaches, or to purchases of dwellings from the non-household sector, i.e. the net inflow of OOH (“OOH new to the household sector”). Our estimates suggest that imputing rents for the stock of OOH would imply a weight of 12% for OOH in the euro area HICP, while the weight of OOH according to the net acquisition approach would be around 9%.
The Governing Council has always been in favour of including OOH in the HICP, but under certain conditions. A broad coverage of household expenditure in the headline inflation measure better represents the inflation rate that is relevant for households. However, the integration of price changes for OOH into the HICP requires OOHPIs to be brought into line with HICP standards. The Governing Council has argued that the full integration of OOH price changes into HICPs might adversely affect their reporting frequency and timeliness: OOH price indices are currently published once a quarter with a delay of around 100 days, whereas the full set of HICP data is published at monthly frequency with a delay of around two weeks.[12] Moreover, in principle, the HICP should capture changes in prices of consumer goods and services rather than changes in asset prices. However, an owner-occupied residential property is not only a consumption good, but also an asset that both serves as a store of wealth and provides a flow of consumable housing services. OOHPIs include such an asset component. Hence, the partial inclusion of asset price developments via OOHPIs in the HICP might be problematic.
In the monetary policy strategy review, the Governing Council discussed the treatment of OOH-related costs under the rental equivalence approach and the net acquisition approach.[13] The review focused on the statistical features of these OOH treatments in the HICP and their potential implications for monetary policy, including communication aspects. The user cost approach and the payments approach were not considered suitable, mainly owing to their inclusion of interest payments, which would establish a direct link to the ECB’s policy rates.
The rental equivalence approach relies on the dual role households have with respect to OOH, as both consumers and producers of a flow of housing services. Where households own the dwelling they live in, there is only a shadow price of the housing services (shelter) produced and consumed. The rental equivalence approach can be thought of as measuring the opportunity cost related to living in a dwelling rather than renting it out. In national accounts, OOH is usually quantified by imputing rents in order to measure the contribution it makes to gross domestic product (GDP).[14]
The acquisition approach records the purchase of a dwelling in the same way as the purchase of a durable consumer good. The acquisition approach accounts for OOH at the time of purchase rather than over the period of time that housing services are provided to owner-occupiers living in their own dwellings. The net acquisition approach thus treats OOH in the same way as any other durable consumption good (e.g. cars, furniture). OOHPIs cover purchases of dwellings bought for the first time by the household sector, which are primarily new dwellings bought from developers or self-built. Already existing houses and flats bought for owner-occupation from other institutional sectors, for example from the public sector, are also included, while sales of residential dwellings by households to non-households are deducted. Overall, since OOHPIs do not cover household-to-household sales of residential dwellings, OOHPIs tend to be less volatile than house price indices (see Chart 2). This is due to two reasons: (i) house price indices represent changes in the prices of all purchases of houses and flats by households, including secondary market transactions; and (ii) OOHPIs include other less volatile costs of OOH, such as insurance, major repairs and maintenance costs. Both the narrow coverage of dwelling purchases in OOHPIs and the impact of additional components should be highlighted, in particular with respect to different results compared to the familiar price dynamics of overall housing markets. Potential approaches aimed at mitigating the impact of asset price dynamics in OOHPIs would imply that the resulting modified indices may deviate even further from house price indices.
Following the ECB’s monetary policy strategy review, the Governing Council recommended the net acquisition approach for the inclusion of OOH-related costs in the HICP. A more comprehensive inclusion of costs related to OOH in the HICP would better represent the inflation rate that is relevant for households. Although costs related to shelter account for a large part of household expenditure, the HICP currently only partially includes homeowners’ OOH-related costs. The net acquisition approach, based on the transaction prices that households actually pay for the acquisition of homes, is the method preferred by the Governing Council for a broad inclusion of OOH-related costs. However, OOH price indices measured using the net acquisition approach currently include an element of investment, while it is the consumption component that is relevant for monetary policy. Hence, the compilation of OOHPIs needs to focus more on the consumption element rather than on asset prices. Improvements in the reporting frequency and timeliness of OOHPIs would also be desirable.
Box 1
International practices in the treatment of owner-occupied housing in consumer price indices
Internationally, there is considerable variation in the way OOH is treated in CPIs, including price indices used as price stability measures by central banks (Table A). In most of the cases presented in Table A, the “rental equivalence approach” is used when OOH is included. Australia and New Zealand apply the “net acquisition approach” in their quarterly CPIs. In the EU, acquisition-based OOHPIs are published as quarterly stand-alone indices. Canada, Iceland and Sweden (in its national CPI) quantify OOH on the basis of the “user cost approach”; the respective central banks also refer to these indices for their monetary policy. The user cost approach includes mortgage interest payments, depreciation and recurring costs. While capital gains/losses and opportunity costs are, in theory, elements of comprehensive user costs, appreciation and depreciation of housing assets over time are, in practice, not included in CPI implementations of the user cost approach. Opportunity costs with respect to alternative investments (e.g. in stocks) are either excluded (Canada, Sweden) or proxied. Finally, the payments approach covers mortgage interest payments, costs such as legal and real estate agency fees, and running costs. The payments approach is (or was) applied in two national CPIs (Ireland and, until 2019 for flats, Austria) and as an alternative stand-alone OOH measure in the United Kingdom.
Table A
Treatment of OOH in CPIs of selected countries
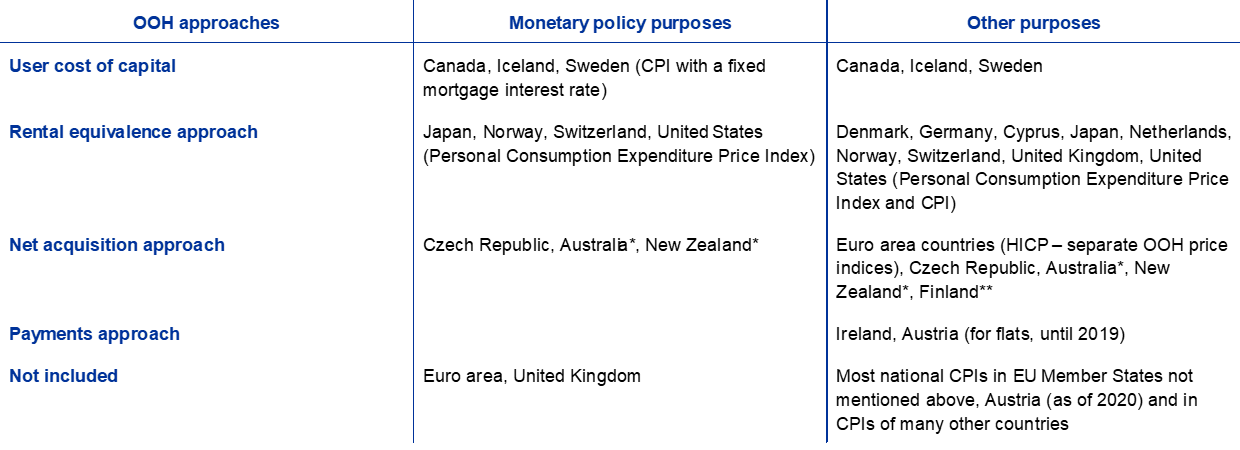
Source: “Inflation measurement and its assessment in the ECB’s monetary policy strategy review”, op. cit., p. 49, updated with more recent information.
Notes: Where EU Member States are mentioned explicitly, the reference is to the national CPI and not to the HICP. * CPIs provided at quarterly frequency.
** Updated monthly with a proxy index.
Both Australia and New Zealand apply the net acquisition approach to OOH in a similar way: OOH price indices are primarily based on selling prices of newly built standardised houses, excluding the price of the land.[15] The rental equivalence approach is used in Japan and the United States (in both cases also for monetary policy purposes) and in the United Kingdom. Its implementation in the US CPI shows how demanding the calculations of rental equivalents can be when striving for advanced representativeness of OOH costs: owners’ equivalent rent (OER) in the United States is based on price information which differs from the data used for compiling the price index for actual rents. “Economic rent”, which is used for the price index of actual rents, includes utilities provided by the landlord, while such utilities are excluded from the “pure rent” used for OER.[16] The overall weights, for actual and imputed rents, are derived from the US Consumer Expenditure Survey, which asks tenants to report the rent they actually pay and homeowners for a hypothetical rent they would charge a tenant.[17] The weights derived for each stratum of the residential housing stock take into account the number of tenants and homeowners in the respective area.[18] The US approach to OER suggests that a simple adjustment of the total weights of actual rents to cover actual and imputed rents may not lead to sufficiently representative results. The Personal Consumption Expenditures (PCE) price index (the main inflation measure used by the Federal Reserve System for monetary policy purposes) uses the same price data as the OER in the US CPI but gives far lower weight to imputed rents than the US CPI. This is due to differences in scope, as the PCE price index covers a larger amount of expenditure related to household consumption (including expenditure households do not pay for themselves, like state education) and different data sources for weights (the Consumer Expenditure Survey for the CPI and national accounts data for the PCE price index).[19]
In the United Kingdom, the Office for National Statistics (ONS) also includes imputed rents in the Consumer Prices Index including owner occupiers’ housing costs (CPIH). However, for monetary policy purposes, the Bank of England uses the CPI, which excludes OOH. The ONS publishes three alternative stand-alone OOH indices based on the rental equivalence, net acquisition and payments approaches.[20] A comparison of these three OOH indices reveals large divergences in price developments (Chart A). While the rental equivalence-based price index exhibits fairly stable growth over time, pronounced volatility can be seen in the price dynamics of the acquisition-based OOHPI, and especially in the price index using the payments approach.
Chart A
UK OOH price indices according to the net acquisition, payments and rental equivalence approaches
(index: January 2005 = 100)

Source: Office for National Statistics.
Canada and Sweden apply variants of the user cost approach in their CPIs. Both encompass depreciation and interest payments but exclude opportunity costs and capital gains. As including interest rates might imply the risk of a self-induced monetary policy, Statistics Sweden compiles a CPI which keeps interest rates fixed over time (CPIF) for Sveriges Riksbank. Canada’s user cost approach estimates the actual profile of interest payments with respect to active mortgage contracts and the prices of houses and flats whose purchase has been financed by those contracts. This long-term perspective involves a representation of house price developments over a 25-year period.[21]
3 The ECB’s new analytical quarterly index based on the net acquisition approach
New analytical index combining HICPs and OOH price indices
New analytical quarterly indices compiled by ECB staff combine HICPs and OOHPIs, for the euro area and euro area countries, on the basis of publicly available data. The monetary policy strategy review laid down a roadmap for the integration of an OOHPI into the HICP.[22] The first step is to combine quarterly OOHPIs (which include an asset price component) with HICPs. ECB staff prepared analytical compilations for all euro area countries except Greece[23] and for the euro area as a whole. These analytical indices will be used primarily for internal purposes until experimental indices are published by the ESS (Eurostat and the statistical offices of the EU carry out their work independently of the ECB’s internal deliberations). OOHPI expenditure weights, which need to be approximated in these new staff calculations, have been derived primarily from national accounts data.[24] Only published statistics have been used; detailed expenditure data (in EUR millions), broken down by OOHPI component, are not yet publicly available. Therefore, the calculations have to use some proxies, with “gross fixed capital formation”[25] for new residential dwellings being the main public data from which other expenditures have been deduced. HICPs combined with OOHPIs are compiled as quarterly chain-linked Laspeyres-type indices; weights are price-updated according to HICP methodology.[26]
Over the last ten years, based on our preliminary staff calculations, the euro area HICP combined with the OOHPI has exhibited inflation rates that do not differ greatly from those of the HICP without OOH-related costs (Chart 3). Since 2011, the difference between the euro area HICP with and without OOH has been limited, with the largest difference being 0.3 percentage points. Since headline inflation includes some very volatile items that might not provide information on the medium-term outlook, it is customary, for monetary policy purposes, to also look at exclusion measures that approximate underlying inflation, a prominent example being the HICP excluding food and energy (HICPX). Combining them with the OOHPI also affects the outcome of such exclusion measures for underlying inflation, partly because the relative weight of the OOHPI is higher in inflation rates that exclude certain expenditures. The difference in the inflation rate for the euro area HICPX, in particular in recent years, but also in the first half of 2012, has been more pronounced. The largest difference was around 0.4-0.6 percentage points in the second and third quarter of 2021 when HICP inflation (excluding OOH) was still influenced by coronavirus (COVID-19) pandemic-related factors. From 2012 to 2020, however, differences did not exceed 0.3 percentage points in absolute terms, including when the inclusion of OOHPI changes lowered the rates of change of the combined index. More generally, the properties of combined indices with respect to the business, housing market, construction and financial cycles need to be assessed more comprehensively as soon as longer time series with official OOHPI data become available.
Chart 3
New combined analytical index including OOH according to the net acquisition approach: preliminary results from ECB staff calculations
(left-hand scale: annual percentage changes; right-hand scale: percentage point differences)
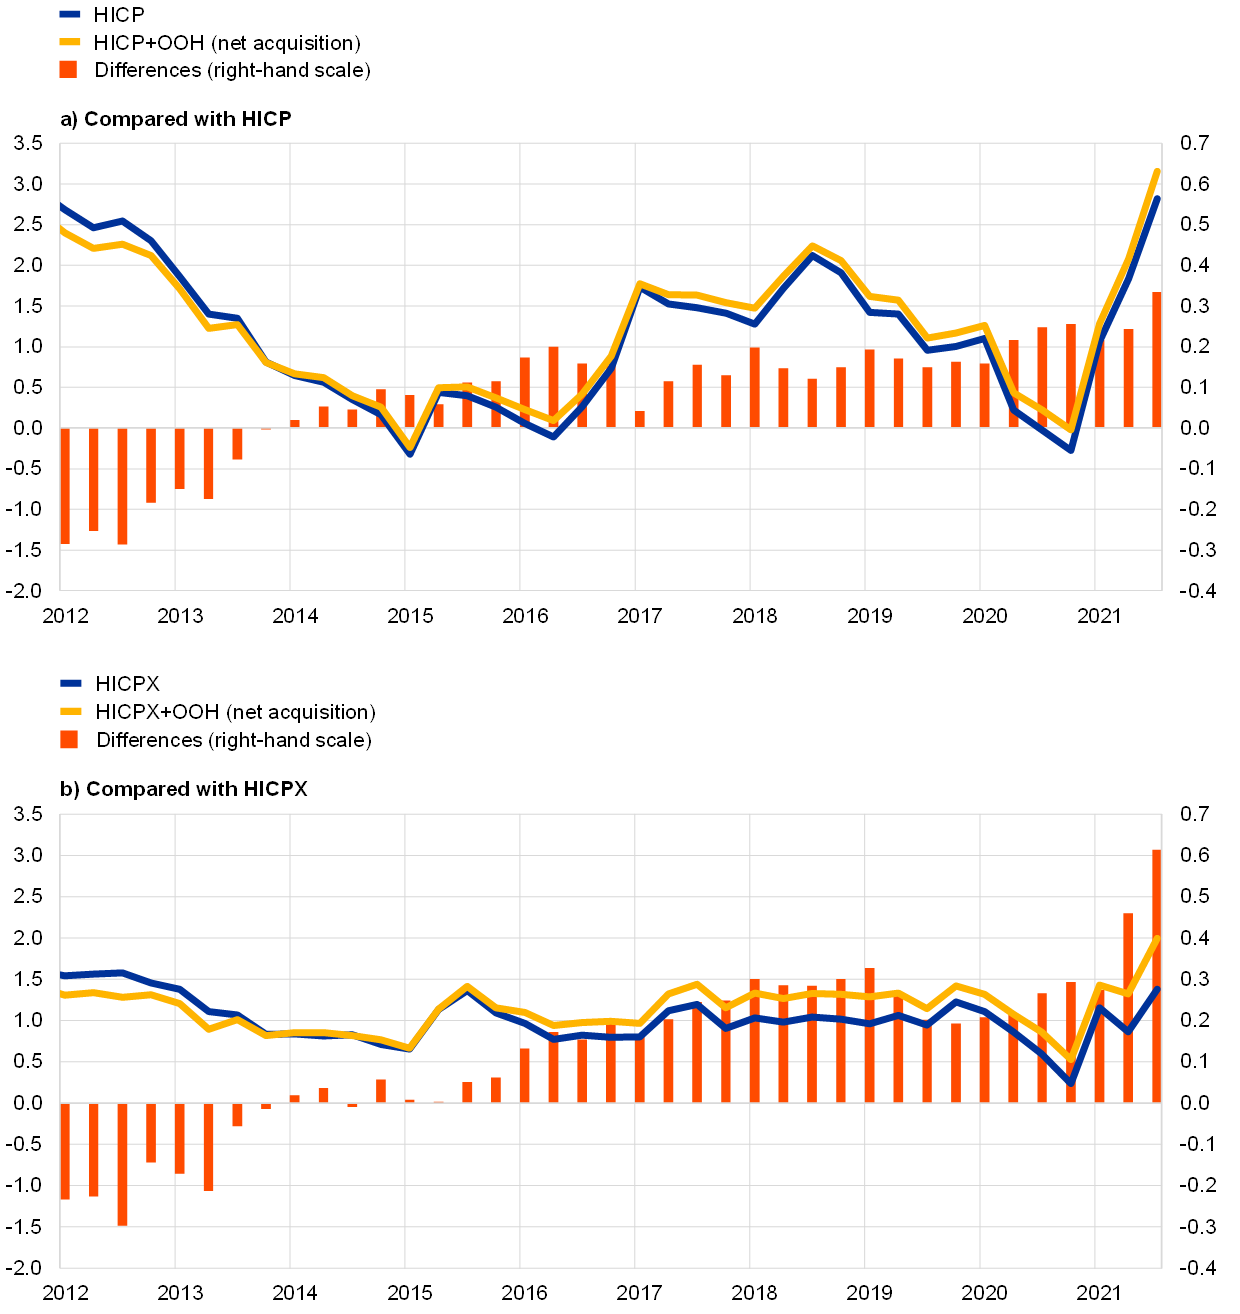
Sources: Eurostat and ECB calculations.
Comparison with the rental equivalence approach
In the monetary policy strategy review, the net acquisition and rental equivalence approaches were compared on the basis of preliminary estimates by ECB staff. ECB approximations of imputed rents for OOH were directly derived from the HICP price index for actual housing rentals. The respective weight attached to the imputed-rent OOH index in the combined HICP was derived from national accounts data on imputed rents included in household consumption statistics.
When included in euro area headline inflation, the absolute impact of both the net acquisition approach and the rental equivalence approach is limited; however, the impacts are qualitatively different. The combined index with net acquisition OOHPIs amplifies the cyclicality, whereas the measure using the rental equivalence indices dampens cyclical movements. Chart 4 shows that the impact on inflation of adding OOH in the form of imputed rents tends to be very small and is, unlike the net acquisition approach, mostly countercyclical. The results for the HICPX (panel b) are very similar to those for headline inflation (panel a), with the impact on the HICPX being slightly larger. The small size of these differences in inflation rates is mainly due to the low volatility of rent inflation (see Chart 2).
Chart 4
Index using the rental equivalence approach to OOH
(left-hand scale: annual percentage changes; right-hand scale: percentage point differences)

Sources: Eurostat and ECB calculations.
Based on preliminary ECB estimates using data since 2011, aggregate euro area acquisition-based weights have not been substantially more volatile than weights of imputed rents. A possible concern in relation to the use of the net acquisition approach is that OOHPI weights could vary substantially over time, which could imply a potential upward bias in average inflation reflected in a combined index, related to the typical patterns of housing market cycles in combination with the HICP requirement to update expenditure weights on an annual basis.[27] Chart 5, panel a, compares net acquisition weights based on ECB estimates (deduced from gross fixed capital formation in EUR billions and Eurostat’s relative OOHPI sub-index weights) for the euro area and national accounts imputed rents in the form of price-updated relative expenditure shares.[28] For the years from 2011 to 2020, the variation coefficient of net acquisition weights was 0.044, compared to a coefficient of 0.025 for weights according to imputed rents; the minimum value of net-acquisition weights was 8.3% and the maximum 9.5%.[29] In individual countries, however, larger volatility over time in OOHPI weights is more likely to appear, in particular where construction cycles are pronounced. During the COVID-19 crisis, such sharp movements appeared in several countries (including France and Italy). While it is not yet known how national statistical offices would make net acquisition weights representative for the respective previous year – in line with OOHPI standards – ECB staff estimates shown in Chart 5, panel b, suggest that periods of significant changes over time in net acquisition weights may differ from periods in which shares of imputed rents change. Hence, when looking at the impact of combining the HICP with OOH costs quantified according to the net acquisition approach compared to the HICP to which imputed rents are added, differences in the compilation of the respective weights may also play a role.[30]
Chart 5
Comparison of the OOHPI weight in the HICP according to the imputed rents and net acquisition approaches
(panel a: percentages; panel b: standardised units)

Sources: Eurostat and ECB calculations.
Note: Standardised deviations shown in panel b are deviations from the average, divided by the standard deviation, over the period from 2011 to 2020.
Implications for cross-country variability and contributions of combining OOHPIs with HICPs
Overall, according to the ECB’s preliminary estimates, inflation dispersion across countries seems not to be significantly affected by the inclusion of OOHPIs. Chart 6 shows minimum and maximum inflation across euro area countries for each quarter since 2012, both for HICPs and for the new indices that include OOHPIs. Differences between the ranges of the two measures seem to be very small, both for headline and for HICPX inflation. Chart 7 plots the standard deviations of inflation across countries for both the HICP and the HICPX. In line with Chart 6, the impact of the inclusion of OOH on overall inflation dispersion seems to be limited.
Chart 6
HICPs combined with OOHPIs in euro area countries – minimum-maximum range[31]
(annual percentage changes)

Sources: Eurostat and ECB calculations.
Note: Panels a and b show the range of HICP and HICPX inflation rates across euro area countries when OOH is added (grey) and when OOH is not added (dark blue). Where the ranges overlap, the shading is light blue.
Chart 7
HICPs combined with OOHPIs in euro area countries – standard deviation
(percentage points)

Sources: Eurostat and ECB calculations.
Owing to the potential for housing market cycles to have specific effects on overall HICP inflation when OOHPIs are added, such dynamics need to be identified, monitored and forecast. Inflation analyses conducted at the ECB will be broadened and deepened in this respect. Currently available time series are often not long enough to allow an extended analysis of the cyclical properties of euro area countries’ housing markets before 2011. However, some insights can be inferred from developments in the 2000s. According to internal ECB estimates, the rapid house price increases in several euro area countries leading up to the global financial crisis in 2008 would not have been very prominently reflected in euro area HICP inflation if OOH had been added because there were offsetting subdued movements in house prices in other euro area countries.
In the period since 2012, the overall difference between euro area HICP inflation and changes in the HICP combined with the OOHPI was primarily driven by developments in a few countries. Chart 8 shows the contributions of individual countries to the difference. In 2012 and 2013 the difference largely related to developments in Spain. Since then, the drivers of the difference in euro area inflation when the OOHPI is added to the HICP have been more evenly spread across euro area countries. However, developments in the last few quarters are mostly explained by the sharp increase in Germany.
Chart 8
Contributions to the difference between euro area HICP inflation and changes in the HICP combined with the OOHPI
Country contributions to euro area differences
(percentage points and percentage point contributions)

Sources: Eurostat and ECB calculations.
OOHPI developments often relate to drivers of residential property prices that may vary from country to country. Financing (i.e. mortgages) is an important driver of OOH transaction prices, playing a much larger role than it does for durable consumer goods like cars and furniture. The role of housing as an investment opportunity may also change over time depending on how risk-return profiles evolve across different asset classes. Supply-side restrictions, such as the limited availability of building land, are also a common driver of house price inflation and therefore OOHPIs. Medium to longer-term developments, such as demographic and socio-economic changes (e.g. number of persons in households and age structure), potentially have a more lasting impact on housing costs and thus also on OOHPIs.
4 Challenges ahead: towards OOHPI integration into the HICP
The quarterly provision of OOHPIs by the ESS has been an important achievement on the way towards more comprehensive coverage of households’ housing expenditure in HICPs for the euro area and euro area countries. However, full integration of OOHPIs into HICPs requires monthly and timely reporting. Furthermore, in order to use a euro area HICP in which OOH is firmly integrated for monetary policy purposes, the issue that OOHPIs currently include an element of investment needs to be addressed. The ECB supports further research projects on optimal measurement methods. These should be aimed at better isolating the consumption component from the investment component, with the former being the relevant component for monetary policy.
In its monetary policy strategy review, the Governing Council outlined a roadmap for progress on OOHPIs. With the ESS as the main actor, four milestones could be considered: (i) the provision of quarterly HICPs combined with OOHPIs as analytical ECB indices (presented in this article); (ii) the provision of an experimental index by the ESS, expected during 2023 – the ESS will decide about this independently of the ECB’s internal deliberations; (iii) the adaptation of the HICP legal framework in order to make quarterly HICPs combined with OOHPIs official statistics, expected not earlier than 2026; and (iv) the integration of OOH-related costs into the HICP, at a monthly frequency and in a timely manner, which could pave the way for moving to an HICP including OOH-related costs as the main index for monetary policy purposes.
The ESS is working on advancing and adapting the OOHPI legal acts. The forthcoming OOHPI Implementing Regulation, which will lay down revised and extended requirements for the compilation of quarterly OOHPIs by statistical offices in the EU, is expected to enter into force in the second half of 2022, to be applied by national statistical offices as of January 2024. In order to make OOHPIs combined with HICPs official statistics, however, the HICP Framework Regulation[32] needs to be amended. Depending on how the work of the ESS progresses, the process of updating this Regulation with respect to OOHPIs will take time.
In the process of including OOHPIs in HICPs, the ECB will investigate in detail the properties of these indices. The ECB will closely follow the statistical progress in compiling OOHPIs and combined indices, both in terms of methods and the adaptation of the legal framework underlying HICPs and OOHPIs. Statistical features of new OOHPI developments have to be assessed comprehensively, in particular with regard to their impact on the use of such indicators for the purposes of the ECB’s monetary policy.
The features of OOHPIs also have to be analysed in terms of the statistical quality of the indices, in particular with respect to regular data revisions. An important aspect is that, when they are released, OOHPI data only represent preliminary results. Unlike HICPs, OOHPIs are frequently revised as more data become available for the respective reference periods. Therefore, the use of OOHPIs has to address the greater statistical uncertainty surrounding OOHPI data for recent reporting periods.
Follow-up work is being planned within the Eurosystem to forecast OOH price indices. This is a challenging exercise given that the asset price component of OOHPIs (as opposed to the construction cost component) is not of the same type as for other cyclical indicators.
The feasibility of disentangling the consumption and investment components of OOHPIs rests on achieving a common interpretation and on designing a treatment that can be implemented in practice. As yet there is no unanimous agreement on what consumption and investment are in households’ purchases of dwellings, which is a large component of OOHPIs, and this issue affects both price changes and weights. For the calculations in this article, “gross prices” and “net weights” have been used, as implemented in the ESS compilations of OOHPIs. Gross prices are actual transaction prices. Dwellings acquired by households for rental purposes (an investment) are disregarded in OOHPI prices and weights. Expenditures on land (a non-produced asset) are only excluded from net acquisition weights. The OOH price index for newly purchased dwellings, however, reflects changes in prices which include the price of land (the gross price), while the price index for self-built dwellings disregards land prices. Further refinements of what is included and excluded in weights and price indices would require a common understanding of what is considered consumption and what is considered investment, including in relation to the treatment of land.
The compilation of monthly OOHPIs is statistically challenging. Using transaction prices for new dwellings requires a sufficient amount of transactions to be recorded in each reporting period. On a monthly basis, however, the number of transactions may be low, in particular in small countries. In addition, reporting delays, which already adversely affect the quarterly reporting of housing transactions, are even more relevant when the recording is conducted on a monthly basis.
Further research is required on the compilation of OOHPIs that are both monthly and timely. It is very likely that both aspects require the application of methods that have not yet been established in HICPs. This calls for an innovative but careful approach in view of the potential implications for compilation practices and index uses.
Long-term research projects conducted jointly with the ESS, the International Monetary Fund (IMF) and the Organisation for Economic Co-operation and Development (OECD) could shed more light on optimal measurement methods. Research projects should be promoted, in particular with the aim of better isolating the asset component of net acquisition-based OOH price indices. Overall, the integration of OOHPIs into the HICP is a long-term project, with the ESS as the main actor. Given the challenges ahead, statistical activities will be supported by the Eurosystem where appropriate, in the form of regular user feedback.
During the transition period the main reference index for monetary policy will remain the current HICP. This transition period will last until the OOHPI has reached the standards of timeliness and quality necessary for full integration into the monthly HICP. In the meantime, recognising that the full inclusion of owner-occupied housing in the HICP is a multi-year project, the Governing Council will, for the purpose of its monetary policy assessments, include inflation measures that take into account initial estimates of the cost of owner-occupied housing in its wider set of supplementary inflation indicators.
- For a more technical exposition, see Ganoulis, I. et al. “Owner-occupied housing and inflation measurement”, Statistical Paper Series, ECB, forthcoming.
- The ESS comprises Eurostat and the statistical offices of EU Member States.
- Purchases of residential dwellings by households in order to let them to other households are intended to generate income. Such investments are outside the scope of consumption expenditure in the HICP.
- Even though these transactions may imply large re-distributional and inter-generational effects among households.
- In practice, however, such sales are rare.
- See the ECB Listens Portal.
- See Consumer Price Index Manual: Concepts and Methods, International Monetary Fund, 2020,
pp. 3-4. - In the HICP, prices for services like package holidays are taken into account at the point in time when the provision of the service may commence.
- The long HICP time series for actual rentals for housing includes other actual rentals, e.g. rentals actually paid for secondary residences.
- According to the long time series of the ECB’s residential property price index. Data for the fourth quarter of 2021 were not available at the time of publication of this article. The 20-year average includes an estimate for that quarter.
- It should be noted that housing cycles are connected more to financial cycles than to economic cycles, and to the extent these diverge from each other the degree of cyclicality that eventually materialises in OOHPIs could vary. Nevertheless, in the current sample, the euro area OOHPI and house price index exhibit a high degree of co-cyclicality.
- HICP flash estimates are published at the end of each reporting month, followed by a release with a full breakdown by consumption purpose and by product category around two weeks later.
- For details, see “Inflation measurement and its assessment in the ECB’s monetary policy strategy review”, Occasional Paper Series, No 265, ECB, September 2021.
- In national accounts, own-account production of housing services by owner-occupiers is recorded as production of households. This production, however, cannot be observed or recorded directly. Therefore, the production value of this service is quantified in the national accounts either by applying the rental equivalence approach or (in some cases, such as when rental markets are unrepresentative for OOH markets, e.g. when they are very thin) by using the sum of costs of households’ own production of housing services.
- Eiglsperger, M. and Goldhammer, B., “Consumer price indices, owner-occupied housing and measures of underlying inflation in monetary policy of selected central banks”, paper prepared for the “Meeting of the Group of Experts on Consumer Price Indices”, 7-9 May 2018, Geneva, Switzerland, corrected version, August 2018, pp. 10 and 12.
- Ptacek, F., “Updating the rent sample for the CPI Housing Survey”, Monthly Labor Review, Bureau of Labor Statistics, August 2013, pp. 9-10.
- “How the CPI measures price change of Owners’ equivalent rent of primary residence (OER) and Rent of primary residence (Rent)”, CPI Factsheets, Bureau of Labor Statistics, April 2009, pp. 1-2.
- Ptacek, F., op. cit., pp. 10-11.
- Johnson, N., “A comparison of PCE and CPI: Methodological Differences in U.S. Inflation Calculation and their Implications”, Bureau of Labor Statistics, 2017.
- See, for example, “Measures of owner occupier’s housing costs, UK: January to March 2020”, Office for National Statistics, 2020. The release of 17 June 2020 indicates a release date of 16 June 2021 for the next release, but publication has been delayed. The next publication date is not yet known. Data up to December 2020 can be found in “Measures of owner occupiers' housing costs”, Office for National Statistics, 2021.
- See Xu, A., Yélou, C. and Soumare, A., “New approach for estimating the mortgage interest cost index”, Prices Analytical Series, Statistics Canada, November 2017.
- See “An overview of the ECB’s monetary policy strategy”, ECB, 2021.
- The OOHPI for Greece has not yet been provided by the Greek statistical office.
- During the monetary policy strategy review, internal ECB calculations for combining HICPs and OOHPIs referred to proxy weights of OOHPIs on the basis of national accounts data for imputed rents. The results of these calculations are shown, for example, in “Inflation measurement and its assessment in the ECB’s monetary policy strategy review”, op. cit., pp. 48-65.
- These national accounts data represent expenditures for the purchase of new residential dwellings, excluding the cost of the land.
- For more details on HICP methodology, see Harmonised Index of Consumer Prices (HICP) – Methodological Manual, Eurostat, November 2018.
- See Whelan, K., “How Should Housing Be Treated in the HICP? – In-Depth Analysis Requested by the ECON Committee”, Monetary Dialogue Papers, European Parliament, November 2021, pp. 12-13. Since OOHPI weights are to be compiled according to the same concepts as HICP weights, OOHPI weights are intended to represent expenditure patterns of the previous year, with the main data taken from the year before that.
- Details of the compilation of these weights are presented in Ganoulis et al., op. cit.
- Mean: 8.8%; standard deviation: 0.39 percentage points.
- During the monetary policy strategy review, however, ECB staff calculations for combining HICPs with OOHPIs on the one hand and with imputed rents on the other referred to the same proxy weights of OOH as an HICP component. These weights were derived from national accounts data for imputed rents. The results of these calculations are shown, for example, in “Inflation measurement and its assessment in the ECB’s monetary policy strategy review”, op. cit., pp. 48-65. See also footnote 24.
- The OOHPI for Greece is not available. In the euro area HICP combined with the OOHPI, the HICP for Greece is included.
- Regulation (EU) 2016/792 of the European Parliament and of the Council of 11 May 2016 on harmonised indices of consumer prices and the house price index, and repealing Council Regulation (EC) No 2494/95 (OJ L 135, 24.5.2016, p. 1).