
- SPEECH
The ECB’s monetary policy in the pandemic: meeting the challenge
Speech by Philip R. Lane, Member of the Executive Board of the ECB, at the 62nd NABE Annual Meeting “Global Reset? Economics, Business, and Policy in the Pandemic”
6 October 2020
I will provide a brief assessment of the macroeconomic outlook, discuss the ECB’s monetary policy response to the pandemic crisis and explain our current monetary policy challenge.[1]
The macroeconomic outlook
We expect about half of the cumulative decline in output in the first half of the year to have been reversed during the third quarter. Compared with the trough, this initial recovery phase is visible across a wide range of economic indicators.[2]
That said, the euro area economy is still operating far below its pre-pandemic level. While this in part can be attributed to ongoing supply-side interruptions, the speed of the recovery is also held back by a lack of buoyancy in demand conditions.[3] Meanwhile, the resurgence in infection rates (and the associated public health measures) is posing renewed challenges, especially for those sectors most affected by social distancing. Reflecting this, the momentum in the services sector has been slowing down since August, while the services business activity PMI fell back into contractionary territory in September. As a result, given the importance of services to the euro area economy, the euro area composite PMI also declined, even if it remained in expansionary territory at 50.4.[4]
In this environment, many households are uncertain about future employment and wage dynamics, motivating them to save more for precautionary purposes. Similarly, firms are uncertain about future demand for their products and are grappling with weakened balance sheets, leading to cancellations and delays in investment plans.
Chart 1 shows that services sector activity has been disproportionately hit (also when compared with the global financial crisis). This asymmetry also implies that countries have been differently affected by the pandemic, depending on the degree of reliance on the services sector, including the tourism, travel and entertainment sectors that are especially affected by social distancing and containment measures.
Chart 1
Sectoral gross value added
(quarter-on-quarter percentage changes, percentage point contributions)

Sources: Haver and ECB staff calculations.
Notes: Aggregation based on data for Germany, Spain, France, Italy and the Netherlands. The latest observations are for the second quarter of 2020.
This assessment underpins the baseline scenario of the September ECB staff macroeconomic projections. Despite the recovery in the second half of the year, output at the end of 2020 is projected to remain about 5.2 percent below the level of output at the end of 2019. Economic activity is foreseen to return to pre-pandemic levels only towards the end of 2022, with output expected to expand by 5.0 percent in 2021 and 3.2 percent in 2022. In any event, the range of possible outcomes in the projections remains very wide. This is illustrated by the alternative projection scenarios (the baseline projection is flanked by mild and severe scenarios), as shown in Chart 2. In view of the uncertain economic and financial outcomes of the pandemic, the balance of risks is tilted to the downside.
Chart 2
Realised and projected output
(indexed real GDP, Q4 2019 = 100)
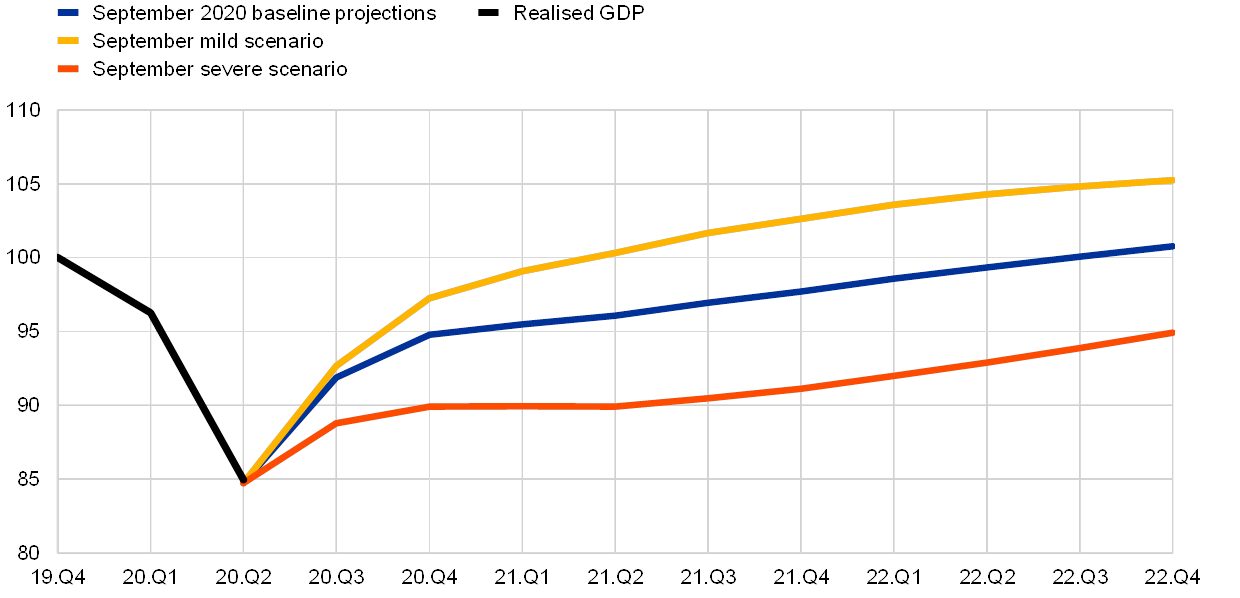
Sources: ECB staff macroeconomic projections and Eurostat.
Notes: The projections refer to the September 2020 ECB staff macroeconomic projections. The latest observations are for the second quarter of 2020 for realised data and the fourth quarter of 2022 for projections.
The pandemic shock has left its mark on inflation dynamics. Euro area HICP inflation has been declining for several months: after turning negative to minus 0.2 percent in August, the flash estimate for September signals a further decline to minus 0.3 percent in September. While some temporary factors (such as the time-limited VAT cut in Germany) have contributed to this sharp decline, the drop in inflation also reflects weaker underlying pricing pressures across both the goods and services sectors. We expect headline inflation to remain negative for the remainder of the year, before returning to positive territory in early 2021. The elevated level of economic slack, weak energy inflation and the recent appreciation of the euro are expected to continue to act as headwinds, such that our baseline projections expect average headline inflation only to gradually rise towards 1.0 percent in 2021 and 1.3 percent in 2022 (Chart 3). In parallel to the general economic outlook, there is considerable uncertainty surrounding this baseline projection, as indicated by the range of inflation outcomes that are spanned by the mild and severe scenarios for the inflation outlook in Chart 3. I will turn to the implications of the inflation outlook for monetary policy later in this speech.
Chart 3
Realised and projected headline inflation
(annual percentage changes)
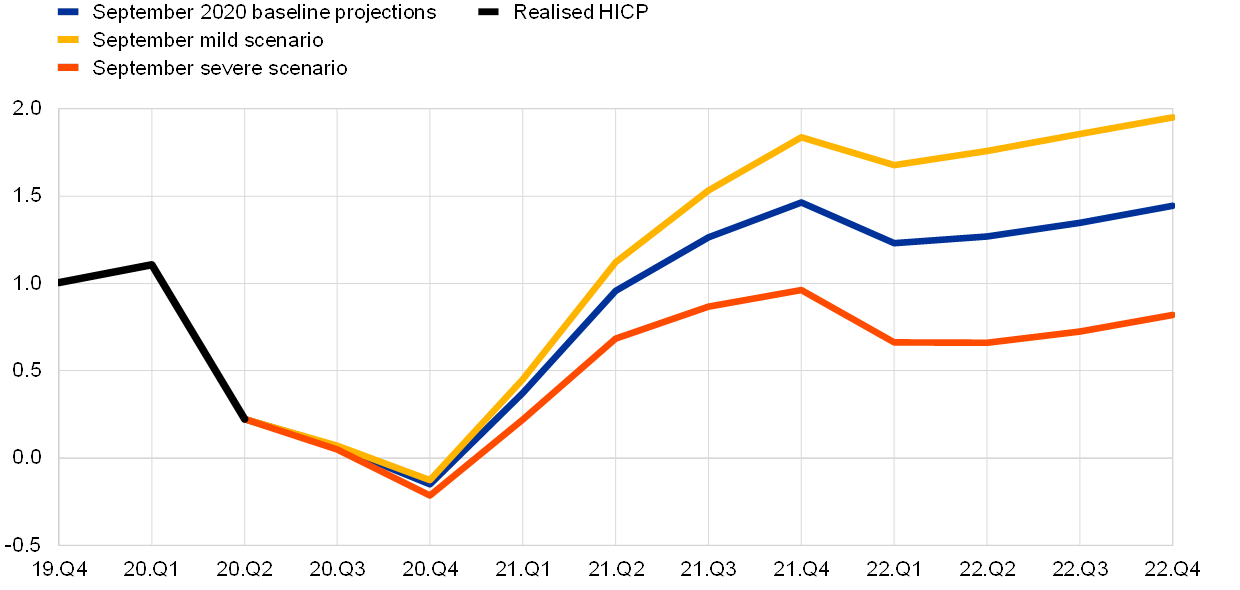
Sources: ECB staff macroeconomic projections and Eurostat.
Notes: The projections refer to the September 2020 ECB staff macroeconomic projections. The latest observations are for the second quarter of 2020 for realised data and the fourth quarter of 2022 for projections.
The monetary policy response
An accommodative monetary policy configuration was already in place before the pandemic: in September 2019, the main policy rate (the deposit facility rate) was lowered to minus 0.5 percent and there was a resumption of net asset purchases at a rate of €20 billion per month under our baseline asset purchase programme (APP), with these measures reinforced by forward guidance that ties future monetary policy to the inflation outlook. In addition, credit supply was supported by the third series of targeted longer-term refinancing operations (the TLTRO III programme).
In the initial response to the pandemic crisis, we adopted a comprehensive package of complementary measures, which are illustrated in Chart 4.[5] Central elements included the escalation of asset purchases through the decision to add an extra €120 billion to the running APP and the launch of the specially-designed pandemic emergency purchase programme (PEPP), a revision in the structure and pricing of the TLTRO III programme, the easing of the collateral framework and a set of supervisory measures (taken by the supervisory wing of the ECB). In combination with the forceful fiscal responses at national and EU level, these measures have been successful in stabilising financial markets and protecting credit supply. The additional quantitative easing provided by the PEPP programme also eases the overall monetary stance, acting to reduce economic slack and boost inflation dynamics over the medium term.
Chart 4
ECB measures since the start of the pandemic

Source: ECB staff.
Notes: *The interest rates on the lending programmes are linked to the key ECB interest rates. The lending performance for the temporary rate reduction of TLTROs is targeted towards the pandemic period. The ECB reconfirmed its forward guidance on the path of policy interest rates and the APP throughout this period.
With the launch of the PEPP, our range of monetary policy measures currently consists of four main instruments: (a) the setting of our policy rates (with the deposit facility rate as the primary current margin); (b) the baseline asset purchase programme (APP); (c) the pandemic-specific temporary asset purchase programme (PEPP); and (d) the TLTRO III programme.
Our forward guidance about the future setting of our policy measures plays a central role in determining our overall monetary stance. In relation to our policy rates, our current forward guidance links future rate-setting to the inflation outlook; in turn, net purchases and reinvestment under the APP are linked to the rate path.[6]
The temporary nature of the PEPP means that the forward guidance is connected to the pandemic: net asset purchases will continue until at least the end of June 2021 and, in any case, until the Governing Council judges that the coronavirus crisis phase is over; reinvestment will be maintained until at least the end of 2022 and, in any case, the future roll-off of the PEPP portfolio will be managed to avoid interference with the appropriate monetary policy stance.
In terms of interest rate policy, the Governing Council expects to keep policy rates at their current or lower levels until we have seen the inflation outlook robustly converge to our inflation aim within our projection horizon, and such convergence has been consistently reflected in underlying inflation dynamics. The concept of robust convergence signals that we require a high degree of confidence that the inflation outlook has durably approached the inflation aim, while the condition that convergence should also be evident in realised underlying inflation means that future rate tightening will not run ahead of the hard data in terms of the out-turns for underlying inflation. Given this “double hurdle” set of conditions, our forward guidance represents a strong commitment to keep financial conditions at highly accommodative levels for as long as necessary to lift inflation to our inflation aim in a sustainable fashion.
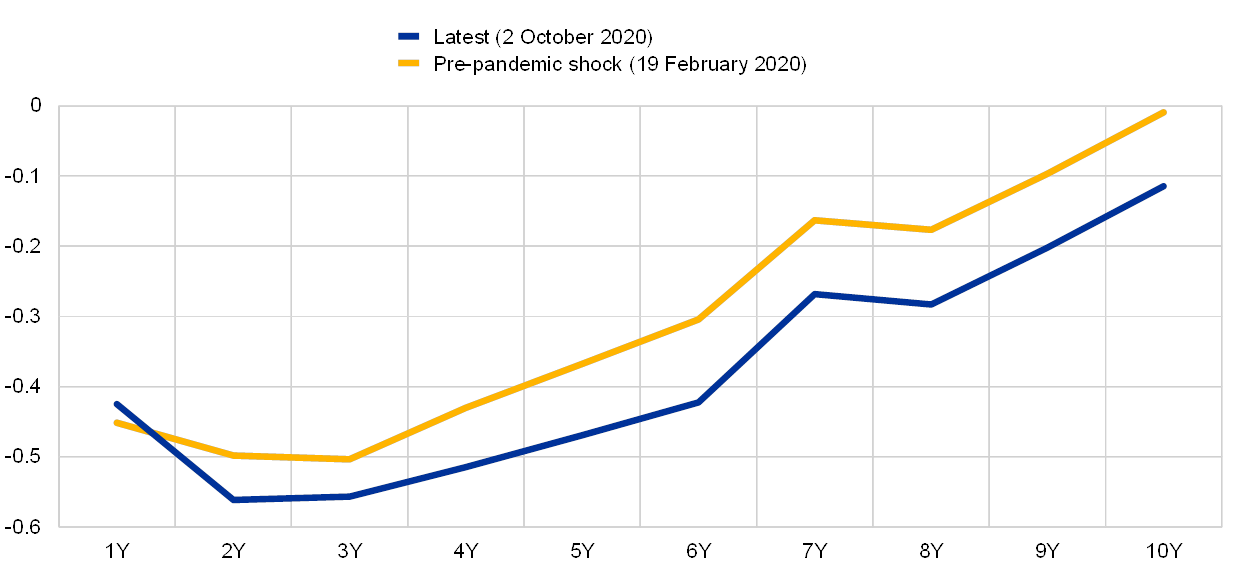
In line with our forward guidance, market-based expectations of future policy rates and the future path of the APP have adjusted in response to changes to the inflation outlook. Compared to September 2019, Chart 5 shows that the date of the policy rate lift-off implicit in the EONIA forward curve – the term structure of expectations for the overnight rate (and associated risk premia) – has shifted from December 2022 to August 2024. Similarly, market surveys have shown a similar outward shift for the expected end date of net purchases under the APP. Through these endogenous market responses, our forward guidance acts as an automatic stabiliser through the adjustment of monetary policy expectations – and hence the entire spectrum of monetary conditions – to changes in the inflation outlook.
Chart 5
EONIA forward curve and lift-off dates
(percentages per annum)

Sources: Bloomberg and ECB calculations.
Notes: Dotted lines indicated lift-off dates based on the trough of the curve plus 10 basis points. The latest observations are for 2 October 2020.
The combination of our pre-pandemic and pandemic-specific monetary policy measures has successfully contributed to the stabilisation of markets and has thereby helped to ensure the smooth transmission of our monetary policy.[7] As shown in Chart 6, the PEPP has also helped contain sovereign bond yields: today, the euro area GDP-weighted yield curve is back to its pre-crisis levels. This is central to the transmission of our monetary policy, since sovereign bond yields are the basis for funding costs for households, corporates and banks (in addition to governments).
Chart 6
Euro area GDP-weighted yield curve
(percentages)
Sources: Bloomberg and ECB calculations.
Note: The latest observations are for 2 October 2020.
Credit supply has been supported by our TLTRO III operations. The TLTROs were in high demand in June and September 2020, with a combined take-up of nearly €1.5 trillion. In net terms, liquidity increased by €706 billion.[8] The high take-up, together with the intended use (as shown in Chart 7) that banks have reported in surveys, suggests that we can expect our targeted operations to have a sizeable impact on the provision of financing by banks to their customers. Our estimates show that TLTRO III liquidity can be expected to boost loan volumes considerably, to the tune of 3 percentage points cumulatively by 2022. In addition, the euro area bank lending survey indicates that TLTRO funding has been effective in easing the terms and conditions that banks apply in their lending.
Chart 7
Evolution of expected use of TLTRO III funds from the June 2020 operation
(left and central columns: share of respondents weighted by change in TLTRO III uptake; right column: share of respondents weighted by net liquidity injection)
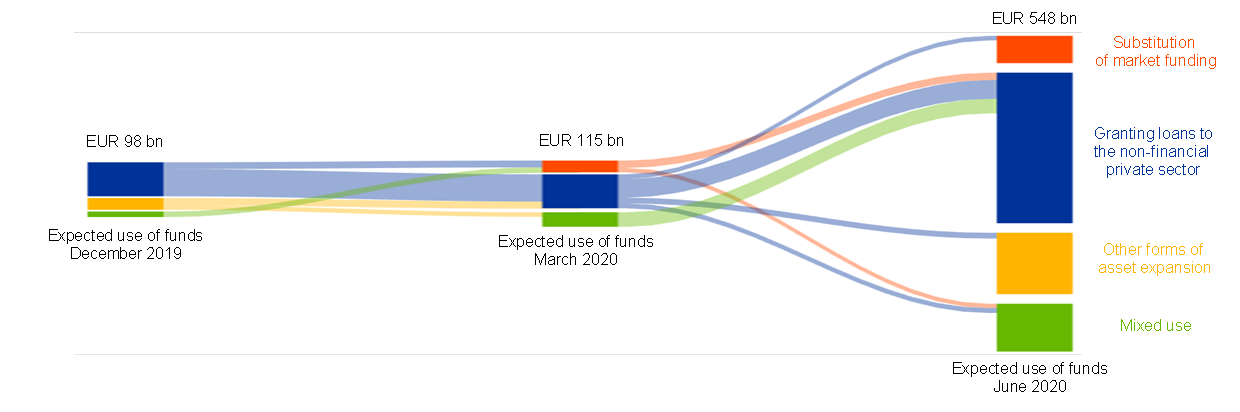
Sources: ECB, euro area bank lending survey and ECB Banking Supervision survey on TLTRO III.4 use.
Notes: The four bars on the right column measure the net liquidity injection in the June 2020 operation (change in TLTRO III take-up net of TLTRO II repayments and maturing bridge longer-term refinancing operations). The red bar measures the take-up of banks that, in the ECB Banking Supervision survey on TLTRO III.4 use conducted in July 2020, reported that more than 50% of the funds will be allocated as a substitute for market funding sources. The blue bar measures the same take-up by banks that intend to allocate the majority of funds for granting loans. The yellow bar represents the take-up by banks that intend to allocate the majority of funds to uses other than substituting market funding or granting loans (e.g. government securities, holding as cash, financing other financial entities, etc.). The green bar reports the take-up by banks that do not plan to allocate the majority of funds in any of the three categories. The bars in the left and central columns measure the distribution across expected uses of the TLTRO III take-up in the December 2019 and March 2020 operations, respectively, based on responses to the January and April 2020 bank lending surveys, respectively. Shaded areas represent the take-up of banks that change their expected use of funds between survey waves.
Chart 8 shows the time series of the average euro area lending rate, broken down into the factors that banks consider when pricing a loan: the base rate (a term overnight interest swap rate); funding costs; credit risk; and the cost of capital. It is apparent that, despite an increase in credit risk, the supportive conditions of the ECB funding have contributed to keeping the lending rate around the historically low levels it had reached before the pandemic crisis.
Chart 8
Lending rate to non-financial corporations and its components
(percentages per annum)
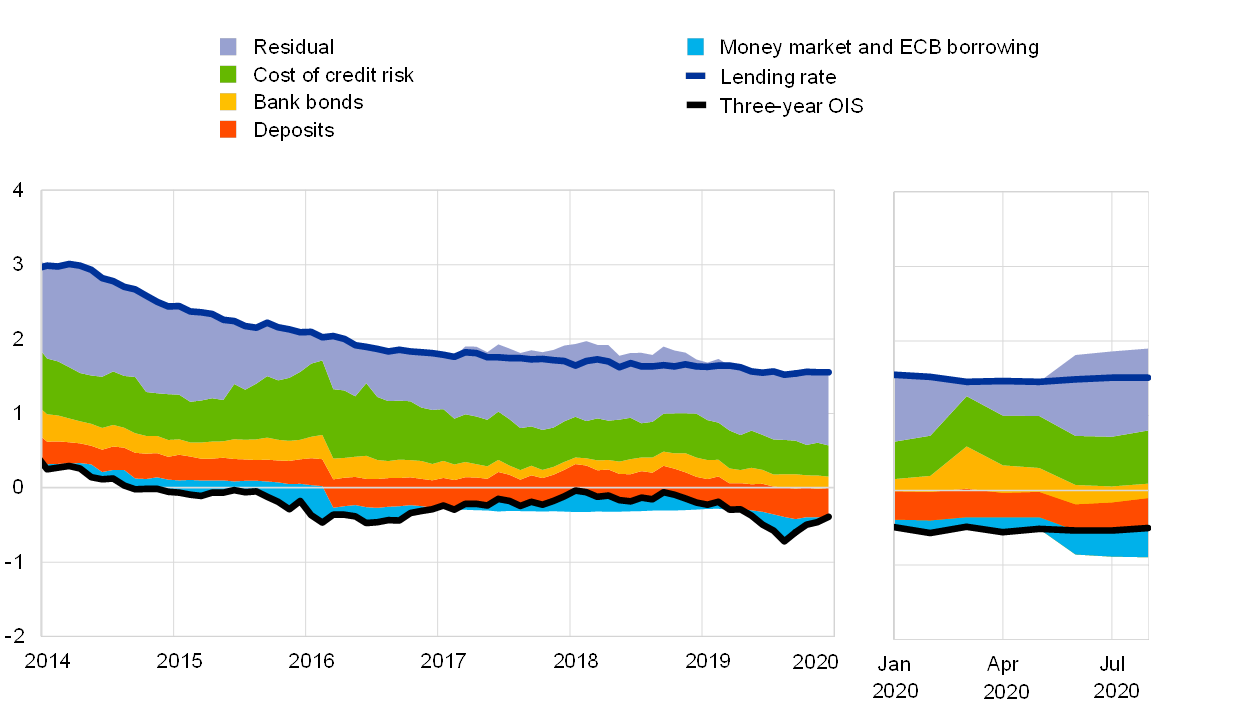
Sources: ECB, Moody’s and ECB calculations.
Notes: The intermediation wedge is the distance from the base rate (three-year overnight index swap (OIS), black solid line) to the realised lending rate, as measured by the observed lending rate for non-financial corporations. The margin is the residual between observed lending rates and all other components, including the floor given by the three-year OIS rate. The latest observations are for August 2020.
Meeting the monetary policy challenge
The pandemic represents a significant monetary policy challenge. Weak demand and rising economic slack have added to disinflationary pressures in an environment that is already characterised by low inflation. As I set out in my speech at this year’s Jackson Hole conference, Chart 9 sketches in a stylised form the challenge the ECB is facing in reaching its inflation aim.[9]
Chart 9
The future inflation path
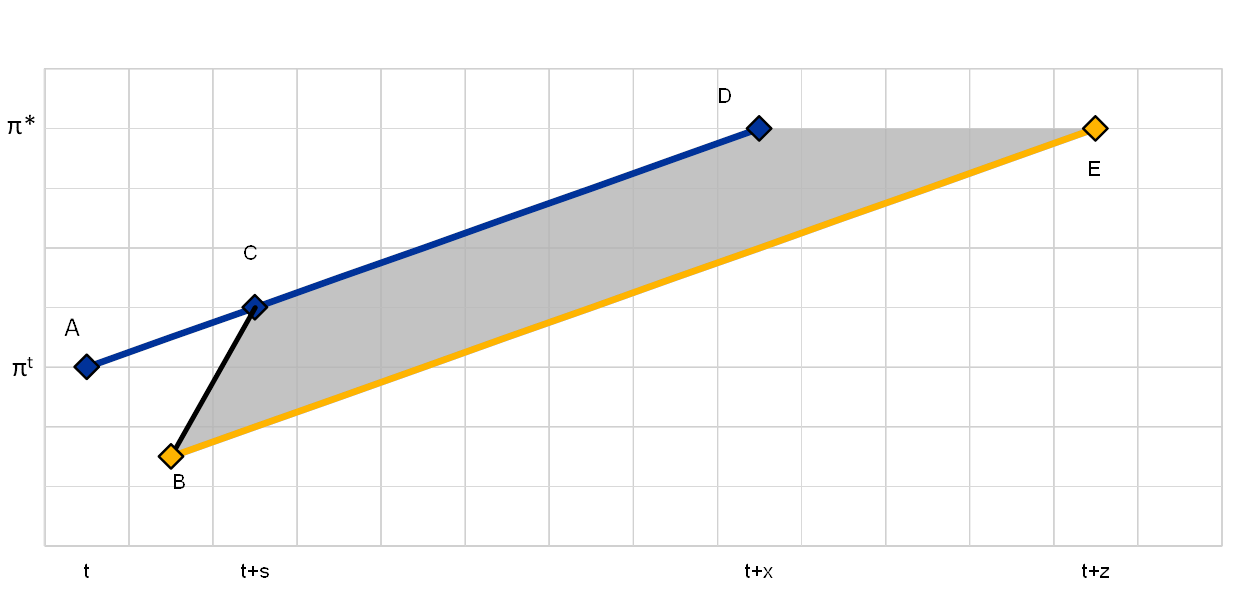
Source: ECB.
Notes: “AD” (the blue line) represents the expected inflation path before the pandemic shock. The initial negative impact of the pandemic shock – in the absence of additional monetary policy accommodation – is captured by the downward shift in the expected path from “A” to “B”. The “BE” path (the yellow line) illustrates a transition path of inflation that is even lower than originally envisaged. By providing additional monetary policy accommodation, the central bank can aim towards the upper region of the “BCDE” zone, so that the adjustment is closer to the “BCD” path.
Before the onset of the pandemic (time t), inflation was expected to rise gradually towards the inflation aim (“π*”) along the “AD” path (the bold blue line). The initial negative impact of the pandemic shock on inflation is illustrated by the shift from “A” to “B”.
The monetary policy challenge since the onset of the pandemic crisis can be divided into two stages. In the first stage, the challenge for the ECB is to counter the negative inflation shock caused by the pandemic. One option would have been to simply accept a longer period of low inflation and an even more protracted path towards our inflation aim (as illustrated by the “BE” path in the chart). However, this option is not desirable for a number of reasons. First, it would be very costly. It would imply higher real interest rates, thereby weakening the recovery of investment and consumption. Second, it would also be a high-risk option: by tolerating a protracted period of even lower inflation, it might foster a downward drift in inflation expectations that could ultimately become entrenched, making it even more difficult for us to deliver our inflation aim. This is particularly relevant in the current euro area context, with an already long period of below-target inflation before the pandemic.
Instead, a less costly and more prudent approach is to add sufficient extra monetary policy accommodation to boost inflation momentum towards the upper region of the “BCDE” zone, in order to reconnect to the pre-pandemic inflation path. The central element in this first stage has been the introduction of the PEPP and the subsequent recalibration of its size and duration, in order to provide an intense phase of extra net asset purchases.
However, the challenge that already existed before the pandemic will also remain even after the negative pandemic shock to the inflation path is offset: the timely convergence of inflation to our aim. Accordingly, the second stage of our monetary policy challenge is to deliver this goal: once we have returned towards the pre-pandemic inflation path, we have to ensure that our monetary policy stance is appropriately calibrated in order to ensure timely and robust convergence to our medium-term inflation aim.
In both the first and second stages of the monetary policy challenge, fiscal policy will play an important role in the transmission of our monetary policy: all else being equal, fiscal multipliers are higher in the current environment in which our current policy measures and forward guidance are supporting a low level for the yield curve. In terms of the initial impact of the pandemic, its adverse impact on the economy would have been significantly worse in the absence of countercyclical fiscal policy measures. The innovative nature and scale of the Next Generation EU recovery fund has also clearly contributed to the significant reduction in average sovereign bond yields and enhanced the prospect of a sustained recovery across the euro area. Looking forward, the area-wide fiscal policy stance (aggregating between national and EU-level measures) for 2021 and beyond will play a crucial macroeconomic role, subject to the quality of the design and implementation of fiscal programmes.
In terms of policy making, the ECB Governing Council will carefully assess the incoming information with regard to its implications for the medium-term inflation outlook. The Governing Council continues to stand ready to adjust all of its instruments, as appropriate, to ensure that inflation moves towards its aim in a sustained manner, in line with its commitment to symmetry. Furthermore, the current monetary policy strategy review exercise provides an excellent opportunity to revisit the strategic underpinnings of our monetary policy, in order to ensure we are maximising our effectiveness and efficiency in delivering our mandate.[10]
- I am grateful to Demosthenes Ioannou and Nick Ligthart for their contributions to this speech.
- The June Eurosystem staff macroeconomic projections expected average annual output to decline by 8.7 percent in 2020 but expand by 5.2 percent in 2021 and a further 3.3 percent in 2022. The incoming data have been broadly in line with our expectations: the latest September ECB staff macroeconomic projections see an output decline of 8.0 percent in 2020 and expansions of 5.0 percent in 2021 and 3.2 percent in 2022.
- See also Dossche, M. and Zlatanos, S. (2020), “COVID-19 and the increase in household savings: precautionary or forced?”, Economic Bulletin, Issue 6, ECB.
- This development is also broadly reflected in the European Commission’s Economic Sentiment Indicator for September, which showed services demand expectations waning for the second month in a row. Overall, services confidence registered an increase in September, thanks to managers reporting views that are much less negative about the past business situation and past demand. However, the level of sentiment in the services sector remained low compared with other sectors.
- For more extensive discussions of our policy response to the pandemic, see Lane, P.R. (2020), “The pandemic emergency: the three challenges for the ECB”, Jackson Hole Economic Policy Symposium, Federal Reserve Bank of Kansas City “Navigating the Decade Ahead: Implications for Monetary Policy”, 27 August, and Lane, P.R. (2020), “Understanding the pandemic emergency purchase programme”, Princeton BCF Covid-19 Webinar Series, 22 June.
- Net asset purchases under the APP have a time horizon linked to the future tightening of our policy rates. We say that we expect them “to run for as long as necessary to reinforce the accommodative impact of our policy rates, and to end shortly before we start raising the key ECB interest rates.” We intend to “continue reinvesting, in full, the principal payments from maturing securities purchased under the APP for an extended period of time past the date when we start increasing interest rates, and in any case for as long as necessary to maintain favourable liquidity conditions and an ample degree of monetary accommodation.”
- See Lane, P.R. (2020), “The market stabilisation role of the pandemic emergency purchase programme”, The ECB Blog, 22 June.
- Gross take-up was €1.308 trillion in June 2020 and €175 billion in September 2020, and the net liquidity injection considering PELTROs (pandemic emergency longer-term refinancing operations) and TLTRO II repayments was €548 billion in June 2020 and €158 billion in September 2020.
- See Lane, P.R. (2020), “The pandemic emergency: the three challenges for the ECB”, speech at the Jackson Hole Economic Policy Symposium “Navigating the Decade Ahead: Implications for Monetary Policy”, hosted by the Federal Reserve Bank of Kansas City.
- For more details on the strategy review, see the speech by Christine Lagarde, President of the ECB, “The monetary policy strategy review: some preliminary considerations” at the “ECB and Its Watchers” conference on 30 September 2020.
Den Europæiske Centralbank
Generaldirektoratet Kommunikation
- Sonnemannstrasse 20
- 60314 Frankfurt am Main, Tyskland
- +49 69 1344 7455
- media@ecb.europa.eu
Eftertryk tilladt med kildeangivelse.
Pressekontakt