
Liquidity conditions and monetary policy operations in the period from 27 January to 27 April 2021
Published as part of the ECB Economic Bulletin, Issue 4/2021.
This box describes the ECB’s monetary policy operations and euro area liquidity developments during the first and second reserve maintenance periods of 2021. Together, these two maintenance periods lasted from 27 January to 27 April (the “review period”).
The level of central bank liquidity in the banking system continued to rise during the review period. This was largely due to net asset purchases conducted under the asset purchase programme (APP) and the pandemic emergency purchase programme (PEPP), as well as the settlement of the seventh operation in the third series of targeted longer-term refinancing operations (TLTRO III). On 11 March, the Governing Council announced that it expected purchases under the PEPP to be conducted at a significantly higher pace over the second quarter than during the first months of the year. During the review period, net autonomous liquidity factors remained at levels broadly similar to those seen during the previous review period, which ran from 4 November 2020 to 26 January 2021.
Liquidity needs
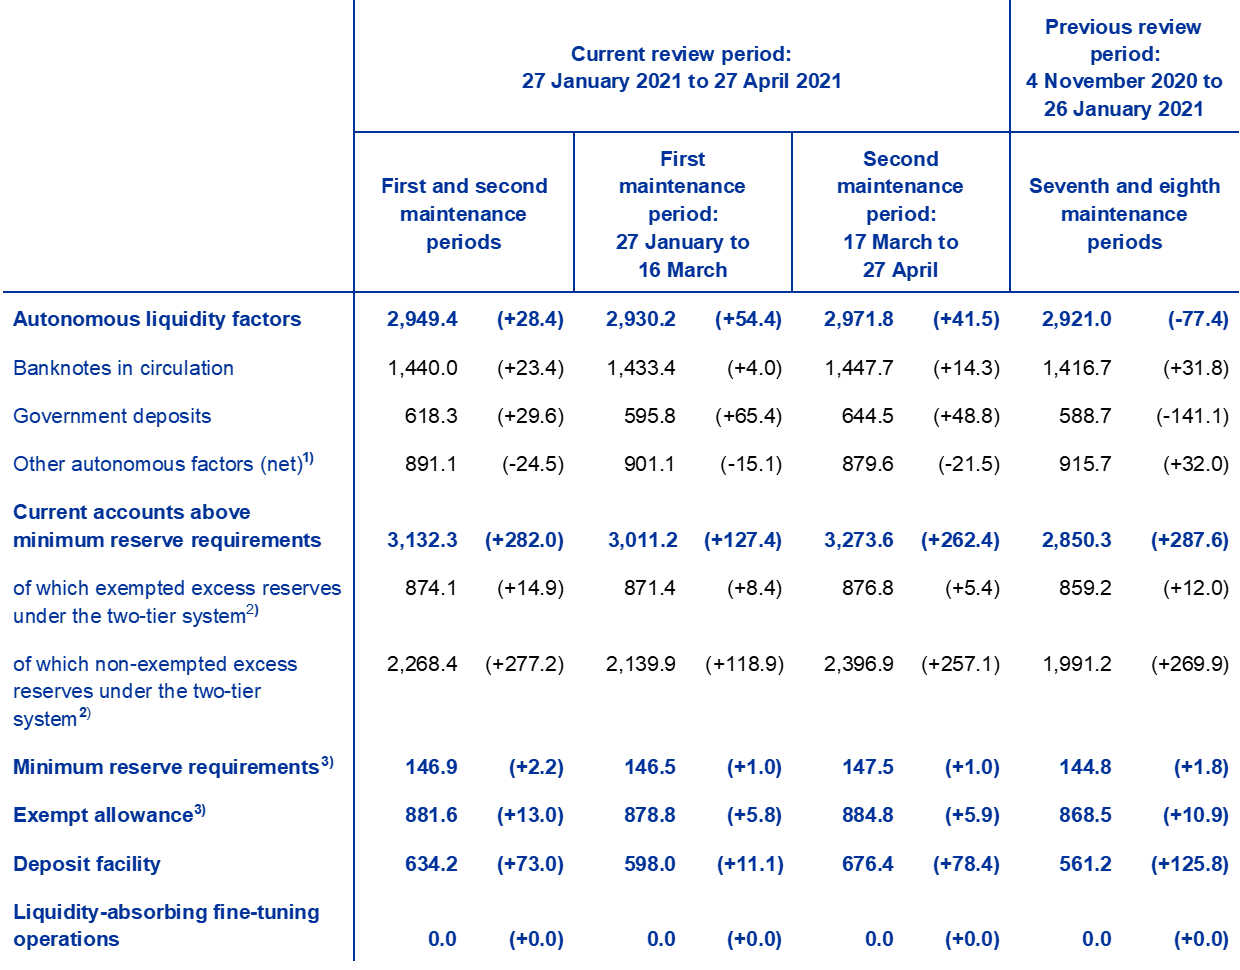
The average daily liquidity needs of the banking system, defined as the sum of net autonomous factors and reserve requirements, increased marginally by €4.4 billion, reaching €2,030.6 billion on average during the review period. This modest increase from the previous review period is due to the combined effects of a small increase of €2.2 billion in the net autonomous factors, to €1,883.7 billion, and an increase of €2.2 billion in the minimum reserve requirements, to €146.9 billion (see the section of Table A entitled “Other liquidity-based information”).
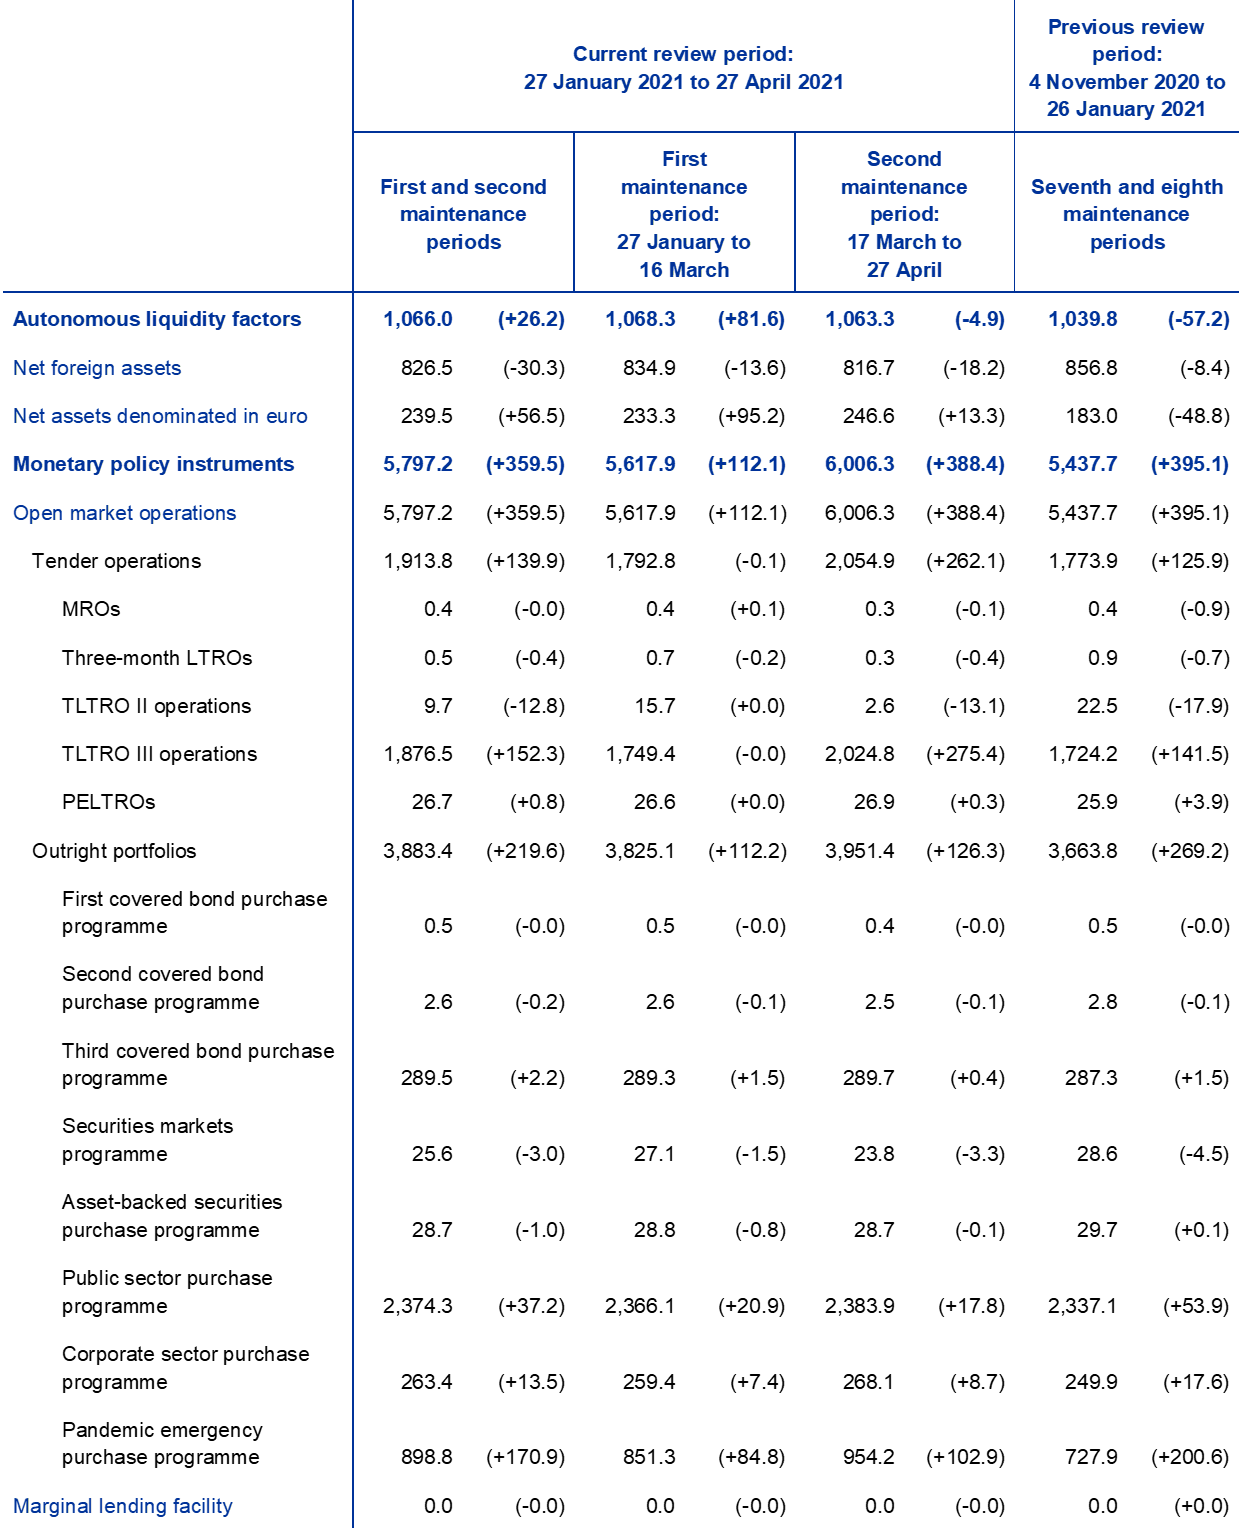
The increase in net autonomous factors was mainly due to higher government deposits, which increased in the review period by €29.6 billion (or 5%) to €618.3 billion. This increase partially reverses a decline in the last quarter of 2020 from the record high observed earlier in 2020, when governments stepped up their security issuance to finance the policy response to the coronavirus (COVID-19) crisis and increased their precautionary balances in response to uncertainty. Overall, despite the rise, government deposits remain below the record high of €729.8 billion recorded in the sixth maintenance period of 2020, but still significantly above their historical average of €246.8 billion during the same period in previous years (27 January to 27 April in 2020, 2019 and 2018). The increase in government deposits was partially offset by a €24.5 billion decline in other autonomous factors, to €891.1 billion. Banknotes in circulation increased by €23.4 billion to €1,440.0 billion. In total, liquidity-absorbing autonomous factors increased by €28.4 billion to €2,949.4 billion. The increase in liquidity-absorbing factors was partially offset by a €26.2 billion increase in liquidity-providing autonomous factors, to €1,066.0 billion, which was due to the combined effects of a €56.5 billion increase in net assets denominated in euro and a €30.3 billion decline in net foreign assets. Table A presents an overview of the autonomous factors discussed above and their changes.
Table A
Eurosystem liquidity conditions
Liabilities
(averages; EUR billions)
Source: ECB.
Notes: All figures in the table are rounded to the nearest €0.1 billion. Figures in brackets denote the change from the previous review or maintenance period.
1) Computed as the sum of the revaluation accounts, other claims and liabilities of euro area residents, capital and reserves.
2) Exempted and non-exempted excess reserves are explained on the ECB’s website.
3) Memo item that does not appear on the Eurosystem balance sheet and therefore should not be included in the calculation of total liabilities.
Assets
(averages; EUR billions)
Source: ECB.
Notes: All figures in the table are rounded to the nearest €0.1 billion. Figures in brackets denote the change from the previous review or maintenance period.
Other liquidity-based information
(averages; EUR billions)

Source: ECB.
Notes: All figures in the table are rounded to the nearest €0.1 billion. Figures in brackets denote the change from the previous review or maintenance period.
1) Computed as the sum of net autonomous factors and minimum reserve requirements.
2) Computed as the difference between autonomous liquidity factors on the liability side and autonomous liquidity factors on the asset side. For the purposes of this table, items in the course of settlement are also added to net autonomous factors.
3) Computed as the sum of current accounts above minimum reserve requirements and the recourse to the deposit facility minus the recourse to the marginal lending facility.
Interest rate developments
(averages; percentages)

Source: ECB.
Notes: Figures in brackets denote the change from the previous review or maintenance period.
1) As of 1 October 2019, the euro overnight index average (EONIA) is computed as the euro short-term rate (€STR) plus 8.5 basis points. Differences in the changes shown for EONIA and the €STR are due to rounding.
Liquidity provided through monetary policy instruments
The average amount of liquidity provided through monetary policy instruments increased by €359.5 billion, reaching €5,797.2 billion on average during the review period (Chart A). Around 61% of the increase is the result of ongoing net purchases under the asset purchase programmes, primarily the PEPP, while the remaining 39% is the result of credit operations, mainly the allotment of the seventh operation in the TLTRO III series in March 2021.
Chart A
Evolution of liquidity provided through open market operations and excess liquidity
(EUR billions)

Source: ECB.
Note: The latest observations are for 27 April 2021.
The average amount of liquidity provided through credit operations increased by €139.9 billion during the review period. This was largely the result of the settlement of the seventh operation in the TLTRO III series on 24 March, which injected €330.5 billion. This injection was partially offset by the final maturity of the TLTRO II series, in which €9.7 billion was repaid. The first operation of the four additional pandemic emergency longer-term refinancing operations (PELTROs), announced in December 2020 and settled on 25 March 2021, added an additional €0.8 billion of liquidity. The main refinancing operations (MROs) and three-month longer-term refinancing operations (LTROs) continue to play a marginal role, with the average recourse to these two regular refinancing operations decreasing by €0.4 billion compared with the previous review period, to a new record low of €0.9 billion.
At the same time, outright portfolios increased by €219.6 billion to €3,883.4 billion due to net purchases under the APP and the PEPP. Average holdings in the PEPP increased by €170.9 billion in relation to the average of the previous review period, reaching €898.8 billion. Purchases under the PEPP represented the largest increase by far across all asset purchase programmes, followed by purchases under the public sector purchase programme (PSPP) and the corporate sector purchase programme (CSPP), the average holdings of which increased by €37.2 billion to €2,374.3 billion and €13.5 billion to €263.4 billion, respectively.
Excess liquidity
Average excess liquidity increased by €355.1 billion to a new record high of €3,766.5 billion (Chart A). Excess liquidity is the sum of banks’ reserves in excess of the reserve requirement and the recourse to the deposit facility net of any recourse to the marginal lending facility. It reflects the difference between liquidity provided and liquidity needs. Banks’ current account holdings in excess of minimum reserve requirements grew by €282.0 billion to €3,132.3 billion, while the average recourse to the deposit facility increased by €73 billion to €634.2 billion.
Excess reserves exempted from the negative deposit facility rate under the two-tier system[1] rose by €14.9 billion to €874.1 billion, while non-exempted reserves rose by €277.2 billion to €2,268.4 billion. The increase in exempted excess reserves largely reflects an increase in the exemption allowance by €13 billion to €881.6 billion, itself a function of the minimum reserve requirement and the increase thereof during the review period. The rise of non-exempt reserves is attributed to the general increase in excess liquidity, driven by net asset purchases and the greater recourse to credit operations. The aggregate utilisation rate of the exemption allowance, i.e. the ratio between exempt reserves and the maximum which could be exempt, rose marginally from 98.9% to 99.1%. The steadily high utilisation rate shows that excess liquidity continues to remain broad-based, with a large majority of banks holding reserves well in excess of the minimum requirement. The utilisation rate has remained above 98% since the third maintenance period of 2020. In this review period, exempt excess reserves accounted for 23.3% of total excess liquidity, compared to 25.2% in the previous review period.
Interest rate developments
The average €STR declined marginally during this review period compared to the previous review period. The €STR averaged -56.5 basis points during this review period, virtually unchanged when compared to an average of -56.0 basis points during the previous review period, as the magnitude of excess liquidity makes the €STR relatively inelastic to even large liquidity changes. It is noteworthy that, as of October 2019, the EONIA is calculated as the €STR plus a fixed spread of 8.5 basis points. Therefore, it moved, and will continue to move, in parallel with the €STR. ECB policy rates – the rates on the deposit facility, the MRO and the marginal lending facility – were left unchanged during the review period.
- The two-tier system for remunerating excess reserve holdings is explained on the ECB’s website.