
Indicators of labour market conditions in the euro area
Published as part of the ECB Economic Bulletin, Issue 8/2019.
This box presents two complementary tools for assessing the performance of the labour market in the euro area. The first is a visualisation tool in the form of a spider chart that displays 18 variables characterising the current euro area labour market conditions. The second applies a principal component analysis to the variables displayed on the spider chart. This approach summarises the available information on euro area labour market conditions in two synthetic indicators[1]: level of activity and labour market momentum. The indicator for the level of activity compares developments in the labour market over time, while the indicator for the labour market momentum assesses the rate of change in the performance of the labour market. The analysis presented is for the euro area as a whole and does not fully show cross-country labour market heterogeneity.
The visualisation tool for the euro area labour market is shown in Chart A, which represents labour market conditions using a “multifocal lens” approach.[2] This tool allows for a quick overview of the labour market by comparing the current values of each time series with their best and worst outcomes since 2005. It also allows a comparison of current labour market conditions with those at other points in time, such as the peak before the crisis (the first quarter of 2008) and the start of the economic recovery (the first quarter of 2013). The variables presented in Chart A reflect the complexity of the labour market. As such, these variables not only address current employment and unemployment dynamics, but also provide further information on other factors characterising the labour market conditions for both workers and firms, such as (i) unemployment conditions in terms of duration and age, (ii) labour market flows and posted vacancies, (iii) the utilisation of labour input and its implications for labour productivity and real wages, and (iv) structural factors that may be affecting the developments currently observed in the labour market.
Chart A
Helicopter view of the euro area labour market since 2005
(inner ring: worst outcome since Q1 2005; outer ring: best outcome since Q1 2005; values normalised for each variable)
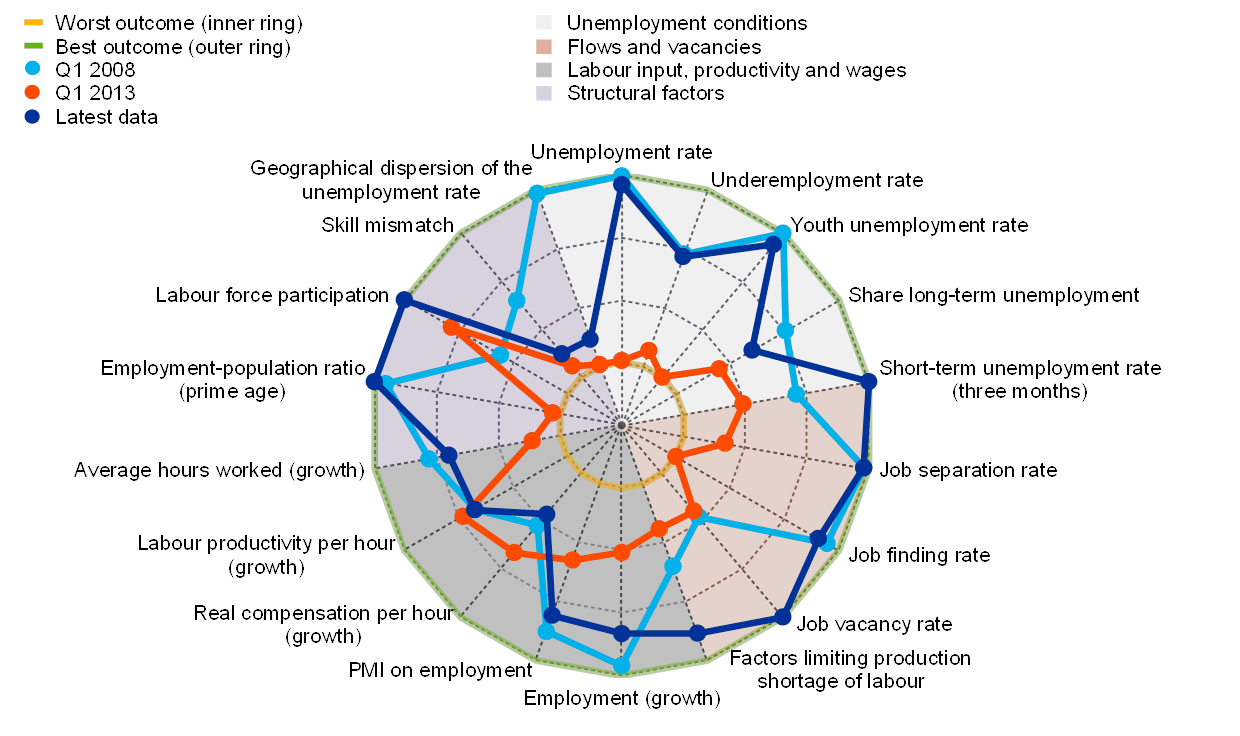
Sources: Eurostat (short-term statistics and Labour Force Survey for all unemployment related variables, employment-population ratio and labour force participation; job vacancy statistics for the job vacancy rate; and national accounts for employment, compensation, hours and productivity), European Commission (business and consumer surveys for factors limiting production shortage of labour), Markit (for Purchasing Managers’ Index, PMI) and ECB staff calculations. Further information on job finding and separation rates can be found in footnote 3 and on geographical dispersion of unemployment and skill mismatch in footnote 4. For the PMI on employment and for factors limiting production (shortage of labour), the latest observation is for October 2019; for the unemployment rate, the geographical dispersion of the unemployment rate and employment growth (flash estimate), the latest observation is for September 2019; and for the remaining variables, the latest observation is for the second quarter of 2019.
Notes: (i) all growth rates are defined as year-on-year; (ii) prime age is defined to comprise all individuals between 25 and 54 years old; (iii) the youth unemployment rate is defined for individuals between 15 and 24 years old; (iv) the underemployment rate is backcast for the first quarter of 2005 to the fourth quarter of 2007 using a cubic spline interpolation with the number of involuntary part‑time workers in the euro area acting as a proxy to calculate the number of underemployed part-time workers over this period; (v) the best outcome is defined for each variable either as the lowest level achieved since the first quarter of 2005, which is applied to all variables related to the unemployment conditions of the labour market, to the job separation rate, to the share of long-term unemployment, to the skill mismatch indicator and to the geographical dispersion of the unemployment rate, or as the highest level achieved since the first quarter of 2005; and (vi) the worst outcome is defined conversely to the best outcome.
Chart A shows that, while some labour market variables are close to their pre‑crisis values, the underlying labour market structure has changed considerably. The unemployment rate, the underemployment rate and the youth unemployment rate are close to their pre-crisis levels, even if the underemployment rate is still somewhat higher than its best outcome since 2005. The unemployment rate by duration is notably different from the pre-crisis figure: the short-term unemployment rate is at its lowest since 2005, whereas the current share of long‑term unemployment is still higher than that observed before the crisis. The euro area labour market’s performance in terms of flows and vacancies is strong, with all variables in this category recording values close to their best outcomes since 2005. Recent data on labour market flows[3] are similar to those observed during the pre‑crisis period; while vacancies, measured by the job vacancy rate and the indicator on factors limiting production, are at or close to historical highs. Developments in labour input, productivity and wages are slightly weaker than (but comparable with) those observed before the crisis. As for structural factors, two notable features of the current labour market situation are the record high levels of the employment to population ratio in the prime age population (persons aged 25 to 54 years old) and the labour force participation rate. Conversely, the skill mismatch indicator and the geographical dispersion of the unemployment rate[4] are significantly higher than they were pre-crisis and remain at levels comparable with those observed at the start of the recovery.
The second tool applies a principal component analysis to consolidate the complex information on the labour market into two synthetic indicators. This analysis uses the available information on the euro area labour market while isolating the main patterns affecting labour market conditions.[5] With this approach, two main components are identified. The first component is related to the level of activity in the labour market, reflecting primarily the developments in the employment-population ratio for the prime age population, unemployment rate, job finding rate, youth unemployment rate and share of long-term unemployment. The second component is more revealing of the momentum in the labour market, being related primarily to the growth rate of total employment, growth rate of average hours worked, share of long-term unemployment, PMI on employment and short-term unemployment rate. A third component is identified by controlling for any mismeasurement in the calculation of the synthetic indicators for the level of activity and euro area labour market momentum due to the possible non-stationarity of some labour market variables.[6]
The synthetic indicators show that the level of activity in the euro area labour market is comparable with its pre-crisis peak in the second quarter of 2019, while labour market momentum remains elevated, even if it has slowed somewhat (see Chart B). The two indicators appear to closely capture cyclical movements in the euro area labour market. The indicator for the level of labour market activity peaks before the recession in the first quarter of 2008, and then progressively declines until the beginning of the employment recovery, reaching its lowest value in the second quarter of 2013. It returned to its long-term average value at the end of 2016, concurrent with the return of total employment to its pre-crisis peak, and in the second quarter of 2019 reached levels comparable with those before the crisis. The indicator on labour market momentum started to decline some time before the crisis and reached its lowest levels in 2009, when there was a sharp fall in employment. The indicator remained below its average until the end of 2013, peaked in 2018 at levels slightly higher than before the crisis and remains above its long-term average, suggesting scope for the labour market to continue improving in the near term.
Chart B
Labour market condition indicators for the euro area
(standard deviations)

Sources: Eurostat, European Commission, Markit and ECB staff calculations. The latest observation is for the second quarter of 2019.
Note: The shaded areas represent recession periods, as identified by the Centre for Economic Policy Research’s (CEPR) Euro Area Business Cycle Dating Committee.
To conclude, this box presents two tools that complement each other and help to analyse the complex information of the labour market. The spider chart represents the various concurrent dimensions of the labour market, e.g. unemployment conditions, developments in labour market flows and vacancies, developments of labour input, productivity and real wages, and changes in the structural conditions of the labour market in the euro area. The two synthetic labour market indicators summarise the most relevant information from the 18 variables plotted on the spider chart. These indicators provide a gauge for the level of activity and the momentum of the euro area labour market and thus help to assess its performance and cyclical position. The analysis suggests that there is scope for the level of activity in the euro area labour market to continue improving in the near future, benefiting from positive labour market momentum. The indicators do not fully cater for country-specific heterogeneity in the euro area labour market, and improvements in labour market conditions are dependent on future changes in the cyclical position of the economic activity.
- The methodological approach follows that used for the Kansas City Fed’s “Labor Market Conditions Indicators (LMCI)”. Other LMCI have been developed by the Reserve Bank of Australia, the Bank of Canada and the Reserve Bank of New Zealand, using a similar approach.
- The presentation of the labour market variables in this form takes inspiration from the Atlanta Fed’s “Labor Market Distributions Spider Chart”, which is a tool developed to monitor broad developments in the labour market over time. The visualisation approach is slightly different to the Atlanta Fed’s chart, as the approach in this box does not perform any rank-ordering of the data. Instead, values are normalised so that the best and worst outcomes during the sample can be compared across variables. The business cycle dates defining the peak before the 2008-09 crisis and the trough highlighting the start of the economic recovery are taken from the announcements by the Centre for Economic Policy Research’s (CEPR) Euro Area Business Cycle Dating Committee.
- Labour market flows are computed based on Shimer, R., “Reassessing the ins and outs of unemployment”, Review of Economic Dynamics, Vol. 15, No 2, 2012, pp. 127-148, and Elsby, M.W.L., Hobijn, B. and Şahin, A., “Unemployment dynamics in the OECD”, Review of Economics and Statistics, Vol. 95, No 2, 2013, pp. 530-548, in that movements to and from unemployment are estimated based on information on unemployment duration, while flows to and from inactivity are assumed constant.
- The geographical dispersion of the unemployment rate is measured as the coefficient of variation of the unemployment rate across all euro area countries, weighted by their respective employment shares. The skill mismatch indicator follows the methodology in Task Force of the Monetary Policy Committee of the European System of Central Banks, “Euro Area Labour Markets and the Crisis”, Occasional Paper Series, No 138, ECB, Frankfurt am Main, October 2012.
- This approach is similar to the methodology behind the Kansas City Fed’s LMCI (Hakkio, C.S. and Willis, J.L., “Assessing Labor Market Conditions: The level of activity and the speed of improvement”, The Macro Bulletin, Federal Reserve Bank of Kansas City, July 2013, and Hakkio, C.S. and Willis, J.L., “Kansas City Fed’s Labor Market Conditions Indicators”, The Macro Bulletin, Federal Reserve Bank of Kansas City, August 2014). The relevant principal components are chosen according to two criteria: (i) the sum of all chosen components has to account for at least 80% of the total variance of all 18 labour market variables, and (ii) each component must have a corresponding eigenvalue significantly above unity. The components are then passed through a varimax rotation to make them easier to interpret, in line with the Kansas City Fed’s LMCI. The LMCI developed for the euro area in this box are robust to the removal of any individual labour market variable.
- This component (not shown in Chart B) is mostly influenced by trending labour market variables, such as the labour force participation rate, skill mismatch indicator, geographical dispersion of the unemployment rate, job vacancy rate and labour indicator of the factors limiting production. As such, this component is associated with the long-term changes that occurred in the labour market between 2005 and 2019. Excluding the third component would result in a lower observed level for labour market activity and higher labour market momentum in recent quarters. The resulting three LMCI account jointly for 84.9% of the total variance of the 18 labour market variables in Chart A. Developments in the employment rate are consistent with the indicator on the level of activity.