
Domestic versus foreign factors behind the fall in euro area industrial production
Published as part of the ECB Economic Bulletin, Issue 6/2019.
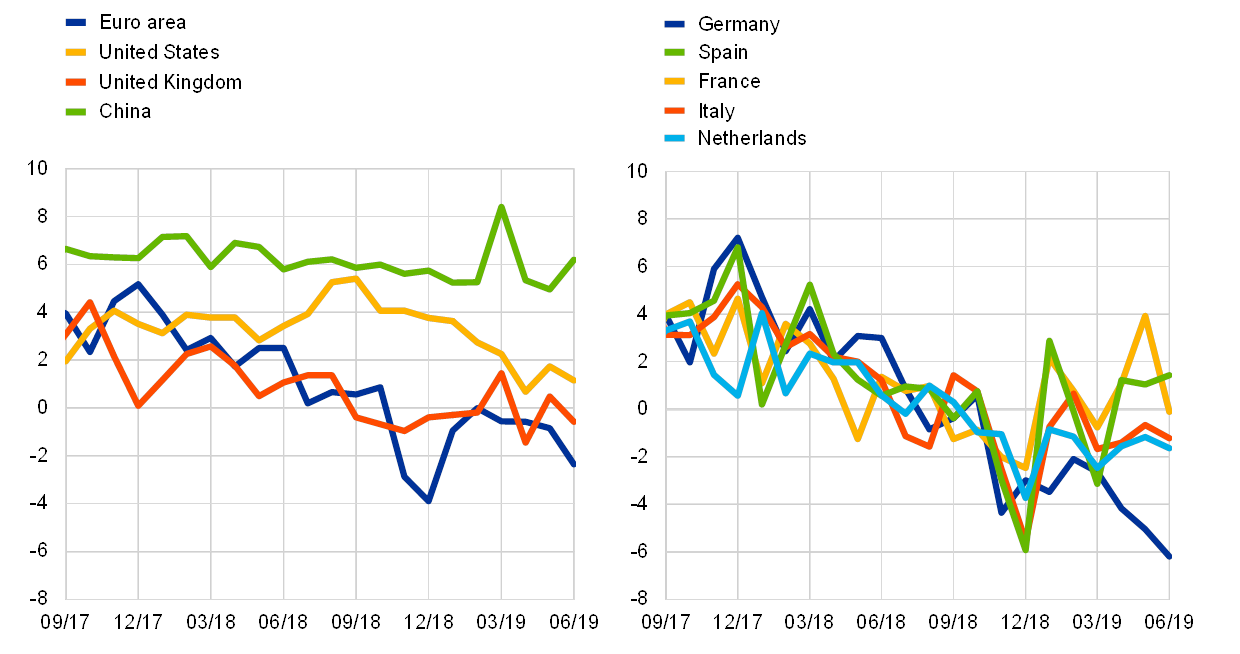
After a sharp decline in 2018 amid weak global trade, year-on-year growth in euro area industrial production (excluding construction) recovered marginally in 2019 but remained in negative territory. In the period from January 2018 to June 2019 the year-on-year growth rate of euro area industrial production (excluding construction) fell by 6.3 percentage points overall, from 3.9% to -2.4% (see Chart A). This is by far the largest fall recorded among major economies in that period. In the United States, the decline in industrial production started later, in September 2018. Among the largest euro area countries, the biggest declines were recorded by Germany (10.9 percentage points), the Netherlands (5.7 percentage points) and Italy (5.5 percentage points). In France and Spain, industrial production dropped in 2018 in line with developments in all other euro area countries, but reversed its negative trend in 2019; the patterns remain highly volatile, however. The slowdown in manufacturing activity in the euro area seems to have had an adverse impact on growth rates in some sub-components of services, although the services sector overall has so far remained relatively resilient. This box examines the factors behind the developments in euro area industrial production, aiming to quantify the relative importance of foreign versus domestic shocks through the lens of a multi-country structural vector autoregression (SVAR) model.
Chart A
Industrial production excluding construction in the euro area and other major economies
(year-on-year percentage changes)
Source: Eurostat.
Note: The latest observation is for June 2019.
All these developments occurred against the background of a drop in global trade. Due to the intensification of trade tensions between the United States and China and the uncertainty surrounding Brexit, world new export orders plunged during the period considered, and euro area new export orders fell even more severely (see Chart B).
Chart B
Purchasing Managers’ Indices for global and euro area new export orders
(year-on-year percentage changes)

Source: Markit.
Note: The latest observation is for June 2019.
A model covering industrial production in a number of large economies is used to assess the importance of foreign spillovers to euro area industrial production. The model uses seasonally adjusted monthly industrial production series (excluding construction) for the euro area, China, the United Kingdom and the United States (see Chart A). It is estimated for a relatively short sample period (January 2007 to June 2019), partly because the economic relationships between countries may have been different before the global economic and financial crisis, but also to include data for China. The model also controls for a global factor, which is proxied by the Purchasing Managers’ Index (PMI) for world new export orders (see Chart B). To give more prominence to this global trade factor, it is assumed to only react with a lag to industrial production shocks in individual countries, while industrial production in each country reacts to global shocks contemporaneously. All other variables are modelled assuming that a shock has an instantaneous effect on the variable in the home country that is larger in absolute value than its effect on foreign variables.[1]
The results of the model suggest that the fall in industrial production growth in the euro area in the past year has been driven by both weaker foreign demand for euro area goods and adverse domestic shocks. Whereas weakness in international trade was the main contributor to the fall in euro area industrial production growth in the first half of 2018 (see grey bar in Chart C),[2] from July 2018 onwards euro area-specific developments also played a major role (see yellow bar). It is also worth pointing out that euro area industrial production has been affected by recent developments in the United States (red bar in Chart C). China’s negative contribution has been relatively stable since the beginning of 2016. Given the developments shown for Germany in Chart A, euro area domestic shocks may reflect negative developments in the German car industry. The introduction of a new emissions test for motor vehicles on 1 September 2018 – the Worldwide Harmonised Light Vehicle Test Procedure (WLTP) – causing supply disruptions in Germany, and possibly also the potential diesel engine ban announced in the summer of 2018 and expected to be introduced in major German cities in 2019, which may have discouraged consumers from buying diesel cars, appear to be key country-specific temporary factors that account for a large share of the drop in euro area industrial production in the second half of 2018. The more recent increase in the negative contribution of domestic factors to euro area industrial production growth (in June 2019) is due to lower industrial output growth in Germany (see Chart A), possibly linked to the weaker consumption growth recorded in this country in the second quarter of 2019.
Chart C
Shock decomposition of euro area industrial production excluding construction
(year-on-year percentage changes)
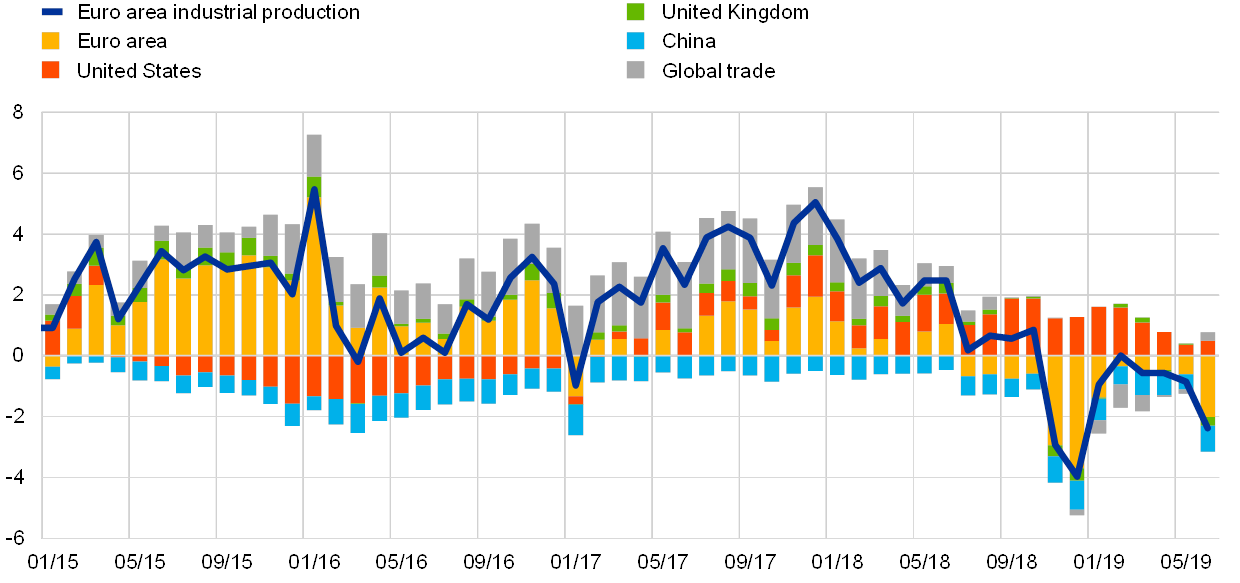
Sources: Eurostat, Markit and ECB calculations.
Notes: Shocks to countries’ industrial production are identified using the absolute magnitude restriction method (see De Santis, R.A. and Zimic, S., op. cit.), which assumes that the effect of the shock on the domestic economy at the time of impact is larger in absolute value than the magnitude of the foreign spillover. The PMI for world new export orders, which is a proxy for global trade, is assumed to react to countries' industrial production shocks with one lag. The overall sample period is from January 2007 to June 2019.
All in all, the fall in euro area industrial production growth over the last year appears to have been driven by both the intensification of global trade tensions and domestic developments. Between July 2018 and June 2019 the global trade factor and all factors associated with developments in China, the United Kingdom and United States explained 37% of the fall in euro area industrial production growth, while domestic factors contributed 63%, although part of this effect may reflect temporary factors linked to the car industry in the second half of 2018. The marked weakness in manufacturing activity may be feeding into some sub-components of services, but overall the services sector is currently withstanding the negative shock. The possible implications for services must be monitored closely.
- The shock identification method is explained in De Santis, R. A. and Zimic, S, “Spillovers among sovereign debt markets: Identification through absolute magnitude restrictions”, Journal of Applied Econometrics, Vol. 33, No 5, 2018, pp. 727-747.
- In the first half of 2018 the global trade factor made a negative contribution of 1.5 percentage points to the change in industrial production in the euro area. This is the difference between the grey bar (in Chart C) in June 2018 and in January 2018.