
The transmission of exchange rate changes to euro area inflation
Published as part of the ECB Economic Bulletin, Issue 3/2020.
1 Introduction
Exchange rate changes play an important role in explaining inflation developments. Understanding how exchange rates are passed through to inflation and growth is a crucial part of economic analysis. This article summarises the findings of a research group comprised of experts from the European System of Central Banks (ESCB) who, over the past two years, reviewed and analysed the exchange rate pass-through (ERPT) to inflation in Europe.[1]
This article provides updated empirical estimates of the ERPT to import and consumer prices in the euro area and EU countries. A clear distinction is made between estimates that rely on reduced-form equations, which represent conditional correlations (ERPT), and the pass-through of identified shocks, which are defined as the “price-to-exchange-rate ratio”, or the PERR. All of these estimates corroborate the general finding in the literature that the impact of the exchange rate on prices weakens along the pricing chain. The ERPT to consumer prices, obtained from the reduced-form equations, is about one-tenth that of the ERPT to import prices. These estimates are generally found to be stable since the end of the 1990s, but lower than those obtained in the literature for earlier decades. The estimates also suggest that the ERPT in the euro area is stronger for large exchange rate changes compared with small ones.
Structural characteristics, such as trade openness, integration in international production chains, the currency of invoicing of trade and market power, are key in explaining differences in the ERPT across countries and industries. In line with the literature, an analysis using micro and sectoral data, as well as findings based on structural macroeconomic dynamic stochastic general equilibrium (DSGE) models, suggests that increased participation in global value chains, larger market shares, invoicing of euro area imports in euro (local currency pricing) and a large proportion of local distribution costs reduce the ERPT to import prices. In contrast, the ERPT to consumer prices increases when imports account for a greater share of consumption and the domestic distribution sector is more competitive.
In addition to the above-mentioned structural factors, the relative dynamics of prices and the exchange rate depend on the shock to which they react. The distinction between the dependence on the type of shock and structural characteristics is partly a simplification since the two interact: for example, a small, very open country will tend to be more affected by foreign shocks, while a country whose imports are mostly invoiced in euro will tend to experience a lower ERPT. Therefore, the shock-dependency of the ERPT for any country may be intertwined with the other structural characteristics, but the article abstracts from this consideration. Results based on structural models suggest that the response of consumer prices (relative to that of the exchange rate) is somewhat larger when the exchange rate moves because of shocks to monetary policy and to the exchange rate itself, than when the exchange rate moves because of shocks to domestic aggregate supply.
The pass-through of exchange rates to inflation depends on monetary policy. Simulations based on structural models show that the more credible and effective monetary policy is in counteracting inflationary pressures, the lower the reduced-form empirical estimates of the ERPT to import and consumer prices will be. This analysis also shows that when the central bank faces an effective lower bound for monetary policy rates, the ERPT is higher in the presence of interest rate forward guidance and other non-standard measures, such as exchange rate floors.
2 Main empirical facts
2.1 Measuring the impact of the exchange rate on prices
When thinking about exchange rate pass-through, and particularly when comparing estimates from different studies, it is crucial to distinguish between two definitions of ERPT used in the literature. The first definition refers to the estimated size of the response of prices (import or consumer) to changes in the exchange rate in a reduced-form pricing equation. ERPT defined in this way is the estimated coefficient on the exchange rate in a linear regression. The second definition refers to the response of prices relative to that of the exchange rate after any (exogenous) shock that moves the exchange rate. Its estimation requires a structural model with feedback effects, such as structural vector autoregression (SVAR) or DSGE models.[2] The ESCB expert group introduced the term “price-to-exchange-rate ratio” (PERR) for the second concept. The PERR more richly reflects the co-movement of prices and exchange rates, because it captures the various channels of transmission of an underlying economic shock, which are not modelled in single reduced-form equations. This article uses the “ERPT” when referring to the first concept, distinguishing it from the relative response of prices (or real quantities) and exchange rates (PERR) when analysing shock-dependence.
2.2 Estimates for the euro area using various approaches
A robust finding in the empirical literature is that the impact of exchange rates on inflation declines along the pricing chain. It is highest and fastest for import prices at the border, but significantly smaller and slower for final consumer prices, as nominal rigidities and other wedges accumulate across the production process all the way through to the final consumer prices. Generally, a simultaneous co-movement of the nominal effective exchange rate and prices is strong in the case of import prices, much weaker in the case of the producer price index (PPI) and barely noticeable for the consumer prices of non-energy industrial goods (see Chart 1).
Chart 1
Nominal effective exchange rate of the euro, import prices, PPI and consumer prices in the euro area
(year-on-year percentage changes)
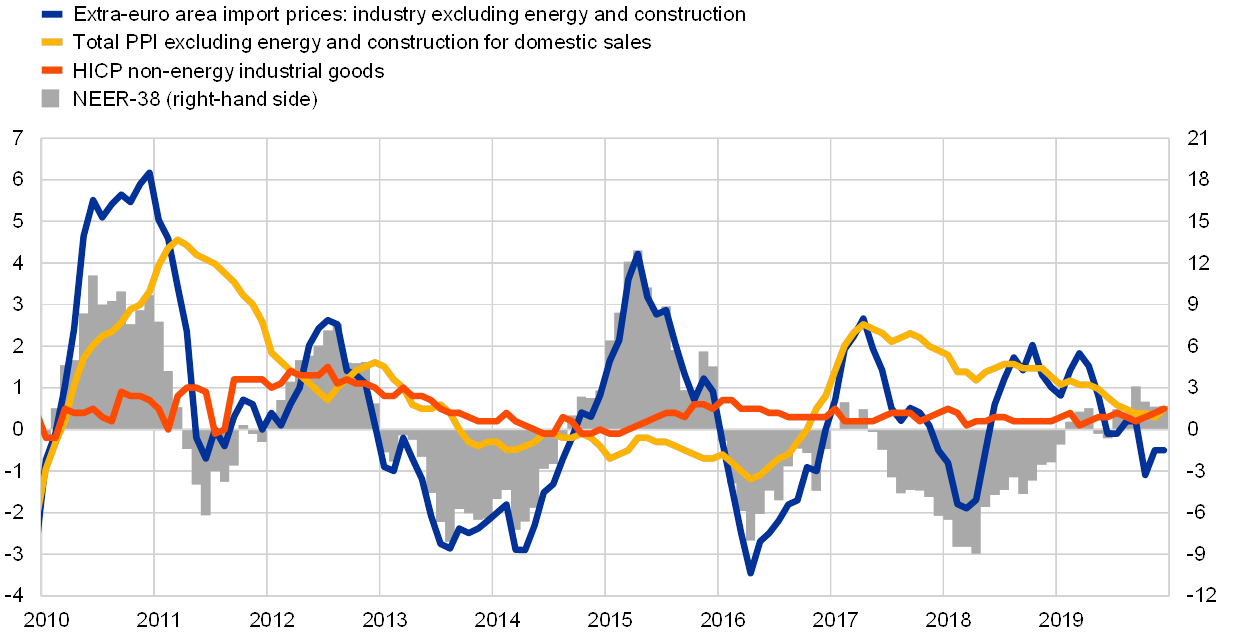
Sources: ECB and Eurostat.
Notes: NEER-38 refers to the nominal effective exchange rate against 38 trading partners. The latest observations are for December 2019.
Reduced-form estimates show that the ERPT to consumer prices is about one-tenth of the ERPT to import prices. ERPT estimates found in the literature are often based on different measures of import price or consumer price inflation and alternative measures of exchange rates, and are estimated over different time periods. Using consistent data, the evidence from reduced-form models suggests that a 1% depreciation of the euro raises total import prices in the euro area (including internal euro area trade) and its member countries by, on average, about 0.30% within a year. Over the same period, headline HICP rises by about 0.04%, although the estimates are not always significantly different from zero. These estimates for import and consumer prices are at the low end of the range of those found in the literature.[3] For non-euro area EU countries, the median ERPT to consumer prices is of a similar magnitude, while the median ERPT to import prices is somewhat higher (between 0.4% and 0.8%).[4]
The ERPT to import prices of the euro area as a whole declined from the end of the 1990s and has remained broadly stable over the past two decades, whereas the ERPT to consumer prices was very low over the same period. Our estimates are lower than those found in the scarce literature on the ERPT for the euro area that includes earlier decades. Time-varying estimates for the euro area show that the ERPT of the nominal effective exchange rate to extra-euro area import prices declined from around 0.8% in 1999 to around 0.3% in 2008 and remained broadly unchanged thereafter.[5] The ERPT to total import prices was more stable and fell only marginally. The estimate of the ERPT to euro area consumer prices based on this model is not statistically significant for most of the period (see Chart 2).
Chart 2
Time-varying ERPT to euro area import and consumer prices
(percentage impact on prices after four quarters following a 1% depreciation of the euro nominal effective exchange rate)

Source: ECB estimates.
Notes: The time-varying ERPT to import and consumer prices is estimated using single-equation regressions with drifting coefficients and stochastic volatility with data for the period from 1995 (for import prices) and 1997 (for consumer prices) to the fourth quarter of 2019. The lighter lines show the 16th and 84th percentiles of the posterior distribution and the darker line shows the median.
Time-varying estimates for the EU countries show a broadly stable ERPT to import and consumer prices since the end of the 1990s. The ERPT to import prices varies considerably across euro area and EU countries, but is generally higher than for consumer prices for almost all countries. The ERPT to total import prices in non-euro area EU countries is considerably higher than in euro area countries, partly reflecting intra-euro area trade being included in the estimates for the latter.[6]
Empirical evidence for a non-linear response of exchange rates in the euro area and its member countries is rather scarce. A number of factors may cause a non-linear response of import or consumer prices to exchange rate changes. Empirical studies suggest that the impact on prices may depend on the direction of change (appreciation or depreciation)[7] or the size of the change. The impact can also change with the state of the economy (for example, at different points in the business cycle and at different levels or variability of inflation).[8] New estimates that look at ERPT non-linearity for the euro area and its member countries find that, after one year, only large changes in the exchange rate have an impact on euro area import prices and headline HICP, which is consistent with, for example, sticky prices due to menu costs.[9] This study also finds that the ERPT to euro area import and consumer prices does not differ between depreciations and appreciations, which is in line with findings for the real exchange rate in the euro area.[10]
The ERPT across countries varies not only at the macro level, but also across sectors. A number of studies have shown that the pass-through to import prices is higher for energy compared with manufacturing products, as exporters appear to price-discriminate to a larger extent between markets for manufacturing goods than between those for commodities.[11] An update of earlier work on the ERPT to import prices in the euro area confirms these findings.[12] More specifically, the ERPT is found to be higher for euro area import prices in energy-related industries compared with manufacturing. Similar findings have also been reported for the ERPT to producer prices. Among the sub-sectors of industry (excluding construction), the ERPT to producer prices is largest in electricity, gas and water supply, as well as in the energy sector, and lowest for capital goods.[13]
3 Structural characteristics are key to explaining ERPT heterogeneity
The link between the exchange rate and inflation depends on the structural characteristics of industries and countries and how these characteristics evolve over time. Particularly relevant factors are the structure of the economy, the microeconomic structure and behaviour of firms, and the general macroeconomic environment, which are mirrored in the following structural characteristics of countries and sectors: trade openness and import penetration, integration in global value chains, the currency of trade invoicing and the degree of competition and market concentration. It is difficult to disentangle the effects of these factors, as they are intertwined and jointly determine the differences in the ERPT across countries and industries and over time. This section reviews the implications for the ERPT of each of these four structural characteristics separately, but refrains from ranking them by importance.
3.1 Trade openness
The more open a country is to imports, the higher the impact of the exchange rate on import and consumer prices. Trade liberalisation, lower trade costs and technological advances have boosted cross-border trade flows and favoured the organisation of production in cross-border production chains. Openness, as measured by the share of external trade in GDP, varies substantially across the euro area and non-euro area EU economies – with smaller countries generally being more open to trade. Compared with 1999, in most EU countries imports now account for a higher percentage of GDP (see Chart 3).
Chart 3
Imports of goods and services as a share of GDP
(nominal values in percentages)

Sources: Eurosystem projections database and Eurostat.
Notes: The chart shows extra-euro area imports for euro area countries and total imports for non-euro area EU countries. Data for Malta refer to 2004 and for Estonia and Croatia to 2000, rather than 1999.
The share of imports in private consumption is very important for the ERPT to consumer prices. The import content of private consumption is comprised of two parts. The first measures the share of final consumer products imported from other countries directly (direct import content). The second measures the share of foreign inputs used to produce domestic consumer goods (usually referred to as “indirect import content”).
The total (direct and indirect) import content of private consumption in the euro area was around 16% in 2014 and has been trending slightly upwards since 1999.[14] The import content of private consumption varies across countries, but for most countries the direct import share is approximately half of the total import content (see Chart 4). Simulation results from structural DSGE models show that low home bias (i.e. a high import content in consumption) is a key channel for exchange rate changes to have a greater impact on prices, as emphasised in the literature.[15]
Chart 4
Import content of headline HICP in 2014
(percentages of private consumption bundle consistent with headline HICP composition)

Source: ESCB expert group calculations based on methodology described by Schaefer, S. in Box 1 of Ortega, E. and Osbat, C. (eds.), op. cit.
3.2 Integration in global value chains
Another important determinant of the size of the ERPT is the integration in global value chains not only of a country, but also of its trading partners. When countries that export to the euro area source part of their inputs from the euro area itself, a change in the euro exchange rate will have a limited pass-through to euro area import prices because of counterbalancing effects on the input costs side.
Higher participation in global value chains is likely to reduce the ERPT. A structural two-country model with trade in intermediate goods and staggered price-setting shows that the higher the participation of a country’s trading partners in global value chains, the lower the pass-through to its import prices.[16] This finding is confirmed by an industry-level analysis that finds that the higher the use in production of inputs imported from the destination market, the lower the ERPT to import prices.[17]
The degree to which euro area consumer prices depend upon prices of inputs from outside the euro area is rather limited. A recent study finds that supply chain trade, both among domestic sectors and across countries, is an important determinant of consumer prices.[18] The estimated supply chain spillovers to consumer prices can be decomposed according to the country of origin, revealing that the relative weight of foreign input costs for the euro area as a whole is rather small after accounting for the effect of oil prices (see Chart 5). Results for individual countries vary, but reveal relatively strong production linkages within the euro area, which could dampen the exchange rate impact on domestic consumer prices. At the same time, an analysis using a DSGE for the euro area finds that removing the import content of production and exports would more than double the sensitivity of prices to exchange rate changes within the first year.[19]
Chart 5
Relative importance of supply chain spillovers by origin for domestic inflation
(percentage share of total supply chain effect)

Source: ECB calculations using World Input-Output Database (2013 release).
Notes: The decomposition is based on the method presented in Section 4.1.3 of the ECB Working Group on Global Value Chains, op. cit. Data refer to 2008.
3.3 Currency of invoicing
The euro and the US dollar dominate the invoicing of trade in the EU (see Chart 6). Although there is some variation between countries, a large share of extra-EU imports for most countries is invoiced in euro. This suggests a limited ERPT to euro area prices, as the share of euro area imports directly exposed to exchange rate fluctuations is small. Moreover, due to both the relatively large size of the euro area compared with other non-euro area EU countries and to the Single Market framework of the European Union, it is likely that trade within the EU is predominantly invoiced in euro.[20]
Chart 6
Invoice currency for imports of goods from countries outside the EU
(percentages)

Source: Eurostat.
Note: Data refer to 2018, except for Estonia and the euro area, where they refer to 2016.
The invoicing decision serves as an active channel through which producers adjust their prices according to their own market power and local competition conditions.[21] If an exporting firm invoices in its own currency, so-called producer currency pricing, its prices will be more sensitive to its own costs and less to the importer’s conditions. This will increase the ERPT to the importer’s import prices. By contrast, invoicing in the destination’s currency, so-called local currency pricing, will reduce the ERPT. Finally, exports invoiced in a third currency, so-called dominant currency pricing, also make prices less sensitive to the bilateral exchange rate and more to the developments of the dominant currency. However, the decision on what currency to invoice in mostly affects ERPT in the near to medium term. In the long run (often not captured by empirical models), producers can change the prices they charge when negotiating a new contract, irrespective of the currency of invoicing.
These conceptual considerations are supported by two new empirical country-specific studies using micro data. One finds a significantly higher pass-through on impact for Danish import prices denominated in other currencies compared with the pass-through for prices denominated in Danish kroner or euro.[22] Another study uses a firm-level analysis of Italian exports and finds a substantially lower ERPT to Italian export prices with local currency pricing than with dominant currency pricing, whereas the ERPT is highest with producer currency pricing.[23]
Taking into account the share of import invoicing in euro mechanically reduces the impact of exchange rates via the openness channel. Trade openness of the total economy, as measured by extra-euro area imports as a share of GDP and the import content of private consumption, would be reduced by almost half when excluding transactions denominated in euro.[24] For this reason, these measures may overestimate the potential sensitivity of prices to exchange rate movements if the currency of invoicing is not taken into account. An alternative would be to adjust the exchange rate measures, for example by exploring the use of invoicing currency weights as a complement to trade weights when computing nominal effective exchange rates or competitors’ export price indices.[25]
3.4 Market power
ERPT decreases as the market share of exporters increases, because firms with greater market power tend to adjust their markups in response to exchange rate changes in order to keep market shares constant. In other words, when competition is low the ERPT can be expected to be low. However, there may be a U-shaped relationship between the ERPT and market power. Under monopolistic competition, the market shares of both very small and very large exporters face little impact if they change their prices, and they would thus pass through most of the exchange rate movement to selling prices. Empirical evidence of this non-linearity is inconclusive, as some studies find that the ERPT decreases monotonically with market share[26], while others confirm the U-shaped relationship.[27] Another possible non-linearity can be related to funding constraints: financially constrained firms may have a higher ERPT, as they find it harder to hedge against exchange rate changes.[28] Large firms, however, may be able to resort to exchange rate hedging via financial instruments, which would further decrease the sensitivity of their prices to exchange rate movements.[29]
Local distribution margins also matter. When faced with strong competition, local distributors absorb exchange rate fluctuations in their margins, thus reducing pass-through to consumer prices compared with prices at the border. An analysis using daily transaction-level data for package holiday consumer prices in Germany finds that the ERPT is lower for services with higher markups (more productive firms or firms selling higher-quality goods) and also for those with higher distribution costs.[30]
4 ERPT variation: the shocks matter
In addition to the structural determinants discussed above, the impact of exchange rates on inflation also depends on the combination of shocks affecting the economy at each point in time.[31] Seven different DSGE models for the euro area were used to obtain simulations for four types of shocks: an exogenous exchange rate shock, a domestic demand shock, a domestic supply shock and a monetary policy shock. As described in Section 2.1, the PERR is an appropriate measure of the impact of the exchange rate on inflation when analysed through the lens of DSGE models, therefore the results for this measure are discussed below.
The median results across the models show that the relative response of import prices to the exchange rate (the price-to-exchange rate ratio, or PERR) is highest following a monetary policy shock. It is also rather high after an exchange rate shock, but somewhat smaller after demand and supply shocks (see panel (a) in Chart 7). The PERRs for consumer prices are smaller than for import prices after all shocks, albeit the difference declines at longer horizons. The relative importance of shocks is similar (see panel (b) in Chart 7). Overall, the results are rather similar across these models for the exchange rate and monetary policy shocks. Uncertainty is larger for the responses to aggregate demand and supply shocks, as reflected by rather wide interquartile ranges of the outcomes, particularly at longer time horizons.[32]
Chart 7
Shock-dependent price-to-exchange-rate ratios for the euro area
(percentage points)

Source: Ortega, E. and Osbat, C. (eds.), op. cit.
Notes: Exchange rate shock is defined as a depreciation of the euro nominal effective exchange rate. The charts report the median estimate for each shock and horizon from the euro area DSGE models developed at the Banca d’Italia, Suomen Pankki – Finlands Bank (included only for consumer prices and excluded from the median for the aggregate supply shock), De Nederlandsche Bank, Deutsche Bundesbank, ECB, Nationale Bank van België/Banque Nationale de Belgique and Banca Naţională a României. For more information on the models, see Table 3 in Ortega, E. and Osbat, C. (eds.), op. cit.
Estimates of PERR responses obtained using structural VAR models (SVAR) show similar responses at impact to those obtained using DSGE models, but a somewhat different path thereafter. This reflects the nature of DSGE models as, compared with SVAR models, they more explicitly model structural features of the economy such as price stickiness, import content, effects of the distribution sector and switching from domestic goods to foreign goods in response to price changes. In addition, DSGE models encompass rich feedback interactions within an economy that are captured less explicitly in SVAR models (such as monetary policy responses).
Sensitivity analysis confirms that the structural characteristics of the economy matter for the PERR after an exchange rate shock. Simulations performed using a euro area DSGE model developed in De Walque et al. show that a higher nominal rigidity of import prices visibly lowers the PERR for import prices at the border.[33] This effect disappears after around a year, beyond which prices are allowed to adjust in the baseline specification. Less use of imported intermediate products in domestic production, including for producing exports, in turn increases the consumer price PERR, because a higher share of domestic consumption is subject to expenditure-switching effects and monetary policy reacts more actively. Distribution sector margins were not found to have a significant impact on the results.[34]
Qualitatively, PERR estimates are rather robust across DSGE models for monetary policy and exchange rate shocks, but assessing what exact combination of shocks determines movements in the exchange rate at any point in time is a much more uncertain task. Recent literature advocates using SVAR models to obtain such exchange rate decompositions.[35] The results from four alternative SVAR models for the euro area reveal that the outcomes are relatively similar in terms of the response of prices to a given type of shock, but rather different across the models in terms of the historical contributions of each shock to exchange rate changes through time.[36] This large uncertainty about the exact shock decomposition at a given point in time cautions against relying on one specific model when evaluating which shocks drive exchange rate changes.
Although this article mainly focuses on analysing the impact of the exchange rate on prices, the model-based analysis used naturally also provides information on the impact of exchange rates on growth. In parallel with the PERR, the growth-to-exchange-rate ratio estimates obtained from DSGE models show that real GDP growth in the euro area increases following exchange rate depreciations that are due to monetary policy shocks. However, the uncertainty surrounding the estimates is somewhat larger for growth than for prices. Box 1 provides a brief overview of the main findings regarding the impact on growth of exchange rates and their sensitivity to some structural characteristics.
Box 1The impact of exchange rates on real GDP growth
This box examines the link between the exchange rate and real GDP growth over time, which is closely related to analysing the impact on inflation of the exchange rate. Indirect transmission channels through the real economy are important, because exchange rate movements affect not only prices but also economic activity, which, in turn, might trigger price changes.
The exercise is conducted through the simulation of multiple models: DSGE open-economy models and structural VAR models for the euro area.[37] The models entail different specifications and values of parameters, therefore the comparison across models allows more robust results concerning the exchange rate effects to be obtained.[38]
The exchange rate is an endogenous variable, whose contribution to growth can vary over time and depend on the type of shock that is moving it. Following the approach in the literature, it is possible to derive a time-varying and shock-dependent measure of the relative response of growth and of the exchange rate itself conditional on shocks to domestic monetary policy, the exchange rate, domestic aggregate demand and domestic aggregate supply.[39] Analogous to the PERR, one can define a “growth-to-exchange-rate ratio”. Chart A shows the simulations for this growth-to-exchange-rate ratio following an exchange rate shock (i.e. an uncovered interest rate parity shock, or UIP), derived from a DSGE model for the euro area developed by De Walque and co-authors.[40]
Chart A
Growth-to-exchange-rate ratios and sensitivity analysis for the exchange rate (UIP) shock
(percentage points)

Source: ESCB expert group calculations based on the model by De Walque, G. et al., op. cit.
Note: An increase in the nominal exchange rate corresponds to a euro depreciation in nominal terms. GDP growth is measured in real terms. The simulation shows the percentage point impact after a +1% UIP shock, which follows an autoregressive process of order one with persistence set to 0.9.
The growth-to-exchange-rate ratios corresponding to the benchmark case suggest that GDP increases only slightly (see Chart A). The transmission mechanism proceeds as follows: given the exchange rate depreciation, import prices increase at the border and euro area households replace US dollar-denominated bonds with euro-denominated ones due to higher returns.[41] At the same time, export prices (expressed in the currency of the destination market) fall and the implied expenditure-switching effect favours euro area exports and reduces euro area imports. Overall, consumer prices increase following the increase in euro area import prices. The central bank raises the monetary policy rate to counterbalance higher inflation pressures. The higher monetary policy rate and risk premium induce households and firms to reduce consumption and investment in the euro area. Thus, GDP increases only slightly due to higher net exports.
The sensitivity analysis for the UIP shock gives an indication of the respective role of the different structured factors examined: (i) wholesale (border) import prices are fully flexible; (ii) there is no distribution sector; (iii) there are no foreign intermediate inputs in domestic production; and (iv) exports do not have import content.[42] The results show that, first, in the absence of import price nominal rigidities, the implied import price response at the border is nearly twice as large on impact but returns to the benchmark after one year. Second, in the absence of distribution sector margins, the expenditure-switching effect induced by the devaluation is stronger, such that net trade and GDP improve compared with the benchmark. Third, once foreign intermediate inputs are removed from the list of production factors, the calibration of the share of imported consumption goods is doubled in order to keep the import-to-GDP ratio unchanged across different simulations. The greater weight of imported goods in the consumption basket magnifies the effect of the exchange rate on consumer price dynamics, monetary policy and GDP growth accordingly. Finally, when both foreign intermediate inputs and the import content of exports are set to zero, and the calibrated share of imports in the consumption basket is increased to match the import-to-GDP ratio, the GDP response becomes about four times larger than in the benchmark for the first year.
The estimates of the effect of the exchange rate changes on GDP growth reveal a rather high disagreement across the models. The growth-to-exchange-rate ratio estimates obtained from seven euro area DSGE models suggest that real GDP growth in the euro area rapidly increases in the short term following exchange rate depreciations that are due to monetary policy and domestic supply shocks (see Table A). However, depreciations due to exogenous exchange rate shocks explain a very small percentage of the change in GDP growth. The results obtained from four SVAR models, in turn, show sizeable effects across models for exogenous exchange rate shocks and domestic demand shocks. Overall, the impact of exchange rate shocks on GDP growth is less evident than it is on prices. After general equilibrium effects and time series dynamics are taken into account, the uncertainty surrounding the estimates is larger for growth than for prices.[43]
Table A
Empirical estimates for shock-dependent real GDP to exchange rate ratios in the euro area

Source: ESCB expert group on exchange rate calculations.
Notes: The table reports the median estimate for each shock and horizon from the euro area DSGE models developed at the Banca d’Italia, Suomen Pankki – Finlands Bank (excluded from the median for the domestic supply shock), De Nederlandsche Bank, Deutsche Bundesbank, ECB, Nationale Bank van België/Banque Nationale de Belgique and Banca Naţională a României. For more information on the models, see Table 3 in Ortega, E. and Osbat, C. (eds.), op. cit. The median responses for SVAR models are calculated from the four SVAR models referred to in footnote 36.
5 Conclusions
The impact of exchange rate changes on inflation depends on the shocks and on the reaction of monetary policy. Finding a small unconditional impact empirically does not therefore mean that the exchange rate has no impact on inflation. When considering the shock-dependence of the ERPT, it is important to distinguish between the ERPT estimate in a pricing equation and the relative response of prices and exchange rates to a structural shock. In fact, the more credibly and effectively monetary policy counteracts external inflationary pressures, the lower ex post statistical estimates of the ERPT will be when estimated using reduced-form equations, whereas estimates from structural models are less affected. The exchange rate channel is important for domestic inflation shocks as well. An interest rate hike after an inflationary domestic demand shock would imply an exchange rate appreciation and hence a fall in import prices, which would counterbalance the initial domestic inflation pressures.[44]
For the euro area, the exchange rate serves as a crucial transmission channel not only for conventional, but also for unconventional monetary policy.[45] Model simulations show that, under the effective lower bound and with credible forward guidance of continued unchanged interest rates, the relative response of inflation and exchange rates will be higher than without forward guidance. This finding is robust across the seven euro area DSGE models that underlie the results reported in this article (see the notes for Chart 7). These results suggest that the monetary policy stance is very relevant for the overall interaction of exchange rates with prices throughout the pricing chain.
Non-standard monetary policy tools other than forward guidance also have an impact on the ERPT. Structural model-based analysis shows that the announcement of the asset purchase programmes, such as the asset purchase programme announced in 2015 by the ECB, led to a situation where the extent of depreciation and the intensity of price responses depended on the structural characteristics of each economy.[46] Other non-standard measures, such as the introduction of an exchange rate floor (as in the Czech Republic in November 2013), also had an impact on the ERPT – the effects on inflation were stronger and longer-lasting than in normal times.[47]
In order to evaluate the impact of exchange rate changes on consumer prices, it is important to use models that capture structural characteristics of the economy. This encompasses tracing the effect of exchange rates depending on the nature of the underlying shocks and accounting for the monetary policy response to these shocks.
- A comprehensive report on the findings of the expert group, including a more detailed discussion of the ERPT definition, various determinants and empirical findings, as well as a more comprehensive list of references than that provided in this article, is available in Ortega, E. and Osbat, C. (eds.), “Exchange rate pass-through in the euro area and EU countries”, Occasional Paper Series, No 241, ECB, Frankfurt am Main, 2020.
- The first notion of ERPT can also be retrieved from the SVAR and DSGE models, but it refers to the exchange rate pass-through parameter in a pricing equation, all else being equal. Hence, it abstracts from all the endogenous responses and feedback effects that are embedded by structural models.
- See, for example, Hahn, E., “Pass-Through of External Shocks to Euro Area Inflation”, Working Paper Series, No 243, ECB, Frankfurt am Main, 2003; Hüfner, F. and Schröder, M., “Exchange rate pass-through to consumer prices: a European perspective”, Aussenwirtschaft, Vol. 58, No 3, 2003, pp. 383-412; Choudhri, E., Faruqee, H. and Hakura, D., “Explaining the exchange rate pass-through in different prices”, Journal of International Economics, Vol. 65, No 2, 2005, pp. 349-374; Goldberg, L. and Campa, J., “The sensitivity of the CPI to exchange rates: distribution margins, imported inputs, and the trade exposure”, The Review of Economics and Statistics, Vol. 92, No 2, 2010, pp. 392-407; and Ben Cheikh, N. and Rault, C., “Investigating first-stage exchange rate pass-through: Sectoral and macro evidence from euro area countries”, The World Economy, Vol. 40, No 12, 2017, pp. 2611-2638.
- The estimates refer to the median estimates across countries for the period from the first quarter of 1999 to the first quarter of 2019; non-euro area EU countries include the Czech Republic, Denmark, Croatia, Hungary, Poland, Sweden and the United Kingdom.
- This is in line with the fall in the ERPT to import and consumer prices since the 1980s and 1990s that is documented in the literature. For an analysis and an exhaustive literature review see, for example, Campa, J. and Goldberg, L., “Pass-Through of Exchange Rates to Consumption Prices: What has Changed and Why?”, in Ito, T. and Rose, A. (eds.), International Financial Issues in the Pacific Rim: Global Imbalances, Financial Liberalization, and Exchange Rate Policy, National Bureau of Economic Research, 2008, pp. 139-176.
- Time-varying ERPT estimates for import and consumer prices for individual EU countries are reported in Section 2.2 of Ortega, E. and Osbat, C. (eds.), op. cit.
- Asymmetric pass-through is documented for a few advanced economies by Delatte, A.-L. and López-Villavicencio, A., “Asymmetric exchange rate pass-through: Evidence from major countries,” Journal of Macroeconomics, Vol. 34, No 3, 2012, pp. 833-844.
- For available empirical work related to non-linear ERPT in the euro area, see the references in Section 2.3 of Ortega, E. and Osbat, C. (eds.), op. cit.
- See Colavecchio, R. and Rubene, I., “Non-linear exchange rate pass-through to euro area inflation: a local projection approach”, Working Paper Series, No 2362, ECB, Frankfurt am Main, 2020.
- For findings on the real exchange rate, see Lane, P. R. and Stracca, L., “Can appreciation be expansionary? Evidence from the euro area”, Economic Policy, Vol. 33, No 94, 2018, pp. 225-264.
- See, for example, Campa, J. and Goldberg, L., “Pass-Through of Exchange Rates to Consumption Prices: What has Changed and Why?”, op. cit.; and Ben Cheikh, N. and Rault, J., op. cit.
- See Osbat, C., Sun, Y. and Wagner, M., “Sectoral exchange rate pass-through in the euro area”, Working Paper Series, forthcoming, ECB, Frankfurt am Main, 2020. Their results have a caveat in that the estimates have large confidence bands, but more broadly they are consistent with those in Imbs, J. and Mejean, I., “Elasticity Optimism”, American Economic Journal: Macroeconomics, Vol. 7, No 3, 2015, pp. 43-83.
- See Hahn, E., “The impact of exchange rate shocks on sectoral activity and prices in the euro area”, Working Paper Series, No 796, ECB, Frankfurt am Main, 2007.
- See Schaefer, S., “Import share in the HICP consumption basket”, Box 1, Ortega, E. and Osbat, C. (eds.), op. cit.
- See, for example, De Walque, G. et al., “Low pass-through and high spillovers in NOEM: what does help and what does not”, mimeo, ECB inflation conference, 2019.
- See, for example, Georgiadis, G., Gräb, J. and Khalil, M., “Global value chain participation and exchange rate pass-through”, Working Paper Series, No 2327, ECB, Frankfurt am Main, 2019.
- According to De Soyres, F. et al., “Bought, sold, and bought again: the impact of complex value chains on export elasticities”, Policy Research Working Papers, No WPS8535, World Bank Group, Washington, D.C., 2018, the export price ERPT falls as the level of foreign value-added in exports increases.
- See the ECB Working Group on Global Value Chains, “The impact of global value chains on the euro area economy”, Occasional Paper Series, No 221, ECB, Frankfurt am Main, 2019.
- See De Walque, G. et al., op. cit.
- According to Eurostat data, imports in non-euro area EU countries are invoiced mostly in dominant currencies (US dollar and euro). Imports of petroleum goods in most euro area countries are mainly denominated in US dollars. In some countries, the high share of dollar invoicing may also be related to the activity of multinational enterprises (e.g. in Ireland, the Netherlands and Malta).
- See, for example, Bacchetta, P. and van Wincoop, E., “A theory of the currency denomination of international trade”, Journal of International Economics, Vol. 67, No 2, 2005, pp. 295-319; and Goldberg, L. and Tille, C., “Micro, macro, and strategic forces in international trade invoicing: Synthesis and novel patterns”, Journal of International Economics, Vol.102, 2016, pp.173-187.
- See Kristoffersen, M. S., “Invoicing currency and exchange rate pass-through to import prices in Danish firms”, Box 4, Ortega, E. and Osbat, C. (eds.), op. cit.
- See Borin, A. and Mattevi, E., “Invoicing currency, ERPT to export prices and business activity: evidence from an analysis of Italian firms”, Box 3, Ortega, E. and Osbat, C. (eds.), op. cit.
- As reported above, almost half of the euro area’s extra-EU trade is denominated in euro.
- Recent contributions to the literature point in the same direction. See, for example, Chen, N., Chung, W. and Novy, D., “Vehicle Currency Pricing and Exchange Rate Pass-Through”, CESifo Working Paper Series, No 7695, CESifo Group Munich, 2019.
- See Amiti, M., Itskhoki, O. and Konings, J., “Importers, Exporters, and Exchange Rate Disconnect”, American Economic Review, Vol. 104, No 7, 2014, pp.1942-1978.
- See Devereux, M. B., Dong, W. and Tomlin, B., “Importers and exporters in exchange rate pass-through and currency invoicing”, Journal of International Economics, Vol.105, 2017, pp. 187-204.
- See Strasser, G., “Exchange rate pass-through and credit constraints”, Journal of Monetary Economics, Vol. 60, No 1, 2013, pp. 25-38.
- See Dekle, R. and Ryoo, H., “Exchange rate fluctuations, financing constraints, hedging, and exports: Evidence from firm level data”, Journal of International Financial Markets, Institutions and Money, Vol. 17, No 5, 2007, pp. 437-451.
- See Nagengast, A., Bursian, D. and Menz, J.-O., “Dynamic pricing and exchange rate pass-through: Evidence from transaction-level data”, Discussion Papers, No 16/2020, Deutsche Bundesbank, Frankfurt am Main, 2020.
- See, for example, Corsetti, G. and Dedola, L., “A macroeconomic model of international price discrimination”, Journal of International Economics, Vol. 67, No 1, 2005, pp. 129-155; and Forbes, K., Hjortsoe, I. and Nenova, T., “The shocks matter: improving our estimates of exchange rate pass-through”, Journal of International Economics, Vol. 114, 2018, pp. 255-275.
- For a more detailed comparison and a discussion of PERRs obtained from DSGE and SVAR models, see Section 4 in Ortega, E. and Osbat, C. (eds.), op. cit.
- For further details on the model used, see De Walque, G. et al., “An estimated two-country EA-US model with limited exchange rate pass-through”, NBB Working Papers, No 317, National Bank of Belgium, 2017.
- For a more detailed discussion, see Section 4.3.1 in Ortega, E. and Osbat, C. (eds.), op. cit.
- See, for example, Forbes, K. et al., “The shocks matter: improving our estimates of exchange rate pass-through”, Journal of International Economics, Vol. 114, 2018, pp. 255-275.
- The four SVAR models used were from: i) Comunale, M. and Kunovac, D., “Exchange rate pass-through in the euro area”, Working Paper Series, No 2003, ECB, Frankfurt am Main, 2017; ii) an updated version of Conti, A. et al., “Low inflation and monetary policy in the euro area”, Working Paper Series, No 2005, ECB, Frankfurt am Main, 2017; iii) a model for the euro area using an identification presented in Forbes, K. et al., op. cit.; and iv) Leiva-Leon, D. et al., “Exchange rate shocks and inflation comovement in the euro area”, Working Paper Series, No 2383, ECB, Frankfurt am Main, 2020. Model comparison shows that when an ex ante specific monetary policy shock can be identified, such as the announcement of the asset purchase programme by the ECB in 2014, then the models broadly agree on which main shocks drive the exchange rate. See, for example, Section 5 in Ortega, E. and Osbat, C. (eds.), op. cit.; and Comunale, M., “Shock dependence of exchange rate pass-through: a comparative analysis of BVARs and DSGEs”, Working Paper Series, No 75/2020, Bank of Lithuania, 2020.
- All DSGE models are based on a new Keynesian framework, i.e. on nominal (price and/or wage) rigidities. Monetary policy, modelled by a systematic feedback (Taylor) rule on the short-term policy rate, has a non-trivial stabilisation role.
- For a review of the literature related to the exchange rate impact on growth, see Eichengreen, B., “The real exchange rate and economic growth”, Commission on Growth and Development Working Paper, No 4, World Bank, Washington, D.C., 2008. For a more recent approach, see Habib, M. M. et al., “The real exchange rate and economic growth: Revisiting the case using external instruments”, Journal of International Money and Finance, Vol. 73, 2017, pp. 386-398.
- This approach was first proposed in Shambaugh, J., “A new look at pass-through”, Journal of International Money and Finance, Vol. 27, No 4, 2008, pp. 560-294, and popularised by Forbes and co-authors, for example in Forbes, K. et al., op. cit.
- For a description of the model, see De Walque, G. et al., op. cit.
- The aggregate import price adjusts only gradually to changes in the exchange rate because of the time-dependent Calvo signal received by individual firms (firms adjust short-run markups). Import prices at the consumer level adjust to a lower extent than at the border, because prices of the distribution services change at a more gradual pace.
- For a more detailed explanation of how the transmission mechanism works when passing from one assumption to the other, see De Walque, G. et al., op. cit.
- For details on inflation, see Comunale, M., op. cit.
- Agents expect interest rate changes that will move the exchange rate so that import prices will return back to their steady state values. Hence, these shocks will have a relatively low impact on import price inflation if the policy is expected to react aggressively. For further discussion, see, for example, Carriere-Swallow, Y. et al., “Monetary Policy Credibility and Exchange Rate Pass-Through”, IMF Working Paper, No 16/240, Washington, D.C., 2016. In the context of Phillips curve analysis, a similar argument was recently also made in McLeay, M. and Tenreyro, S., “Optimal Inflation and the Identification of the Phillips Curve”, NBER Macroeconomics Annual, Vol. 34, 2019.
- For a more detailed review of the effects of unconventional monetary policy measures in the euro area on the ERPT, and in particular of the effect of interest rates forward guidance, see Section 6 in Ortega, E. and Osbat, C. (eds.) op. cit.
- See, for example, Bokan, N. et al., “EAGLE-FLI: A macroeconomic model of banking and financial interdependence in the euro area”, Working Paper Series, No 1923, ECB, Frankfurt am Main, 2016; and Coenen, G. et al., “The New Area-Wide Model II: an extended version of the ECB’s micro-founded model for forecasting and policy analysis with a financial sector”, Working Paper Series, No 2200, ECB, Frankfurt am Main, 2018 (rev. 2019).
- For an assessment of the introduction of the exchange floor, see Brůha, J. and Tonner, J., “An Exchange Rate Floor as an Instrument of Monetary Policy: An Ex-post Assessment of the Czech Experience”, Working Paper Series, No 4, Czech National Bank, 2017.