
- PRESS RELEASE
- 29 April 2020
Euro area economic and financial developments by institutional sector: fourth quarter of 2019
- Euro area net saving increased to €853 billion in the four quarters to the fourth quarter of 2019, compared with €826 billion in the four quarters to the previous quarter. Euro area net non-financial investment decreased to €563 billion (from €586 billion previously), due to decreased investment by non-financial corporations. Euro area net lending to the rest of the world increased to €298 billion (from €249 billion previously).
- The household debt-to-income ratio[1] stood broadly unchanged, at 93.7% in the fourth quarter of 2019, as compared with the fourth quarter of 2018. Non-financial corporations' debt-to-GDP ratio (consolidated measure) increased to 77.4% in the fourth quarter of 2019, from 77.1% in the fourth quarter of 2018; the non-consolidatedwider debt measure decreased to 138.4% from 138.9%.
- This release presents financial transactions (flows) and assets and liabilities (stocks) for deposits, loans, debt securities, listed shares and investment fund shares, with a counterpart sector breakdown. The corresponding charts (see Charts 2 and 3) show that most financial assets of households are liabilities of financial intermediaries, which in turn provide most of the financing to non-financial corporations. The developments of the financial links between the resident sectors, and with the rest of the world, are presented in Table 1.
Total euro area economy
Euro area net saving increased to €853 billion (8.8% of euro area net disposable income) in the four quarters to the fourth quarter of 2019 compared with €826 billion in the four quarters to the previous quarter. Euro area net non-financial investment decreased to €563 billion (5.8% of net disposable income), due to decreased investment by non-financial corporations, while net investment by households, financial corporations and government were broadly unchanged.
Euro area net lending to the rest of the world increased to €298 billion (from €249 billion previously) reflecting the increased net saving and the decreased net non-financial investment. Net borrowing by non-financial corporations decreased to €22 billion (that is -0.2% of net disposable income, after -0.5% in the previous quarter). Net lending by financial corporations (€107 billion and 1.1% of net disposable income) and by households (€290 billion and 3.0% of net disposable income) remained broadly stable. In addition to the increase in net lending by the total private sector, the increase in the euro area net lending was also supported by a decrease in net borrowing by the government sector (-0.8% of net disposable income, after -1.0% previously).
Euro area saving, investment and net lending to the rest of the world
(EUR billions, four-quarter sums)

* Net saving minus net capital transfers to the rest of the world (equals change in net worth due to transactions).
Financial transactions can be presented with a counterpart sector breakdown for deposits, loans, debt securities, listed shares and investment fund shares (see Table 1). In 2019 the largest transactions in these financial instruments within the euro area were financial investments between other MFIs[2] (€434 billion), financial investments of households with other MFIs (€350 billion), mostly in the form of deposits, and financing received by households from other MFIs (€199 billion) in the form of loans. Financial transactions with the rest of the world were largest for investment funds, both regarding financial investment by euro area investment funds in instruments issued by the rest of the world (€318 billion) as well as financing received from the rest of the world (€253 billion).
Selected financial transactions* between sectors and with the rest of the world
(EUR billions, four-quarter sums, 2019) * Financial instruments for which the counterpart sector breakdown is available: deposits, loans, debt securities, listed shares and investment fund shares/unit
Households
The annual growth rate of household financial investment stood at an unchanged rate of 2.6% in the fourth quarter of 2019, with most of its components also showing rather stable annual rates of growth (see Table 2).
Households were overall net sellers of listed shares. Net sales of listed shares of non-financial-corporations and MFIs were only partly compensated by net purchases of listed shares of other financial institutions and the rest of the world sector (i.e. shares issued by non-residents). Households continued to sell debt securities (in net terms) issued by MFIs and general government, as well as non-financial corporations (see Table 2.2. in the Annex).
Financial investments and financing of households, main items
(annual growth rates)
Financial transactions |
|||||
2018 Q4 |
2019 Q1 |
2019 Q2 |
2019 Q3 |
2019 Q4 |
|
Financial investment* |
2.2 |
2.4 |
2.5 |
2.6 |
2.6 |
Currency and deposits |
4.1 |
4.8 |
5.0 |
5.3 |
5.1 |
Debt securities |
-3.2 |
2.1 |
-1.4 |
-7.5 |
-8.6 |
Shares and other equity |
0.7 |
-0.3 |
0.1 |
0.1 |
0.3 |
Life insurance and pension schemes |
2.2 |
2.3 |
2.5 |
2.7 |
2.6 |
Financing** |
3.2 |
3.6 |
3.5 |
4.0 |
3.9 |
Loans |
3.3 |
3.4 |
3.3 |
3.5 |
3.5 |
* Items not shown include: loans granted, prepayments of insurance premiums and reserves for outstanding claims and other accounts receivable.
** Items not shown include: financial derivatives net liabilities, pension schemes and other accounts payable.
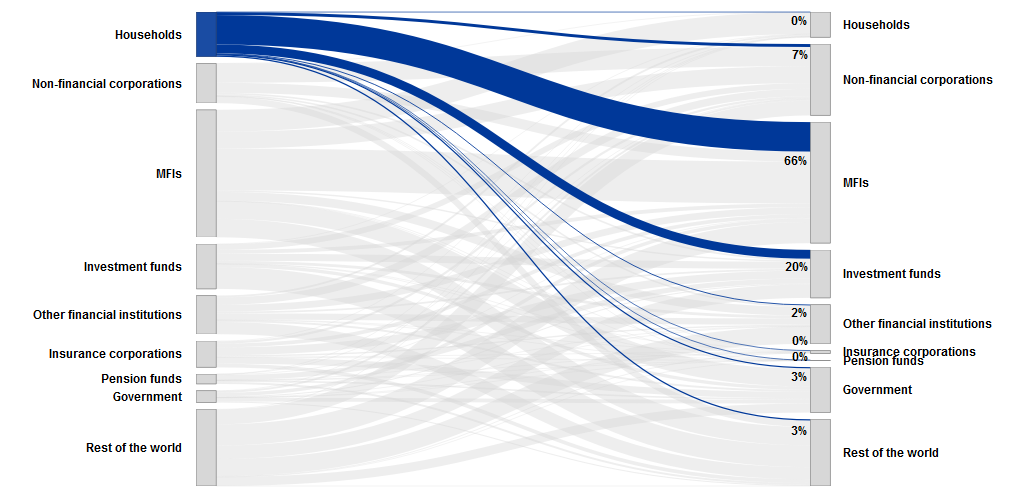
Chart 2 below shows the stock of selected households’ financial assets (in dark blue) vis-à-vis counterpart sectors.[3] At the end of 2019, households’ financial assets with a counterpart sector breakdown were mostly liabilities of financial intermediaries such as MFIs (66% of outstanding amounts) and investment funds (20%). Direct holdings of financial assets issued by non-financial corporations (7%), government (3%) and the rest of the world (3%), e.g. in the form of listed shares and debt securities, represented much lower shares of households’ financial assets.
Households’ financial assets by counterpart sector; selected financial instruments*
(EUR billions, 2019 end of period stocks)
* Financial instruments for which the counterpart sector breakdown is available: deposits, loans, debt securities, listed shares and investment fund shares/units.
The household debt-to-income ratio[4] stayed broadly unchanged at 93.7% in the fourth quarter of 2019, as disposable income grew at a similar rate as the outstanding amount of loans to households. The household debt-to-GDP ratio slightly increased to 57.9% in the fourth quarter of 2019 from 57.7% in the fourth quarter of 2018.
Non-financial corporations
In the fourth quarter of 2019, the annual growth of financing of non-financial corporations increased to 1.7%, after 1.4% in the previous quarter, mainly due to increased financing in the form of equity and, to a lesser extent, loans (see Table 3 below). The annual growth rate of loan financing increased to 1.8% from 1.6% previously, as the growth of intercompany loans turned positive, which was only partially offset by a slower increase in loans from MFIs and the rest of the world, as well as the growth rate of loans from non-MFI financial institutions turning negative (see Table 3.2. in the Annex).[5]
Financial investments and financing of non-financial corporations, main items
(annual growth rates)
Financial transactions |
|||||
2018 Q4 |
2019 Q1 |
2019 Q2 |
2019 Q3 |
2019 Q4 |
|
Financing* |
1.6 |
1.6 |
1.3 |
1.4 |
1.7 |
Debt securities |
4.3 |
4.7 |
5.5 |
5.8 |
5.9 |
Loans |
2.9 |
2.0 |
1.9 |
1.6 |
1.8 |
Shares and other equity |
0.7 |
0.8 |
0.7 |
0.9 |
1.5 |
Trade credits and advances |
2.5 |
2.2 |
-0.0 |
0.1 |
0.3 |
Financial investment** |
2.4 |
2.3 |
1.6 |
1.7 |
2.2 |
Currency and deposits |
4.4 |
5.6 |
5.3 |
6.2 |
5.8 |
Debt securities |
2.1 |
-2.6 |
-7.2 |
-3.2 |
-6.9 |
Loans |
2.2 |
1.5 |
1.2 |
0.4 |
1.2 |
Shares and other equity |
1.8 |
1.9 |
1.7 |
1.8 |
2.4 |
* Items not shown include: pension schemes, other accounts payable, financial derivative's net liabilities and deposits.
** Items not shown include: other accounts receivable and prepayments of insurance premiums and reserves for outstanding claims.
Non-financial corporations' debt-to-GDP ratio (consolidated measure) increased to 77.4% in the fourth quarter of 2019, from 77.1% in the fourth quarter of 2018; the non-consolidated, wider debt measure decreased to 138.4% from 138.9%.
Chart 3 below shows the non-financial corporations’ debt (in dark blue) vis-à-vis counterpart sectors. At the end of 2019, the non-financial corporations’ debt in the form of loans and debt securities was held primarily by MFIs (35%), other non-financial corporations (28%), the rest of the world (15%) and other financial institutions (12%).
The main components of NFC debt (loans and debt securities) by counterpart sector
(EUR billions, 2019 end of period stocks)

Annexes
For media queries, please contact Philippe Rispal, tel.: +49 69 1344 5482.
Notes
- These data come from a second release of quarterly euro area sector accounts from the European Central Bank (ECB) and Eurostat, the statistical office of the European Union. This release incorporates revisions and completed data for all sectors compared with the first quarterly release on "Euro area households and non-financial corporations" of 7 April 2020.
- The debt-to-GDP (or debt-to-income) ratios are calculated as the outstanding amount of debt in the reference quarter divided by the sum of GDP (or income) in the four quarters to the reference quarter. The ratio of non-financial transactions (e.g. savings) as a percentage of income or GDP is calculated as sum of the four quarters to the reference quarter for both numerator and denominator.
- The annual growth rate of non-financial transactions and of outstanding assets and liabilities (stocks) is calculated as the percentage change between the value for a given quarter and that value recorded four quarters earlier. The annual growth rates used for financial transactions refer to the total value of transactions during the year in relation to the outstanding stock a year before.
- The next release of the Household Sector Report containing results for the euro area and all EU countries is scheduled for 12 May 2020.
- Hyperlinks in the main body of the press release lead to data that may change with subsequent releases as a result of revisions. Figures shown in annex tables are a snapshot of the data as at the time of the current release.
- [1]Calculated as loans divided by gross disposable income adjusted for the change in pension entitlements.
- [2]Other MFIs include banks and money market funds but exclude the Eurosystem.
- [3]This excludes relevant financial instruments such as unlisted shares, other equity, life insurance and annuity entitlements, pension schemes and other accounts payable for which the counterpart sector breakdown is not available.
- [4]Calculated as loans divided by gross disposable income adjusted for the change in pension entitlements.
- [5]Loan financing comprises loans granted by all euro area sectors (in particular MFIs, non-monetary financial institutions and other non-financial corporations) and by creditors that are not resident in the euro area.
Evropska centralna banka
Generalni direktorat Stiki z javnostjo
- Sonnemannstrasse 20
- 60314 Frankfurt na Majni, Nemčija
- +49 69 1344 7455
- media@ecb.europa.eu
Razmnoževanje je dovoljeno pod pogojem, da je naveden vir.
Kontakti za medije