- PRESS RELEASE
- 8 June 2020
EU structural financial indicators: end of 2019
- Further decline – by 6.3% on average – in number of bank branches in most EU Member States
- Number of bank employees also continued to fall by 0.9% on average
- Share of total assets of the five largest banks, at national level, ranged from 28% to 97%
The European Central Bank (ECB) has updated its dataset of structural financial indicators for the banking sector in the European Union (EU) for the end of 2019. This annual dataset comprises statistics on the number of branches and employees of EU credit institutions, data on the degree of concentration of the banking sector in each EU Member State, and data on foreign-controlled institutions in EU national banking markets.
As for the number of branches, the structural financial indicators show a further decline in the EU, on average by 6.3%. There was a decrease in 25 of 28 EU Member States and, at national level, the decrease in the number of branches varied from 0.9% to 37%. The total number of branches in the EU was 163,265 at the end of 2019 with 79 % of them located in the Euro Area.
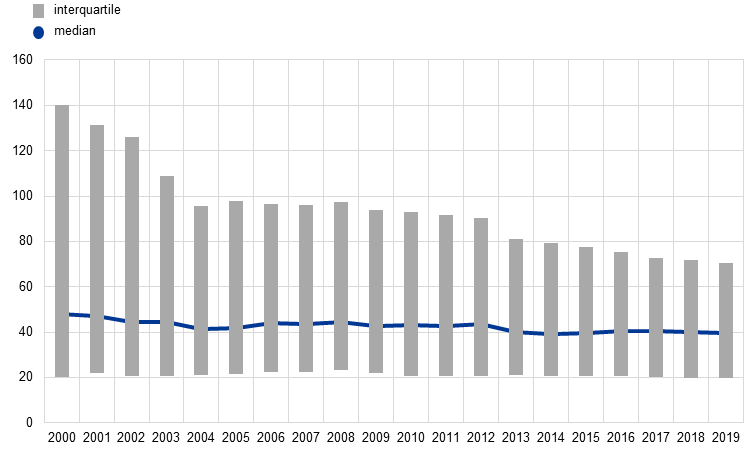
The number of employees of credit institutions fell in 20 EU Member States with an average reduction of 0.9% across all countries. Decreasing numbers of bank employees is a trend that has been observed in most countries since 2008.
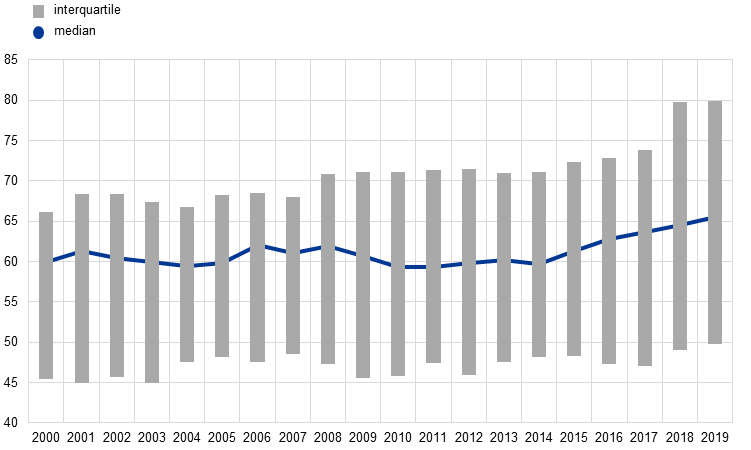
The data also indicate that the degree of concentration in the banking sector (measured by the share of assets held by the five largest banks) continues to differ widely between EU countries. The share of total assets of the five largest credit institutions, at national level, ranged from 28% to 97%, while the EU average was 65% at the end of 2019. The changes in the share of total assets of the five largest credit institutions varied across countries from -3.1% to 7.8%. In the EU, the average variation was 1.5%.
The structural financial indicators are published by the ECB on an annual basis.
Number of employees of domestic credit institutions
(thousands)

Notes: Interquartile ranges and medians are calculated across average country values. Data for EU28 countries are available.
Share of assets held by the five largest banks
(percentages)

Notes: Interquartile ranges and medians are calculated across average country values. Data for EU28 countries are available.
For media queries, please contact Philippe Rispal, tel.: +49 69 1344 5482.
Notes
- Tables containing further breakdowns of structural financial indicator statistics are available on the ECB’s website.
- These statistical data as well as EU and euro area aggregates are available in the ECB’s Statistical Data Warehouse.
Europos Centrinis Bankas
Komunikacijos generalinis direktoratas
- Sonnemannstrasse 20
- 60314 Frankfurtas prie Maino, Vokietija
- +49 69 1344 7455
- media@ecb.europa.eu
Leidžiama perspausdinti, jei nurodomas šaltinis.
Kontaktai žiniasklaidai-
8 June 2020


