Development of the euro area monetary financial institutions sector
On 1 January 2008 the total number of monetary financial institutions (MFIs) [1] in the euro area stood at 7,887, which is an increase of 241units (3.1%) in comparison with the number recorded one year ago. This increase was due entirely to the enlargement of the euro area through the accession of Cyprus and Malta, in which 244 MFIs are resident. More than 80% of the euro area MFIs are credit institutions and most of the remainder are money market funds. Since 1 January 1999 the number of MFIs in the euro area has decreased by 20%, despite the enlargement as a result of Greece, Slovenia, Cyprus and Malta joining the euro area. Germany and France account for 44% of all euro area MFIs.
Number of MFIs
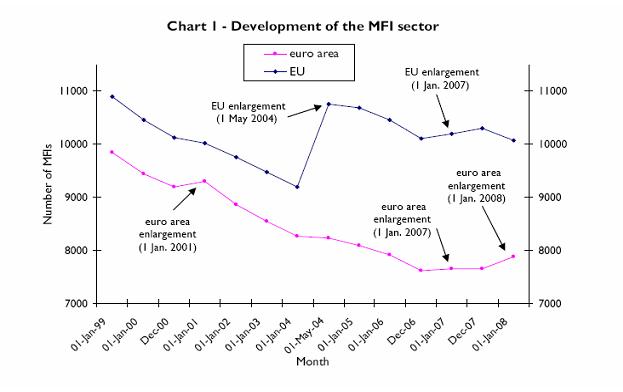
- On 1 January 2008 there were 7,887 MFIs resident in the euro area, compared with 7,646 MFIs on 1 January 2007. The net increase of 241 units (3.1 %) basically equals the number of MFIs in Cyprus (216) and Malta (28), which implies that the number of MFIs in the former euro area has remained virtually stable in 2007. Since the start of Stage Three of Economic and Monetary Union (EMU) on 1 January 1999, when there were 9,856 MFIs in the euro area, that number has decreased by 1,969 units (20.0%). This trend is clearly visible in Chart 1 below.
- On 1 January 2008 there were 10,068 MFIs resident in the European Union (EU), which implies a net decrease of 123 units (1.2%) since 1 January 2007. Compared with the situation on 1 January 1999 (10,909 MFIs in the EU), there has been a net decrease of 841 units (7.7%), despite the inclusion of 1,608 MFIs on 1 May 2004, when ten new Member States acceded, and the inclusion of 72 MFIs on 1 January 2007, when Bulgaria and Romania joined the EU.

Structure of MFIs
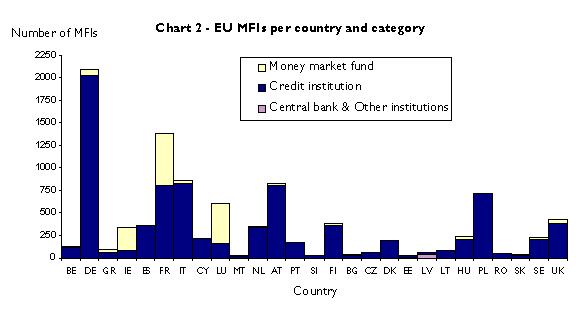
- On 1 January 2008 credit institutions accounted for 80.7% (6,364 units) of all euro area MFIs, while money market funds accounted for 19.1% (1,504 units). Central banks, including the ECB (16 units), and other institutions (3 units) together accounted for 0.2% of all euro area MFIs.
- In the EU as a whole, the shares of credit institutions and money market funds were 82.9% and 16.3%, respectively. Please see Chart 2 below.

Country breakdown
On 1 January 2008 two countries accounted for 44% (3,483) of all MFIs in the euro area: Germany (26.6%) and France (17.6%). Italy and Austria each accounted for about 10% of the euro area total. Over the last nine years (1999-2008), the following developments in the national MFI sectors of euro area countries have been particularly noteworthy: a considerable increase of 236 units (246%) in Ireland and large decreases in the Netherlands, Spain and Germany (by 48%, 41% and 36% respectively). Since joining the EU on 1 May 2004, the MFI sectors in Malta and Slovenia have increased significantly, namely by 65% and 11% respectively. By contrast, the number of MFIs in Cyprus has decreased by 47% during the same period. Please see Table 1 below.
Among the non-euro area countries, Poland has by far the largest number of MFIs (722), representing 7% of the MFI sector in the EU. Since 1999 there have been substantial increases in the MFI sectors of Slovakia (36%), Latvia (33%), Sweden (31%) and Romania (26%), while the size of these sectors in the United Kingdom and the Czech Republic has shrunk by 24% and 15%, respectively.
Foreign branches
- On 1 January 2008, 609 branches of foreign credit institutions were resident in the euro area. These accounted for 9.6% of all euro area credit institutions. The largest number of such branches were located in Germany (17%), while Belgium had the largest proportion of foreign branches in relation to the total number of credit institutions in the country (110 units), namely 53%. For the majority of foreign branches in euro area countries, the head office was located either in another euro area country (64%) or in the United Kingdom (14%).
- On 1 January 2008 there were 180 branches of foreign credit institutions resident in non-euro area EU countries. Of these, the largest percentage (43%) was located in the United Kingdom. Estonia had the largest proportion of foreign branches in relation to the total number of credit institutions in the country (9 units), namely 60%. The head offices of the majority of foreign branches in non-euro area EU countries were located either in euro area countries (66%) or in other non-euro area EU Member States (31%).
Table 1 - Number of MFIs per country and percentage changes in recent periods
| Number of MFIs | Percentage changes | |||||||
| Country | 1 Jan. 1999 | 1 Jan. 2001 | 01-May-04 | 1 Jan. 2007 | 1 Jan. 2008 | 1 Jan. 1999 to 1 Jan. 2008 | 1 May 2004 to 1 Jan. 2008 | 1 Jan 2007 to 1 Jan. 2008 |
| ECB | 1 | 1 | 1 | 1 | 1 | 0 | 0 | 0 |
| BE | 153 | 142 | 126 | 120 | 126 | -18 | 0 | 5 |
| DE | 3280 | 2782 | 2268 | 2106 | 2097 | -36 | -8 | 0 |
| GR | 102 | 105 | 100 | 93 | 91 | -11 | -9 | -2 |
| IE | 96 | 211 | 294 | 318 | 332 | 246 | 13 | 4 |
| ES | 608 | 571 | 512 | 366 | 358 | -41 | -30 | -2 |
| FR | 1938 | 1764 | 1577 | 1440 | 1386 | -28 | -12 | -4 |
| IT | 944 | 884 | 854 | 856 | 863 | -9 | 1 | 1 |
| CY | - | - | 409 | 337 | 216 | - | -47 | -36 |
| LU | 676 | 662 | 586 | 565 | 613 | -9 | 5 | 8 |
| MT | - | - | 17 | 23 | 28 | - | 65 | 22 |
| NL | 668 | 620 | 484 | 355 | 351 | -47 | -27 | -1 |
| AT | 910 | 866 | 827 | 822 | 822 | -10 | -1 | 0 |
| PT | 228 | 223 | 205 | 183 | 180 | -21 | -12 | -2 |
| SI | - | - | 27 | 30 | 30 | - | 11 | 0 |
| FI | 354 | 362 | 396 | 391 | 393 | 11 | -1 | 1 |
| BG | - | - | - | 33 | 33 | - | - | 0 |
| CZ | - | - | 79 | 66 | 67 | - | -15 | 2 |
| DK | 216 | 213 | 206 | 194 | 192 | -11 | -7 | -1 |
| EE | - | - | 25 | 26 | 29 | - | 16 | 12 |
| LV | - | - | 52 | 65 | 69 | - | 33 | 6 |
| LT | - | - | 74 | 80 | 83 | - | 12 | 4 |
| HU | - | - | 238 | 241 | 241 | - | 1 | 0 |
| PL | - | - | 659 | 729 | 722 | - | 10 | -1 |
| RO | - | - | - | 39 | 49 | - | - | 26 |
| SK | - | - | 28 | 34 | 38 | - | 36 | 12 |
| SE | 179 | 177 | 255 | 238 | 235 | 31 | -8 | -1 |
| UK | 556 | 541 | 457 | 440 | 423 | -24 | -7 | -4 |
| Euro area | 9856 | 9193 | 8230 | 7646 | 7887 | -20 | -4 | 3 |
| EU | 10909 | 10124 | 10756 | 10191 | 10068 | -8 | -6 | -1 |
The number of MFIs has been derived from the ECB’s “List of monetary financial institutions” which is updated daily on the ECB’s website and is compiled according to stringent requirements to ensure its completeness, accuracy and homogeneity across countries. Its objectives are twofold, namely (i) to serve as the reference reporting population for the compilation of comprehensive and consistent monetary statistics for the euro area and (ii) to serve as a register and a reliable sampling frame for other data collections and for statistical and economic analyses.
The “List of monetary financial institutions” and the “List of monetary financial institutions and institutions subject to minimum reserves” can be downloaded from the “Statistics” section of the ECB’s website, under “Money, banking and financial markets”/“List of Monetary Financial Institutions”/”MFI data access”
-
[1] MFIs are resident credit institutions (as defined in Community law) and other resident financial institutions whose business is to receive deposits and/or close substitutes for deposits from entities other than MFIs, and to grant credit and/or make investments in securities for their own account.
Den Europæiske Centralbank
Generaldirektoratet Kommunikation
- Sonnemannstrasse 20
- 60314 Frankfurt am Main, Tyskland
- +49 69 1344 7455
- media@ecb.europa.eu
Eftertryk tilladt med kildeangivelse.
Pressekontakt

