


- THE ECB BLOG
How tit-for-tat inflation can make everyone poorer
30 March 2023
High energy prices have dented real incomes. How to allocate these losses is at the heart of recent negotiations between firms and workers. If both sides try to unilaterally offset any real income losses, this could trigger successive wage and price increases, and create risks of an upward spiral that could make everyone poorer.
Inflation in the euro area has been high recently, mainly because of a surge in energy prices.[2] Since the euro area imports more than half of the energy it uses and energy has become much more expensive, households and firms have lost real income.[3] This has been made worse by supply chain problems which have also driven up import prices.[4] In such a situation, firms have an incentive to try to minimise their share of the burden by raising their prices in order to protect their profit margins.[5] Producers in some sectors might even try to increase their margins over and above what would be justified by higher input costs to also fully recoup previous real income losses from the various shocks of the past three years. Another motivation could be the attempt to build buffers in an environment of high uncertainty.
Likewise, workers want to minimise their share of the burden by adjusting their wage claims to recoup the real wage losses resulting from higher prices. While price adjustments of firms can happen relatively quickly, wage setting is usually staggered in euro area countries and often requires a long negotiation process.
Risk of an upward price spiral
Both effects are pushing up prices in the euro area. And the mutually reinforcing feedback between higher profit margins, higher nominal wages and higher prices risks strong second-round effects. This can cause an upward price spiral. And, ultimately, it might push long-term inflation expectations away from the anchor of the ECB’s 2% target. This “tit-for-tat” dynamic, as it was described by ECB President Lagarde in a recent speech, must be avoided to keep inflation at bay.[6]
So what does actually drive up inflation, profits or wages? The contribution of wages and profits to domestic price pressures in the euro area can be assessed based on the GDP deflator. This shows us the prices of the gross value added (including taxes less subsidies on products) produced in the euro area.[7] The GDP deflator can be broken down into unit profits (gross operating surplus per unit of real GDP), unit labour costs (compensation of employees per unit of real GDP) and unit taxes (which reflect taxes on production net of subsidies per unit of real GDP).[8]
Chart 1
GDP deflator income side
(annual percentage changes; p.p. contributions)
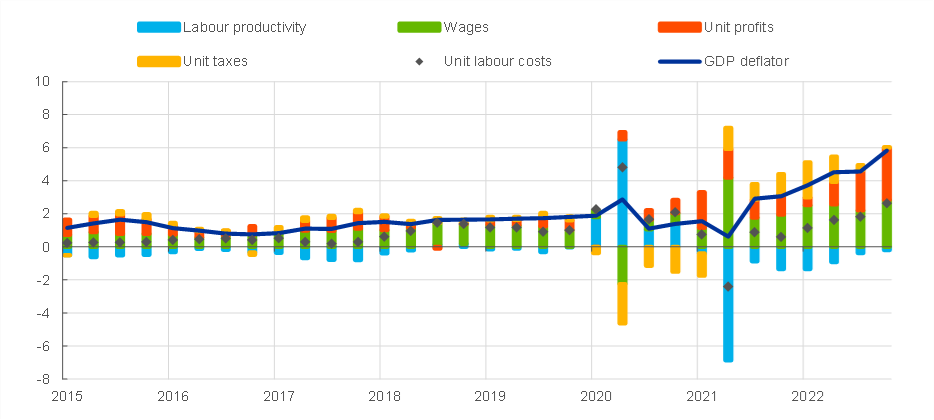
Sources: Eurostat and ECB staff calculations.
Latest observations: 2022 Q4.
Domestic price pressures have increased strongly since the second half of 2021 (Chart 1). In the fourth quarter of 2022, year-on-year growth of the GDP deflator picked up further, to 5.8%. This highlights workers’ and firms’ strong reactions to energy and input cost pressures and shows that the intention to offset real income losses became a driver for higher inflation. The latest increases in the GDP deflator have been driven by both unit labour costs and unit profits. Unit profits increased by 9.4% in the fourth quarter of 2022, year-on-year, and contributed more than half the domestic price pressures in that quarter, while unit labour costs increased by 4.7% and contributed less than half.
Usually unit profits are influenced by the economic cycle and the terms of trade.[9] Based on historic evidence one could have expected that the cyclical slowdown in economic activity and the still-worsening terms of trade should have dampened profits. But these factors appear to have been dominated by others recently and we are seeing rising profits.
Many companies are apparently able to expand their profit margins without facing significant losses of market shares. Why is that? The first reason is demand outpacing supply in many sectors: surging demand for certain goods and services after the pandemic met the widespread supply constraints of firms that are finding it difficult to get sufficient raw materials, intermediate goods, equipment and workers. High input prices (for example for energy) also made it easier for firms to increase their profit margins, because they make it harder to tell whether higher prices are caused by higher costs or higher margins. And since, as highlighted above, companies aim to recoup their real income losses whenever possible, the high inflation environment can provide a further opportunity to do so.
Chart 2
Sectoral wage and profit developments
(percentage changes over the indicated period)
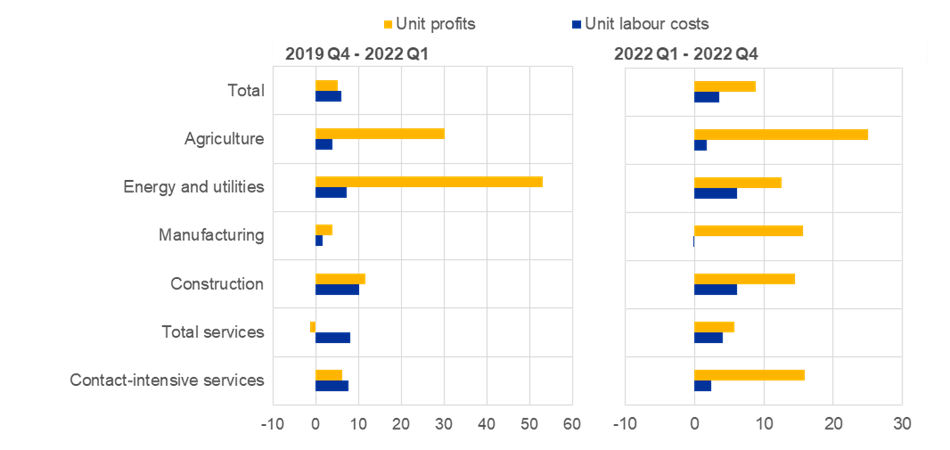
Sources: Eurostat and ECB staff calculations.
Notes: Unit profits correspond to gross operating surplus over real value added. Contact-intensive services include trade, transport, accommodation and food services as well as arts, entertainment, recreation and other services.
Latest observations: 2022 Q4.
A comparison of developments since the start of the pandemic (Chart 2) shows that in the euro area as a whole unit profits have increased faster than unit labour costs since the start of 2022, in some economic sectors already since the end of 2019. Zooming in on sectoral developments, we see that profits have grown much more than labour costs in:
- the agricultural sector, supported by rising food prices;
- energy and utilities (including electricity and gas), where some producers profited the most from higher energy prices;
- construction, where firms benefitted from the higher demand for housing after the pandemic;
- manufacturing, where input costs surged and restrained supply faced high demand;
- contact-intensive services sectors, where firms are still facing a strong and persistent rebound of demand in the face of limited supply since the reopening after the pandemic.
Chart 3
Contributions of unit profits and unit labour costs to domestic price pressures as reflected in the GDP deflator

Sources: Eurostat and ECB calculations.
Notes: Unit taxes reflect taxes minus subsidies. In case the contribution of subsidies on products is larger than the contribution of indirect taxes, the unit tax contribution turns negative. In the right panel of Chart 3 unit taxes are negative as their contribution to the GDP deflator was smaller in the two periods 2019 Q4-2022 Q1 and 2022 Q1-2022 Q4 than in the long-term average (1999 Q1-2019 Q4).
If we compare the relative contribution of unit profits and unit labour costs to domestic price pressures over a longer horizon (Chart 3) we see that, most recently, the effect of profits on domestic price pressures has been exceptional from a historical perspective. While, on average, from 1999 to 2022 unit profits contributed around one-third to the GDP deflator, over 2022 they contributed an average of two-thirds.
Domestic price pressures are a main driver of underlying inflation as measured, for instance, in terms of HICP inflation excluding energy and food. If the growth in the sum of profits and wages doesn’t slow, it will make the ECB’s goal of returning inflation to target in a timely manner harder. And that could require a stronger policy response. In their latest macroeconomic projections,[10] ECB staff foresee that both unit labour costs and profit margins will grow more moderately over the next three years. There are a number of factors behind this. First, the projections implicitly assume that wage claims trying to catch up to inflation should ease over time, as euro area inflation gradually declines thanks to lower energy and other commodities costs. Second, the ECB’s restrictive monetary policy stance is also dampening demand. Third, unit profits are expected to grow more moderately as the mismatches in demand and supply are resolved and inflation eases.
In a less-benign scenario, where wage and price setters try to offset any real income losses, we would face the risk of successive wage and price adjustments ultimately leading to a wage-price spiral with lasting effects on inflation. The resulting aggregate real income loss would likely be deeper and more persistent. From a monetary policy perspective, it is therefore essential that such a risk scenario be avoided.
The ECB is closely monitoring developments in underlying inflationary pressures that stem from both profits and wages. These are important elements in our comprehensive analysis of underlying inflation developments[11] and our data-based approach to policy rate decisions. And these monetary policy decisions will ensure rates that dampen demand, keep inflation expectations anchored and, over time, reduce inflation and ensure that it returns to the 2% medium-term target in a timely manner.
The views expressed in each blog entry are those of the author(s) and do not necessarily represent the views of the European Central Bank and the Eurosystem.
We would like to thank Eduardo Gonçalves and Sara Romaniega Sancho for their support in preparing this blog post.
See also Arce, O, Koester, G. and C. Nickel: “One year since Russia’s invasion of Ukraine – the effects on euro area inflation” – The ECB Blog 24 February 2023.
See Gunnella, V. and Schuler, T. (2022), “Implications of the terms-of-trade deterioration for real income and the current account”, Economic Bulletin, Box 1, Issue 3 and Lane, P.R. (2022), “Inflation diagnostics”, The ECB Blog, 25 November 2022.
See Arce, O., Koester, G. and Pierluigi, B. (2022), “Challenges for global monetary policy in an environment of high inflation: the case of the euro area”, ICE: Revista De Economía, No 929, pp. 115-130.
This blog takes a macroeconomic perspective and relies on national accounts data. The gross domestic product (GDP) reflects the gross value added including taxes less subsidies on products (gross output minus intermediate consumption) that can be decomposed – on the income side – into compensation of employees, profits (or gross operating surplus) and taxes less subsidies on production.
“The path ahead” Speech by Christine Lagarde, President of the ECB, at “The ECB and Its Watchers XXIII” conferenceFrankfurt am Main, 22 March 2023.
See “Using national accounts data to gauge price pressures in the euro area”, Monthly Bulletin box, December 2006.
Based on the GDP deflator, unit profits, unit labour costs and unit taxes are expressed per unit of real GDP (which is calculated by subtracting intermediate consumption from gross output).
See Hahn, E., (2019), “How do profits shape domestic price pressures in the euro area?”, Economic Bulletin box, Issue 6, European Central Bank and Hahn, E., (2021), “The role of profit margins in the adjustment to the COVID-19 shock”, Economic Bulletin box, Issue 2, European Central Bank.
See ECB staff macroeconomic projections for the euro area, March 2023.
See also Lane, Philip R (2023): "Underlying inflation", Lecture, Trinity College Dublin, 6 March 2023.