
The ECB Survey of Professional Forecasters - Second quarter of 2023
Summary
In the ECB Survey of Professional Forecasters (SPF) for the second quarter of 2023, expectations for headline HICP inflation in 2023 were revised down compared with the previous survey (conducted in the first quarter), while expectations for HICP inflation excluding food and energy (HICPX) in 2023 were revised up.[1] The downward revision of headline inflation expectations primarily reflects lower expected energy price inflation (particularly for natural gas), while the upward revision for HICP inflation excluding food and energy primarily reflects recent data outturns, as well as higher wage growth forecasts. Headline inflation was expected to decline from 5.6% in 2023 to 2.6% in 2024 and 2.2% in 2025. Longer-term inflation expectations (which relate to 2027) were unchanged at 2.1%. GDP growth expectations were revised up for 2023, but down for 2024 and 2025. The upward revision for 2023 largely reflects a carry-over from stronger than expected growth in the fourth quarter of 2022, while the downward revisions for 2024 and 2025 mainly reflect recent financial market stresses and tighter financial conditions. Longer-term GDP growth expectations remained unchanged at 1.4%. The profile for the expected unemployment rate has been revised downward by 0.1-0.2 percentage points for the period 2023-25, but upward slightly for 2027. The unemployment rate is expected to increase to 6.8% in 2023 (having stood at 6.6% in February 2023) and remain at that level in 2024, before declining gradually to stand at 6.5% in 2027.
Table 1
Results of the SPF in comparison with other expectations and projections
(annual percentage changes, unless otherwise indicated)
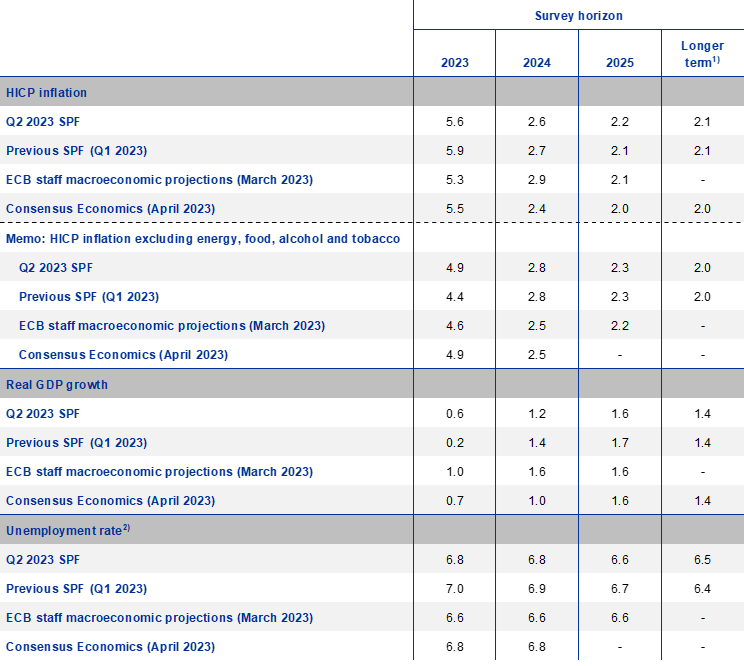
1) Longer-term expectations refer to 2027.
2) As a percentage of the labour force.
1 HICP inflation expectations revised down for 2023
SPF respondents revised their inflation expectations for 2023 downward. These now stand at 5.6%, 0.3 percentage points lower than in the previous survey round. There were counterbalancing revisions of 0.1 percentage points for 2024 (downward to 2.6%) and 2025 (upward to 2.2%) (see Chart 1). Compared with the March 2023 ECB staff macroeconomic projections, which were based on February 2023 HICP data as the latest available information, inflation expectations in this SPF round were 0.3 percentage points higher for 2023, 0.3 percentage points lower for 2024 and 0.1 percentage points higher for 2025 (see Table 1).
Chart 1
Inflation expectations: overall HICP inflation and HICP inflation excluding energy, food, alcohol and tobacco
(annual percentage changes)
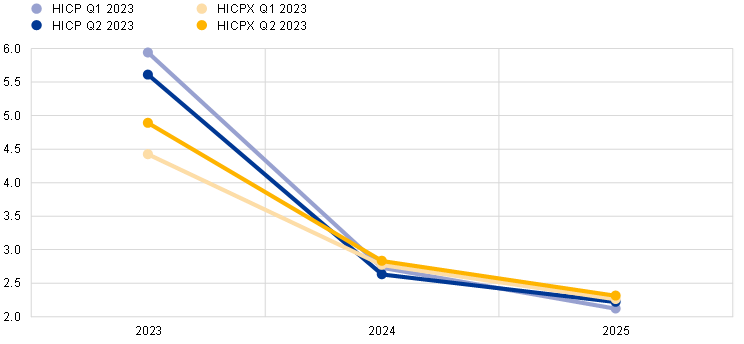
Revisions to expected energy price inflation were the main factor behind the downward revision of overall inflation forecasts for 2023. Taken together, the information on HICP and HICPX expectations suggests that SPF respondents have revised downward significantly their expectations for HICP energy and food price inflation in 2023 (and, to a lesser extent, 2024).
With regard to underlying inflationary pressures, respondents considered that profit margins had played a larger role until recently, but expected that wages would exert greater influence looking ahead. Profit margins – particularly in the energy and food sectors, but also in some other manufacturing sectors (owing to supply bottlenecks and supply/demand imbalances) – were seen to have played a role in strengthening inflation dynamics. Looking ahead, respondents considered that the combination of higher wages, a more modest growth environment and increased financing costs would attenuate and possibly compress margins. While wage rises had been moderate so far, participants saw signs of more dynamic increases. However, while they considered that these would imply an only gradual decline in underlying inflation, they did not expect a wage-price spiral.
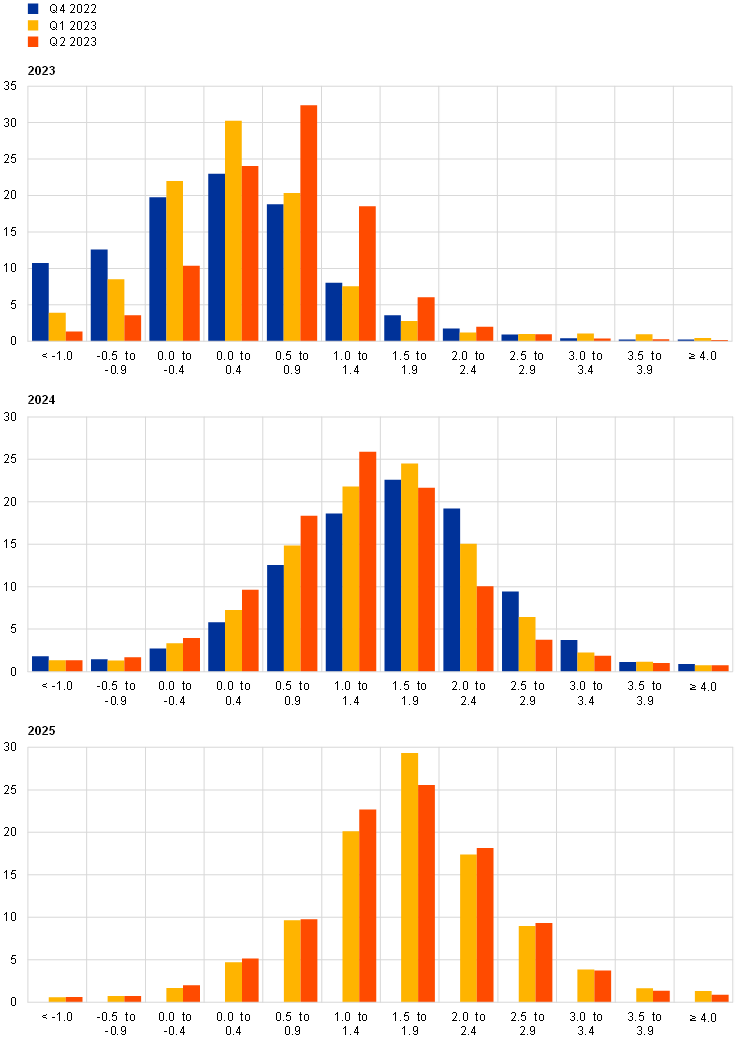
Despite easing slightly further, quantitative indicators of the uncertainty surrounding the shorter and medium-term inflation outlook remained close to their historical highs.[2] The high level of “aggregate uncertainty” stems from a combination of unprecedented “disagreement” across forecasters about their point forecasts, as well as a high average level of “individual uncertainty”. Disagreement regarding inflation expectations two years ahead (measured by the standard deviation of point expectations) stood at 1.1 percentage points. This was up from 0.9 percentage points in the previous round and around four times the historical average since 1999. Aggregate probability distributions for the calendar years from 2023 to 2025 are presented in Chart 2. The quantitative balance of risk indicator (calculated as the estimated mean of the aggregate probability distribution minus the average reported point expectation) for the two-year-ahead horizon rebounded sharply, standing on the upside. The weight associated with outcomes in the open-ended interval (i.e. inflation of 5% or higher) increased to 4.2%, up from 2.9% in the previous round. In their qualitative remarks, respondents noted that the main risks related to energy prices, as well as possible wage developments. For energy prices, both downside and upside risks were mentioned. Wage developments were generally considered an upside risk.
SPF expectations for inflation excluding energy, food, alcohol and tobacco were revised up for 2023, but unchanged thereafter. HICPX expectations for 2023, 2024 and 2025 stood at 4.9%, 2.8% and 2.3% respectively – representing an upward revision of 0.5 percentage points for 2023, but no change for 2024 or 2025. Respondents indicated that the upward revisions reflected recent data outturns, as well as higher wage growth forecasts. As regards labour costs, respondents cited the mix of elevated inflation and labour market tightness as the main influencing factors. The SPF forecasts for HICPX were higher than those in the March 2023 ECB staff macroeconomic projections – 0.3 percentage points higher for 2023 and 2024, and 0.1 percentage points higher for 2025 (see Table 1).
Chart 2
Aggregate probability distributions for expected inflation in 2023, 2024 and 2025
(x-axis: HICP inflation expectations, annual percentage changes; y-axis: probability, percentages)
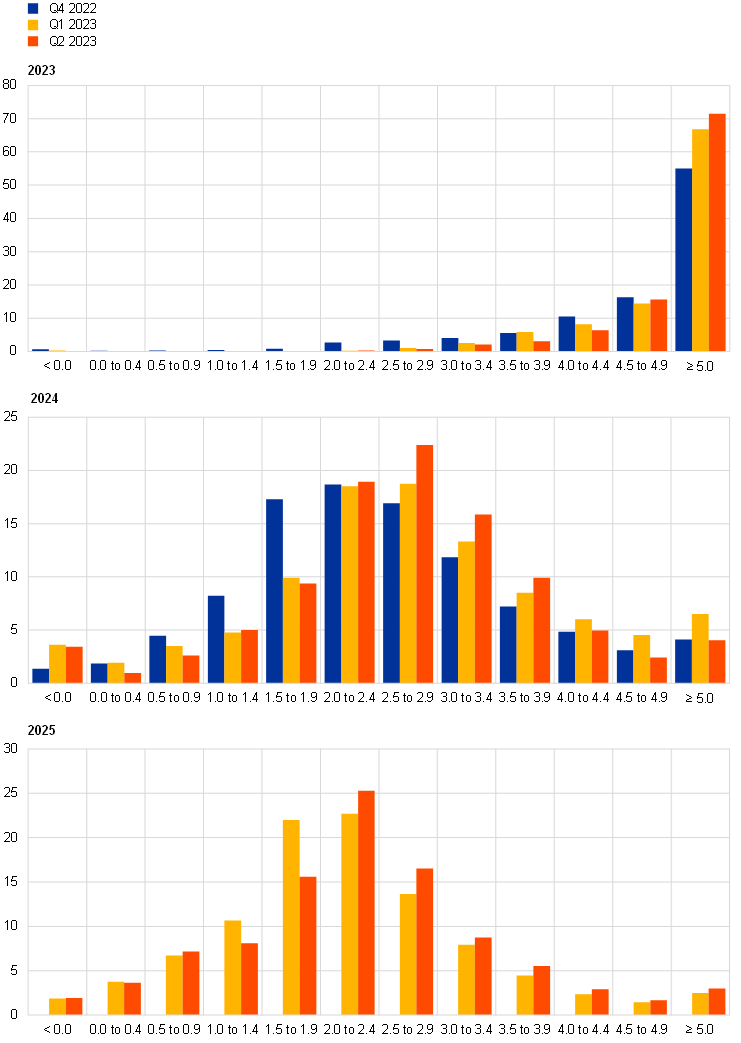
Notes: The SPF asks respondents to report their point forecasts and to separately assign probabilities to different ranges of outcomes. This chart shows the average probabilities assigned to different ranges of inflation outcomes in 2023, 2024 and 2025. To minimise the number of bins in the questionnaire, the upper bin for inflation outcomes was set at ≥ 5.0%. The fact that this would lead to most probability being assigned to the upper bin for some horizons was flagged to respondents when sending out the questionnaire.
2 Longer-term inflation expectations unchanged
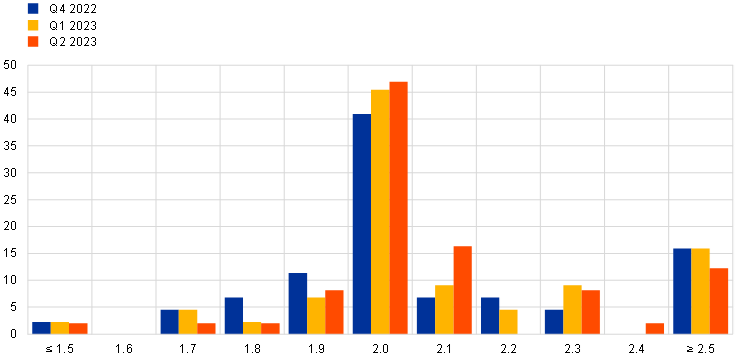
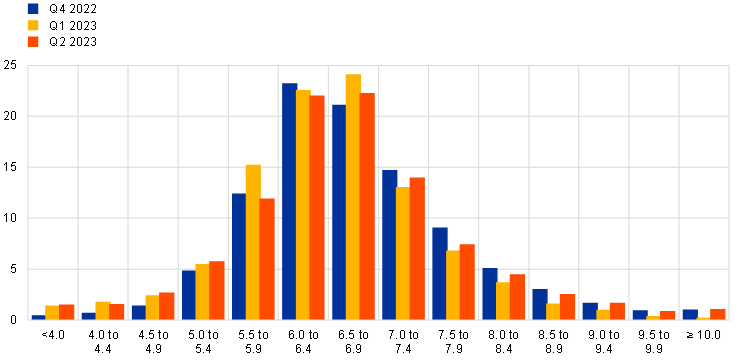
Longer-term inflation expectations (which relate to 2027) were unchanged at 2.1%. When excluding (trimming) the two highest and lowest responses, the average was stable at 2.1% for the fourth consecutive survey round. The median point expectation was unchanged at 2.0%, while the estimated mean of the aggregate probability distribution was unchanged at 2.1% (see Chart 3). Thus, having increased noticeably since the third quarter of 2021, there are growing signs that longer-term inflation expectations have levelled off. Looking at a balanced panel of 40 respondents who participated in both the first and second quarters of 2023, six of those respondents revised their longer-term inflation expectations upward, nine revised them downward and 25 made no changes. The distribution of individual point forecasts was broadly unchanged in this round (see Chart 4). As in the two most recent rounds, the clear modal (i.e. most frequent) reply was 2.0% (47% of respondents), although there were again a number of respondents who reported longer-term inflation expectations at or above 2.5%. Compared with the distributions which prevailed over the period from the second quarter of 2014 to the fourth quarter of 2018 and the period from the first quarter of 2019 to the third quarter of 2021, the distribution of longer-term inflation expectations has become much more focused on 2.0%, and expectations of inflation lower than 2.0% have declined significantly.
Chart 3
Longer-term inflation expectations
(annual percentage changes)
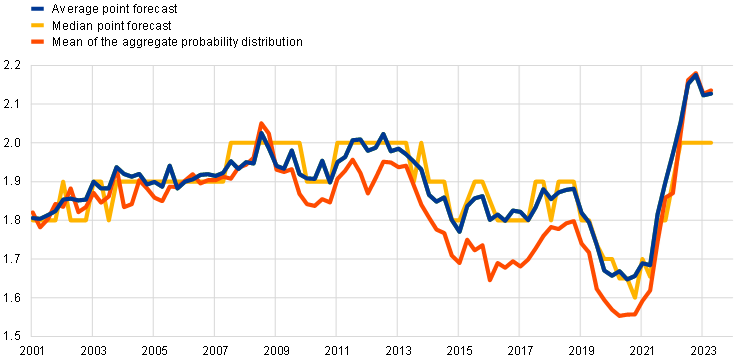
Chart 4
Distribution of point expectations for HICP inflation in the longer term
(x-axis: longer-term HICP inflation expectations, annual percentage changes; y-axis: percentages of respondents)
Notes: The SPF asks respondents to report their point forecasts and to separately assign probabilities to different ranges of outcomes. This chart shows the spread of point forecast responses. Longer-term expectations refer to 2027.
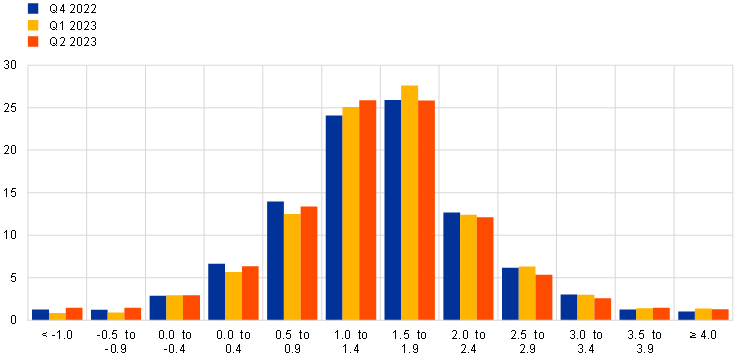
Uncertainty surrounding longer-term inflation expectations increased, thus remaining elevated, while the balance of risks remained broadly neutral. The increase in “aggregate uncertainty” (the standard deviation of the aggregate probability distribution – see Chart 5) stemmed from a combination of greater “disagreement” and higher “individual uncertainty” (as measured by the average width of the individual probability distributions). The balance of risk indicator remained close to zero (i.e. neutral). The aggregate probability associated with longer-term inflation being in the range 1.5-2.5% was 49%, broadly unchanged from the previous round, and the same was true of the probabilities associated with outcomes above this range (i.e. >2.5%) and below this range (i.e. <1.5%), which stood at 32% and 20% respectively.
Chart 5
Aggregate probability distribution for longer-term inflation expectations
(x-axis: HICP inflation expectations, annual percentage changes; y-axis: probability, percentages)

Notes: The SPF asks respondents to report their point forecasts and to separately assign probabilities to different ranges of outcomes. This chart shows the average probabilities assigned to different ranges of inflation outcomes in the longer term. Longer-term expectations refer to 2027.
The mean longer-term expectation for HICP inflation excluding energy, food, alcohol and tobacco was unchanged at 2.0%. The median and modal longer-term point expectations for HICPX were also unchanged at 2.0%. All in all, 39% of respondents reported forecasts of 2.0% (unchanged from the previous survey round), 33% reported forecasts of 1.9% or lower (down from 39%), and 28% reported forecasts of 2.1% or higher (up from 21%). Of the 28 respondents who provided longer-term HICPX forecasts in both the first and second quarters of 2023, 19 made no changes to their forecasts in the second quarter, six revised them upward and three revised them downward. The evolution of longer-term expectations for HICP and HICPX inflation has been broadly similar across the period of available data since the fourth quarter of 2016 (when respondents were first asked about their expectations regarding HICPX), with a level difference of around 0.1 percentage points on average.
3 Real GDP growth expectations revised upward for 2023 and downward slightly for subsequent years
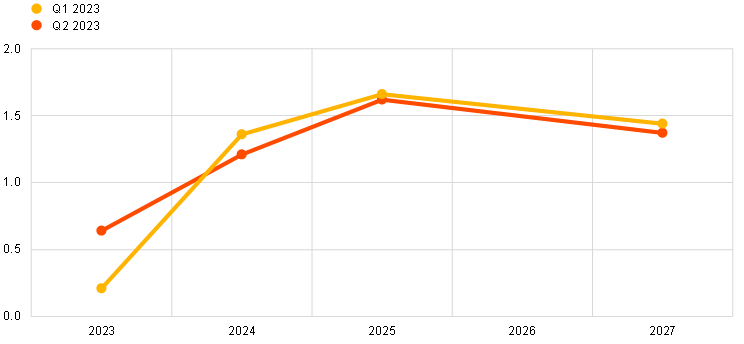
GDP growth expectations in the second quarter of 2023 stood at 0.6% for 2023, 1.2% for 2024 and 1.6% for 2025 (see Chart 6). When compared with the previous survey round, these figures imply an upward revision of 0.4 percentage points for 2023, but downward revisions of 0.2 and 0.1 percentage points for 2024 and 2025 respectively. The upward revision for 2023 reflects the carry-over implied by stronger than expected outcomes for the second half of 2022, as well as more positive indicators for the first quarter of 2023. Quarter-on-quarter growth in the first quarter of 2023 is now expected to be zero, rather than being negative, while the forecast for the second quarter of 2023 remains unchanged at 0.1%. A solid performance in overcoming the energy crisis and the fact that fiscal policy remains a stabilising factor for the euro area were both cited as reasons for the more benign outlook for 2023. However, while confidence increased as regards the short-term outlook, growth expectations for the medium term became more cautious: while respondents no longer expected energy-related downside risks over the SPF horizon, the downward revisions of 0.2 and 0.1 percentage points for 2024 and 2025 respectively reflected growing concerns that higher and more persistent inflation would force the ECB to further tighten monetary conditions, leading to tighter financial market conditions and lower domestic demand. Additionally, financial stress in the banking sector has the potential to impede growth, with some forecasters highlighting recent events as factors adding to the pressure on already tightened credit conditions. As regards the international outlook, the increased probability of the United States falling into a mild recession by the end of 2023 was seen as a possible headwind for euro area activity. As in previous rounds, supply chains were expected to remain at normal levels, while in contrast to the last few rounds, forecasters no longer reported additional downside risks related to the aftermath of the COVID-19 pandemic or the war in Ukraine. Longer-term growth expectations (which refer to 2027) remained unchanged at 1.4%.
Chart 6
Expectations for real GDP growth
(annual percentage changes)
The profile of the short-term outlook for GDP implies a modest, but constant, increase in economic growth throughout 2023.[3] The actual quarter-on-quarter change in real GDP in the fourth quarter of 2022 was slightly better than the forecast of -0.2% in the previous SPF round. In this round, forecasters expected zero quarter-on-quarter growth in the first quarter of 2023, with some recovery in the second quarter of 2023. Overall, they expected economic activity to expand slightly between the first and fourth quarters of 2023, with growth averaging around 0.2% (see Chart 7). Compared with the last survey round, the percentage of forecasters that expected at least one quarter of negative growth fell from over 85% to 35%, while only 11% forecasted a “technical recession” (i.e. two consecutive quarters of negative growth) over this period (down from 85% in the last round). Compared with the March 2023 ECB staff macroeconomic projection exercise, the SPF forecasts for 2023 are more conservative, with their quarterly growth rates standing 0.1 percentage points lower on average across all four quarters.
Chart 7
Expected profile of quarter-on-quarter GDP growth
(quarter-on-quarter percentage changes)
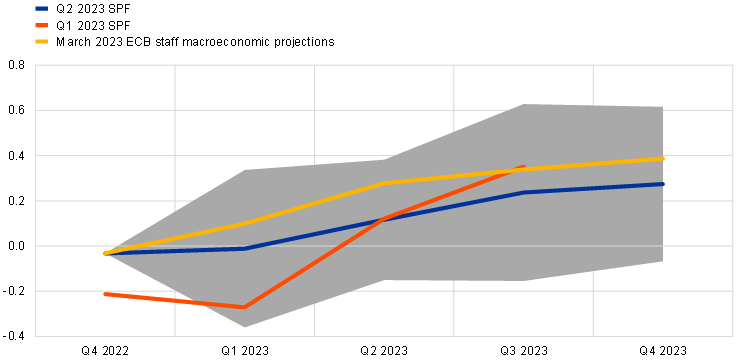
Note: Grey area indicates 1 standard deviation (of individual expectations) around average SPF expectations.
The profile for the level of economic activity implied by the expected growth rates is slightly higher than in the previous round. However, it remains substantially lower (2.6% lower in 2026) than the profile expected prior to the invasion of Ukraine (see Chart 8). Before the invasion, GDP was expected to surpass the profile expected pre-pandemic in the course of 2023. Expected GDP levels in 2024 and 2025 are also slightly lower (by 0.4%) than those implied by the March 2023 ECB staff macroeconomic projection exercise. Respondents consider the output gap to be less negative than previously assessed and expect the negative output gap to close only gradually over the SPF horizon.
Chart 8
(index; 2019 = 100)
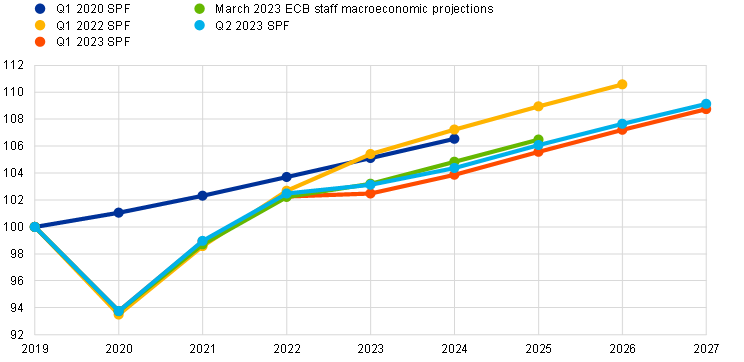
Note: Growth expectations for years not surveyed have been interpolated linearly.
Quantitative measures of uncertainty surrounding the growth outlook increased slightly in this round, while the balance of risks improved at the two-year horizon, standing on the upside (see Chart 9 and Chart 10). Aggregate uncertainty increased marginally at the two-year and longer-term horizons, remaining above the levels which prevailed prior to the COVID-19 pandemic, but was still considerably lower than at its peak in the second and third quarters of 2020. The balance of risks improved substantially for the two-year horizon, moving above zero. For the longer-term horizon, it remained positive and was largely unchanged compared with the previous round.
Chart 9
Aggregate probability distributions for GDP growth expectations for 2023, 2024 and 2025
(x-axis: real GDP growth expectations, annual percentage changes; y-axis: probability, percentages)
Notes: The SPF asks respondents to report their point forecasts and to separately assign probabilities to different ranges of outcomes. This chart shows the average probabilities assigned to different ranges of real GDP growth outcomes in 2023, 2024 and 2025.
Chart 10
Aggregate probability distributions for longer-term GDP growth expectations
(x-axis: real GDP growth expectations, annual percentage changes; y-axis: probability, percentages)
Notes: The SPF asks respondents to report their point forecasts and to separately assign probabilities to different ranges of outcomes. This chart shows the average probabilities assigned to different ranges of real GDP growth outcomes in the longer term. Longer-term expectations refer to 2027.
4 Unemployment rate expectations revised down for 2023-25
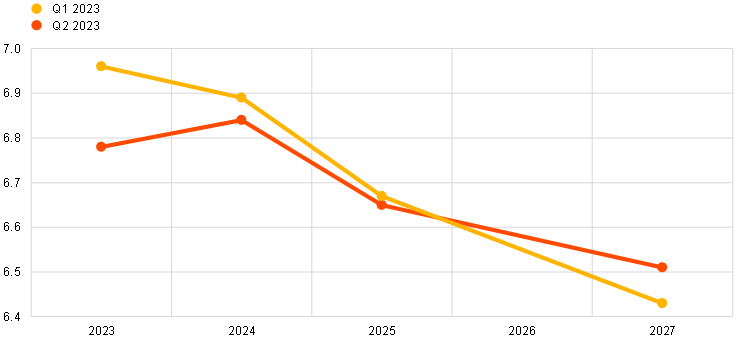
In the second quarter of 2023, respondents expected unemployment rates of 6.8%, 6.8% and 6.6% for 2023, 2024 and 2025 respectively. These had been revised downward by 0.2, 0.1 and 0.1 percentage points respectively since the previous round. The expectation for longer-term unemployment (2027) was 6.5%, which represented an upward revision of 0.1 percentage points but was still close to the historical low of 6.4%. After standing at a higher level in 2023 and 2024, the unemployment rate is expected to follow a downward-sloping trajectory, albeit that expected trajectory is now flatter than was observed in the previous round (see Chart 11). Respondents reported that unexpectedly resilient labour market outturns were the main factor underlying their downward revisions. Weaker than expected economic growth and dynamic wage developments were the main upside risks mentioned. By contrast, demographic factors and labour shortages in certain sectors were frequently mentioned as downside risks.
Chart 11
Expectations for the unemployment rate
(percentages of the labour force)
Uncertainty around shorter-term unemployment rate expectations decreased slightly, but remained at relatively elevated levels, and the balance of risks was slightly positive for all horizons. On balance, the aggregate probability distributions exhibited somewhat positive skewness (see Chart 12 and Chart 13). The balance of risk indicator for longer-term expectations was also positive, as the mean of the aggregate probability distribution (6.6%) was slightly above the average point forecast (6.5%).
Chart 12
Aggregate probability distributions for the unemployment rate in 2023, 2024 and 2025
(x-axis: unemployment rate expectations, percentages of the labour force; y-axis: probability, percentages)
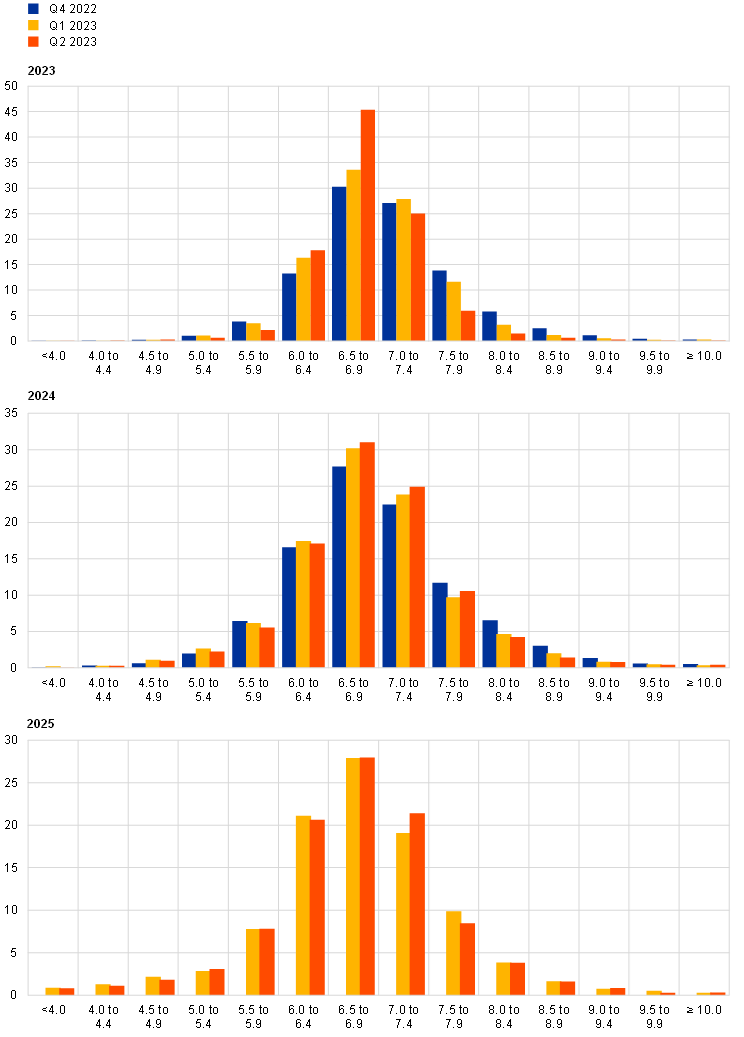
Notes: The SPF asks respondents to report their point forecasts and to separately assign probabilities to different ranges of outcomes. This chart shows the average probabilities assigned to different ranges of unemployment rate outcomes for 2023, 2024 and 2025.
Chart 13
Aggregate probability distribution for the unemployment rate in the longer term
(x-axis: unemployment rate expectations, percentages of the labour force; y-axis: probability, percentages)
Notes: The SPF asks respondents to report their point forecasts and to separately assign probabilities to different ranges of outcomes. This chart shows the average probabilities assigned to different ranges of unemployment rate outcomes in the longer term. Longer-term expectations refer to 2027.
5 Expectations for other variables
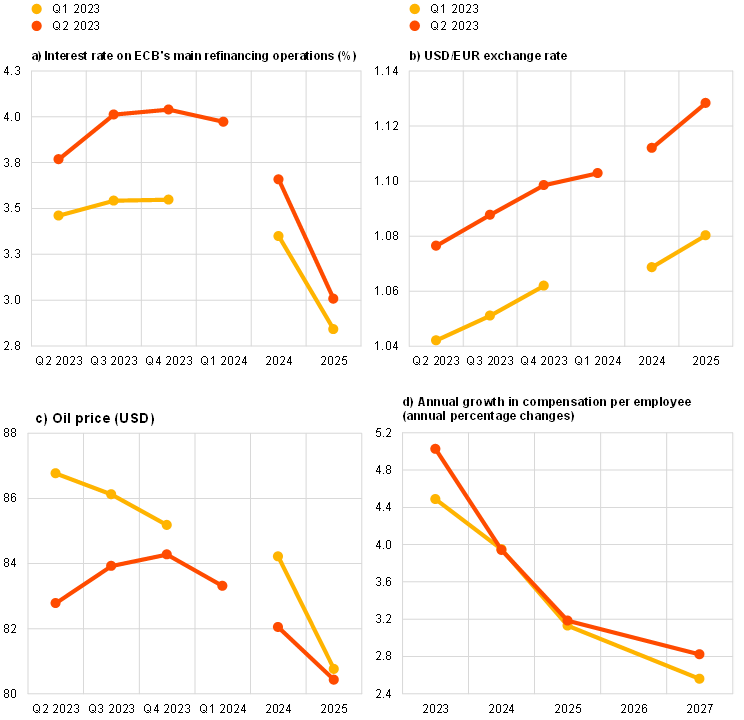
Forecasters expected the rate on the ECB’s main refinancing operations (MROs) to increase to 3.75% in the second quarter of 2023 and stand at 4.0% in the third and fourth quarters of 2023, before easing in 2024 and 2025, falling to 3.0%. They expected the euro to appreciate marginally against the US dollar, with the USD/EUR exchange rate rising from 1.08 in the second quarter of 2023 to 1.13 in 2025. They expected oil prices to remain between USD 80 and USD 85 per barrel. And they expected nominal wages to increase by 5.0% in 2023, 3.9% in 2024, 3.2% in 2025 and 2.8% in the longer term.
Respondents expected the ECB’s MRO interest rate to increase to 3.75% in the second quarter of 2023, before rising further to stand at 4.0% in the third quarter. They expected it to remain around this level for the remainder of 2023, before declining slightly in 2024 and falling to 3.0% in 2025 (see Chart 14a). The peak expectation was 4.04% (previously 3.55%) for the fourth quarter of 2023. Although the modal peak expectation was 4.0% (31% of respondents), around one-third of respondents expected peak MRO interest rates of more than 4.0%. Compared with the previous round, the profile was revised up by about 0.5 percentage points.
The expected average USD/EUR exchange rate was revised up over all horizons, being expected to stand between 1.08 and 1.10 in 2023, before increasing further to stand at 1.13 by 2025 (see Chart 14b).
Compared with the previous round, expected US dollar-denominated oil prices were revised downward slightly on average. Respondents envisaged a relatively flat trajectory with prices ranging between USD 80 and USD 85 per barrel up to 2025 (see Chart 14c).
Expectations for annual growth in compensation per employee were revised up by 0.5 percentage points for 2023, but remained unchanged for 2024 and 2025 (see Chart 14d). This accentuated the expected downward-sloping trajectory over the SPF horizon. Respondents expected annual growth rates of 5.0%, 3.9% and 3.2% for 2023, 2024 and 2025 respectively, with annual growth of 2.8% expected for the longer-term horizon (up from 2.6% in the previous round).
Chart 14
Expectations for other variables
Annex (chart data)
Excel data for all charts can be downloaded here.
© European Central Bank, 2023
Postal address 60640 Frankfurt am Main, Germany
Telephone +49 69 1344 0
Website www.ecb.europa.eu
All rights reserved. Reproduction for educational and non-commercial purposes is permitted provided that the source is acknowledged.
For specific terminology please refer to the ECB glossary (available in English only).
PDF ISBN 978-92-899-5806-6, ISSN 2363-3670, doi:10.2866/411417, QB-BR-23-002-EN-N
HTML ISBN 978-92-899-5807-3, ISSN 2363-3670, doi:10.2866/570143, QB-BR-23-002-EN-Q
The survey was conducted between 31 March and 5 April 2023, with 58 responses received. This is in line with the historical average for the response rate. Participants were provided with a common set of the latest available data for annual HICP inflation (March 2023 flash estimates: overall inflation, 6.9%; underlying inflation, 5.7%), annual GDP growth (fourth quarter of 2022, 1.8%) and unemployment (February 2023, 6.6%). This report was drafted on the basis of data available on 14 April 2023.
The width of the reported probability distributions indicates the perceived degree of overall uncertainty, whereas the asymmetry of the distributions indicates whether that uncertainty is more concentrated on higher or lower outturns – i.e. it measures the perceived balance of risks. As regards uncertainty, it can be shown that the width (or standard deviation) of the aggregate probability distribution (i.e. “aggregate uncertainty”) is a function of the average width (or standard deviations) of the individual probability distributions (i.e. “individual uncertainty”) and the standard deviations of the individual point forecasts (i.e. “disagreement”).
Based on data for 46 respondents.
-
5 May 2023