
The ECB Survey of Professional Forecasters - Second quarter of 2022
HICP inflation expectations were revised up by 3.0 percentage points for 2022 and 0.6 percentage points for 2023 but unchanged for 2024, standing at 6.0%, 2.4% and 1.9% for 2022, 2023 and 2024 respectively.[1] The upward revision for 2022 mainly reflects higher expected energy and food price inflation. Longer-term inflation expectations (for 2026) were revised upward by another 0.1 percentage point to stand on average at 2.1%. Expectations for inflation excluding energy, food, alcohol and tobacco (HICPX) were also revised up, particularly for 2022 and 2023. According to respondents, these revisions mainly reflect indirect effects from higher energy and food prices and effects from supply chain disruptions. GDP growth expectations were revised down for 2022 and 2023 and slightly up for 2024, to stand at 2.9%, 2.3% and 1.8% respectively and thus clearly above the longer-term growth expectations of 1.4% which were revised down marginally. At the same time, the profile of the expected unemployment rate has been revised down for all horizons by between 0.1 and 0.3 percentage points with 6.6% in 2026 being the lowest expected rate since 2007. Overall, respondents indicated that the war in Ukraine and its effects were the primary factors behind the revisions to their inflation and growth forecasts in 2022 and 2023. Indicators of the uncertainty surrounding expectations for the main macroeconomic variables remained elevated, with respondents indicating that the war in Ukraine was a new factor which overshadowed a more benign pandemic situation.
Table 1
Results of the SPF in comparison with other expectations and projections
(annual percentage changes, unless otherwise indicated)
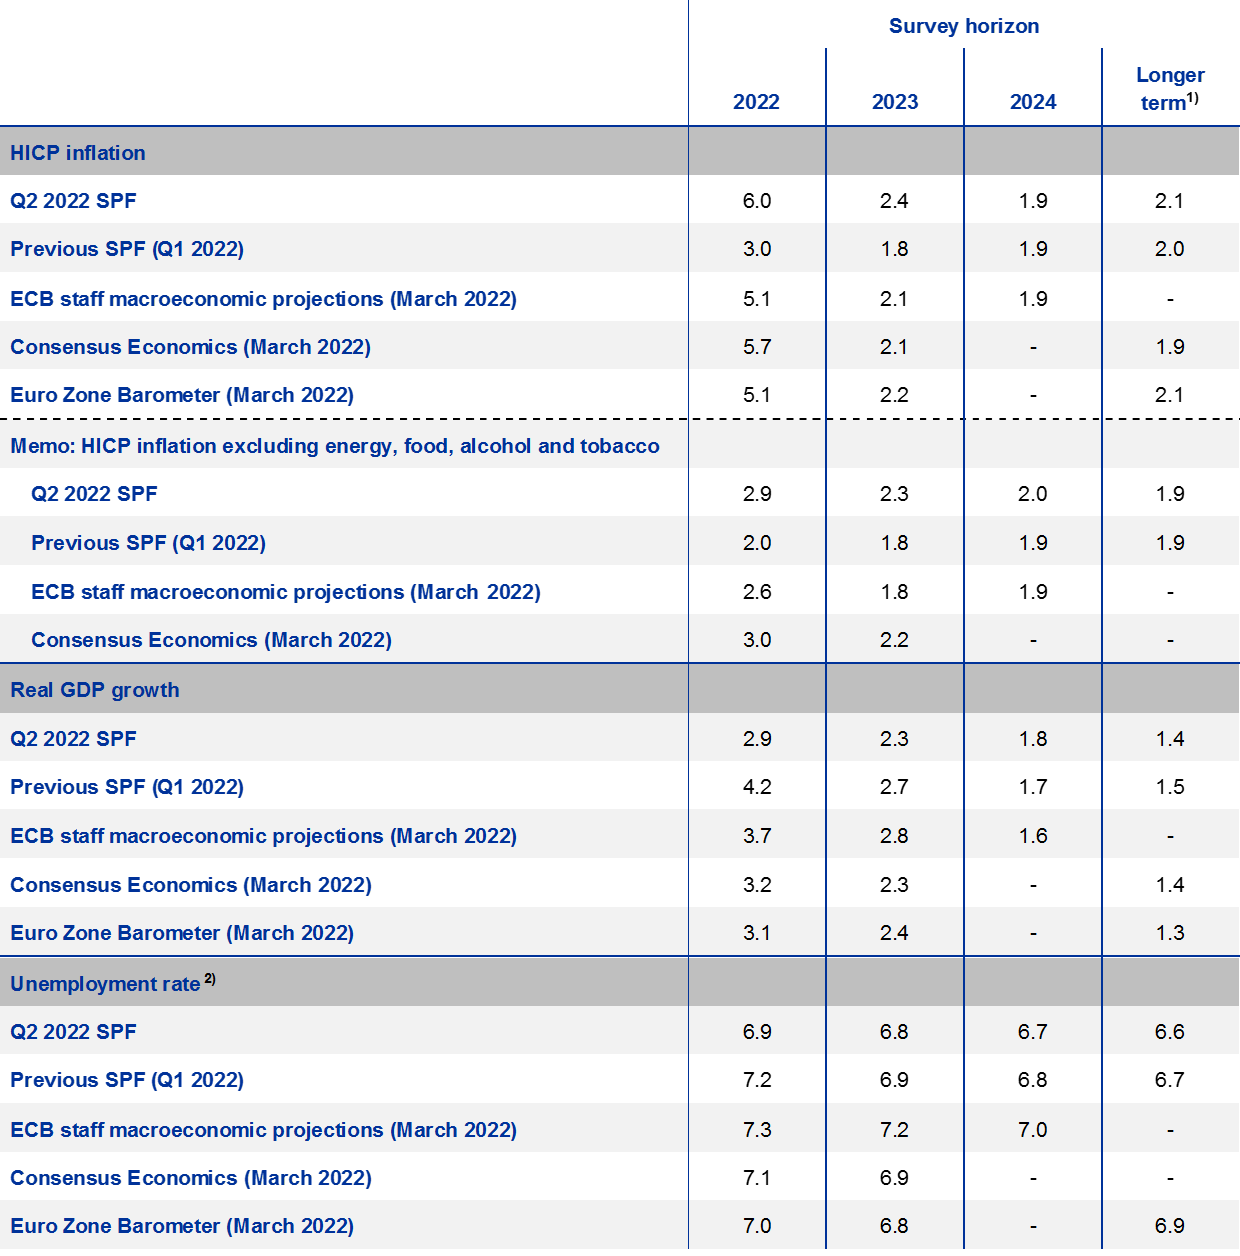
1) Longer-term expectations refer to 2026. Longer-term expectations from Consensus Economics and the Euro Zone Barometer are from the January 2022 surveys.
2) As a percentage of the labour force.
1 HICP inflation expectations revised up for 2022 and 2023
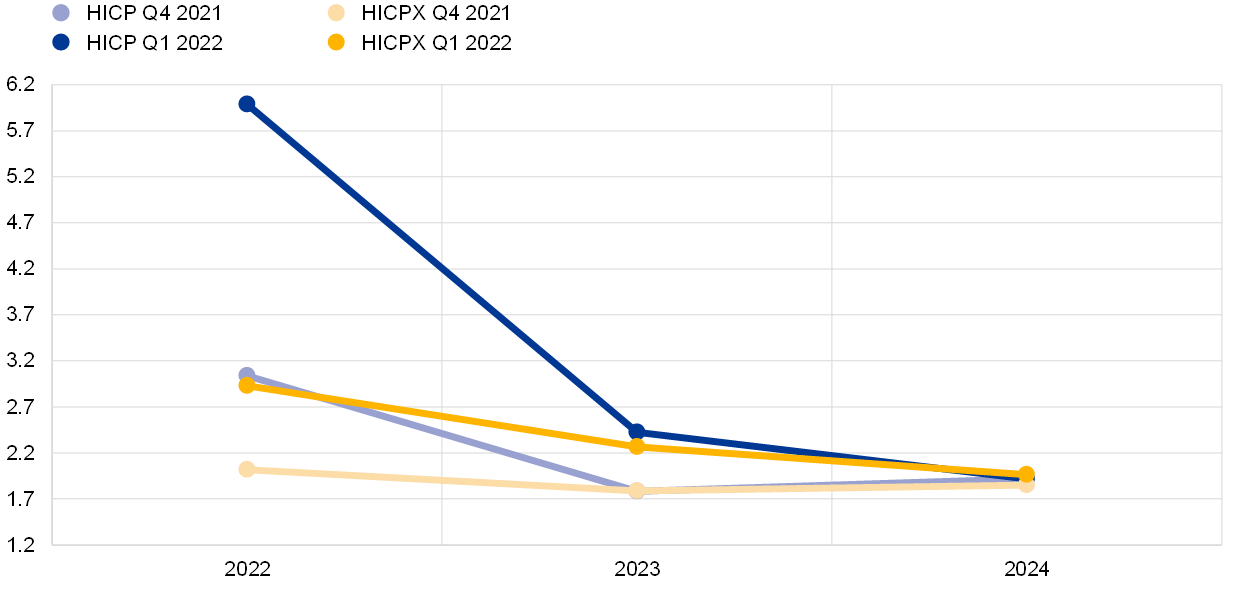
SPF respondents revised up their inflation expectations for 2022 and 2023. These stand at 6.0% and 2.4% respectively, higher by 3.0 and 0.6 percentage points compared with the previous survey (see Chart 1). Expectations for 2024 were unrevised at 1.9%. Compared with the March 2022 ECB staff macroeconomic projections, which were based on February 2022 HICP data as the latest available information, inflation expectations in this SPF round were higher by 0.9 percentage points for 2022 and by 0.3 percentage points for 2023, but the same for 2024 (see Table 1).
Chart 1
Inflation expectations: overall HICP inflation and HICP inflation excluding energy, food, alcohol and tobacco
(annual percentage changes)
Regarding the near-term outlook, respondents cited the war in Ukraine and the sharp increases in energy and food commodity prices as the main factors behind their upward revision to the 2022 and 2023 inflation forecasts. In addition to the direct impact on consumer prices for energy and food, respondents also noted that indirect effects working through the production chain as well as the adverse effects on supply chains were behind the higher forecasts for HICP inflation excluding food and energy (see below). High inflation was generally viewed as being primarily determined by “cost-push” rather than “demand-pull” factors and considered that the war in Ukraine had reignited and amplified price pressures that had started to show signs of peaking. Respondents indicated that they consider that these effects would diminish, as, notwithstanding the large upward revision to the annual average inflation rate forecast for 2022 and 2023, respondents expect a substantial decline in inflation to 1.9% in 2024. Their one-year ahead forecast for inflation in March 2023 is 2.8% – considerably lower than the latest available inflation data (7.5% HICP flash estimate for March 2022) and 1.9% for March 2024. The expected decline in inflation is attributed primarily to the view that energy and food commodity prices are expected to plateau in 2022 and to at least partially reverse thereafter.
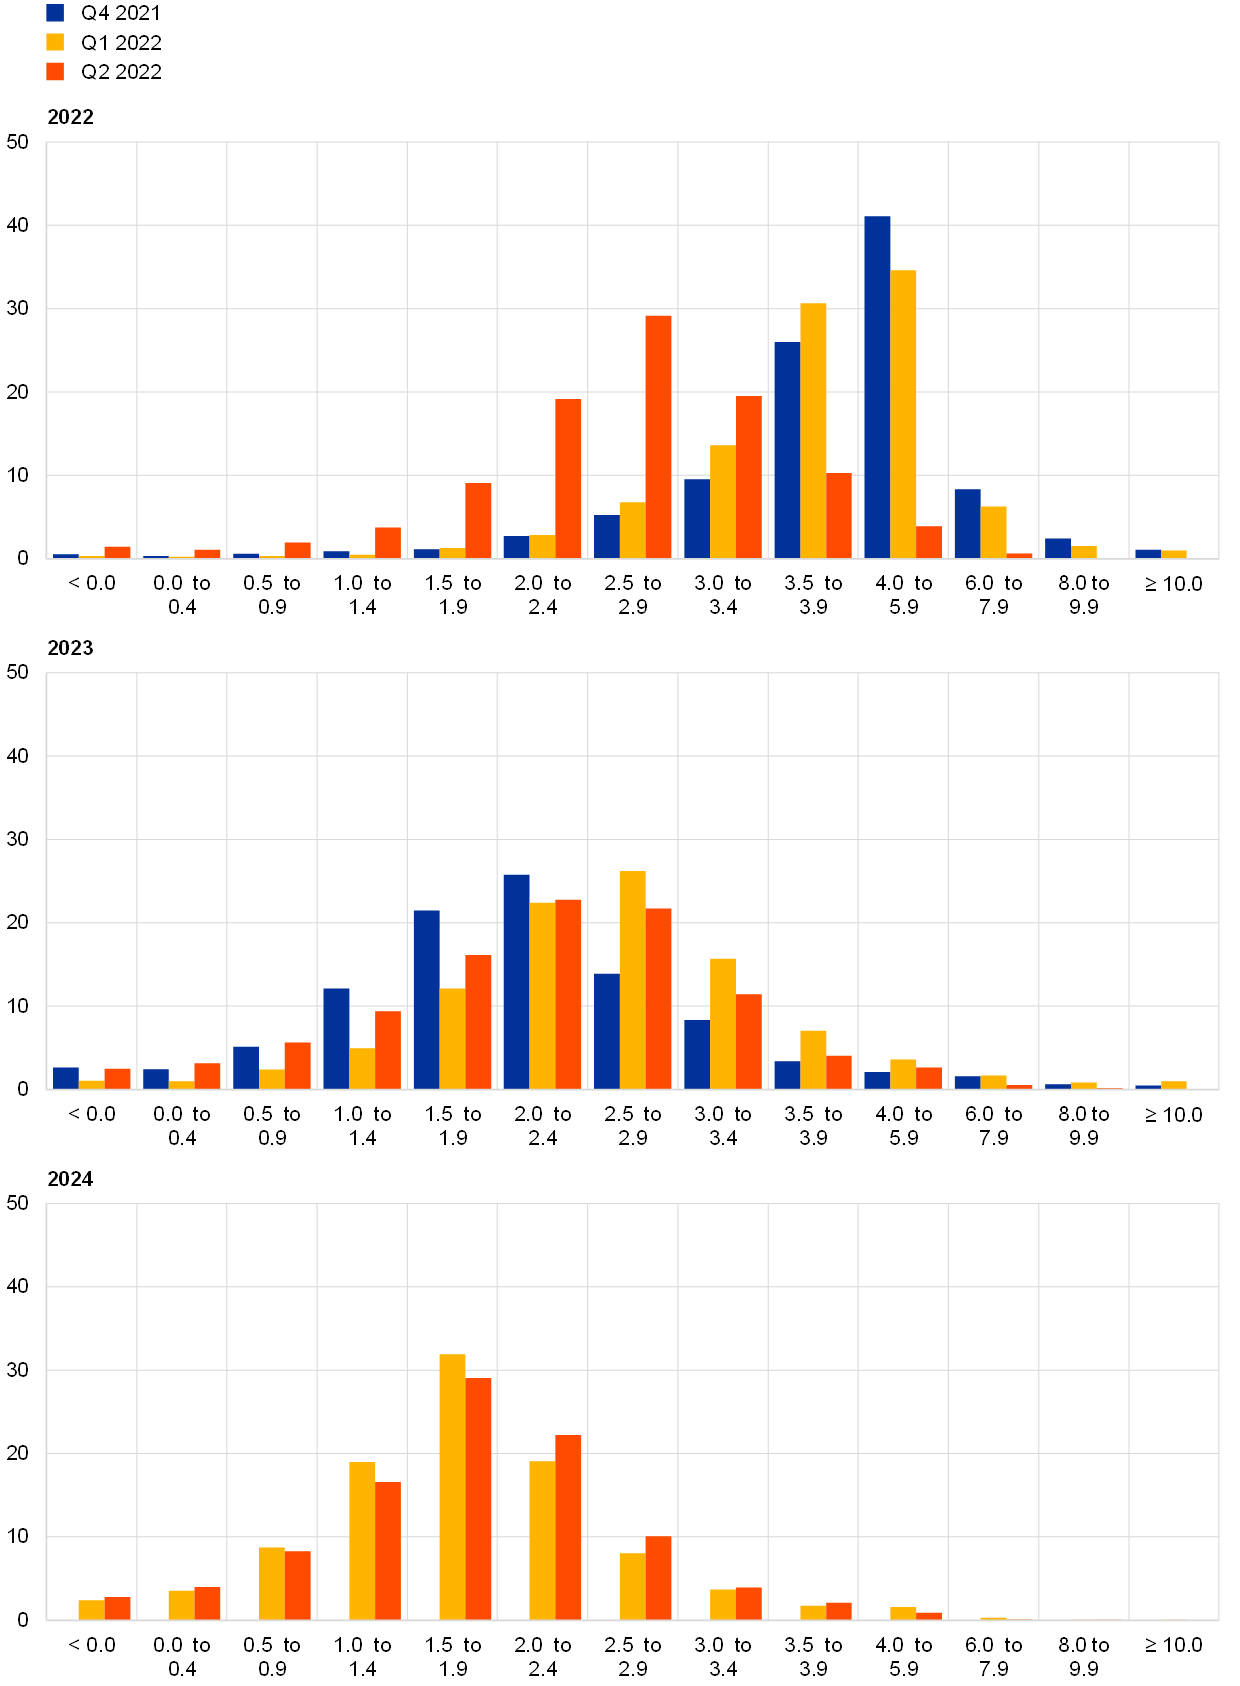
For the shorter and medium-term horizons, quantitative indicators of uncertainty surrounding the inflation outlook remained elevated and those for the balance of risks were on the upside.[2] Quantitative indicators of uncertainty for inflation derived from the reported probability distributions remained at historically high levels. The high level of “aggregate uncertainty” owes to a combination of elevated “disagreement” across forecasters about their point forecasts as well as a high average level of “individual uncertainty”. The aggregate probability distributions for the calendar years from 2022 to 2024 are presented in Chart 2. The quantitative balance of risk indicator (calculated as the estimated mean of the aggregate probability distribution minus the average reported point expectation) for shorter horizons was generally to the upside. In their qualitative remarks, respondents reported elevated uncertainties for the short-term inflation outlook related in particular to the duration of the war in Ukraine as well as to possible disruption of energy flows. Considering more medium-term risks, potential second-round effects of inflation on wages was cited as an upward risk factor.
SPF expectations for inflation excluding energy, food, alcohol and tobacco (HICPX) were also revised up, particularly for 2022 and 2023. HICPX expectations for 2022, 2023 and 2024 stood at 2.9%, 2.3% and 2.0% respectively, representing upward revisions of 0.9 percentage points for 2022, 0.5 percentage points for 2023 and 0.1 percentage points for 2024. Respondents indicated that the upward revisions reflect a higher starting point as well as indirect effects from higher energy and food prices and effects from supply chain disruptions. HICPX inflation is still expected to ease back toward 2.0% by 2024. The SPF forecasts for HICPX were higher than those from the March 2022 ECB staff macroeconomic projections for 2022, 2023 and 2024, by 0.3, 0.5 and 0.1 percentage points respectively (see Table 1).
Chart 2
Aggregate probability distributions for expected inflation in 2022, 2023 and 2024
(x-axis: HICP inflation expectations, annual percentage changes; y-axis: probability, percentages)
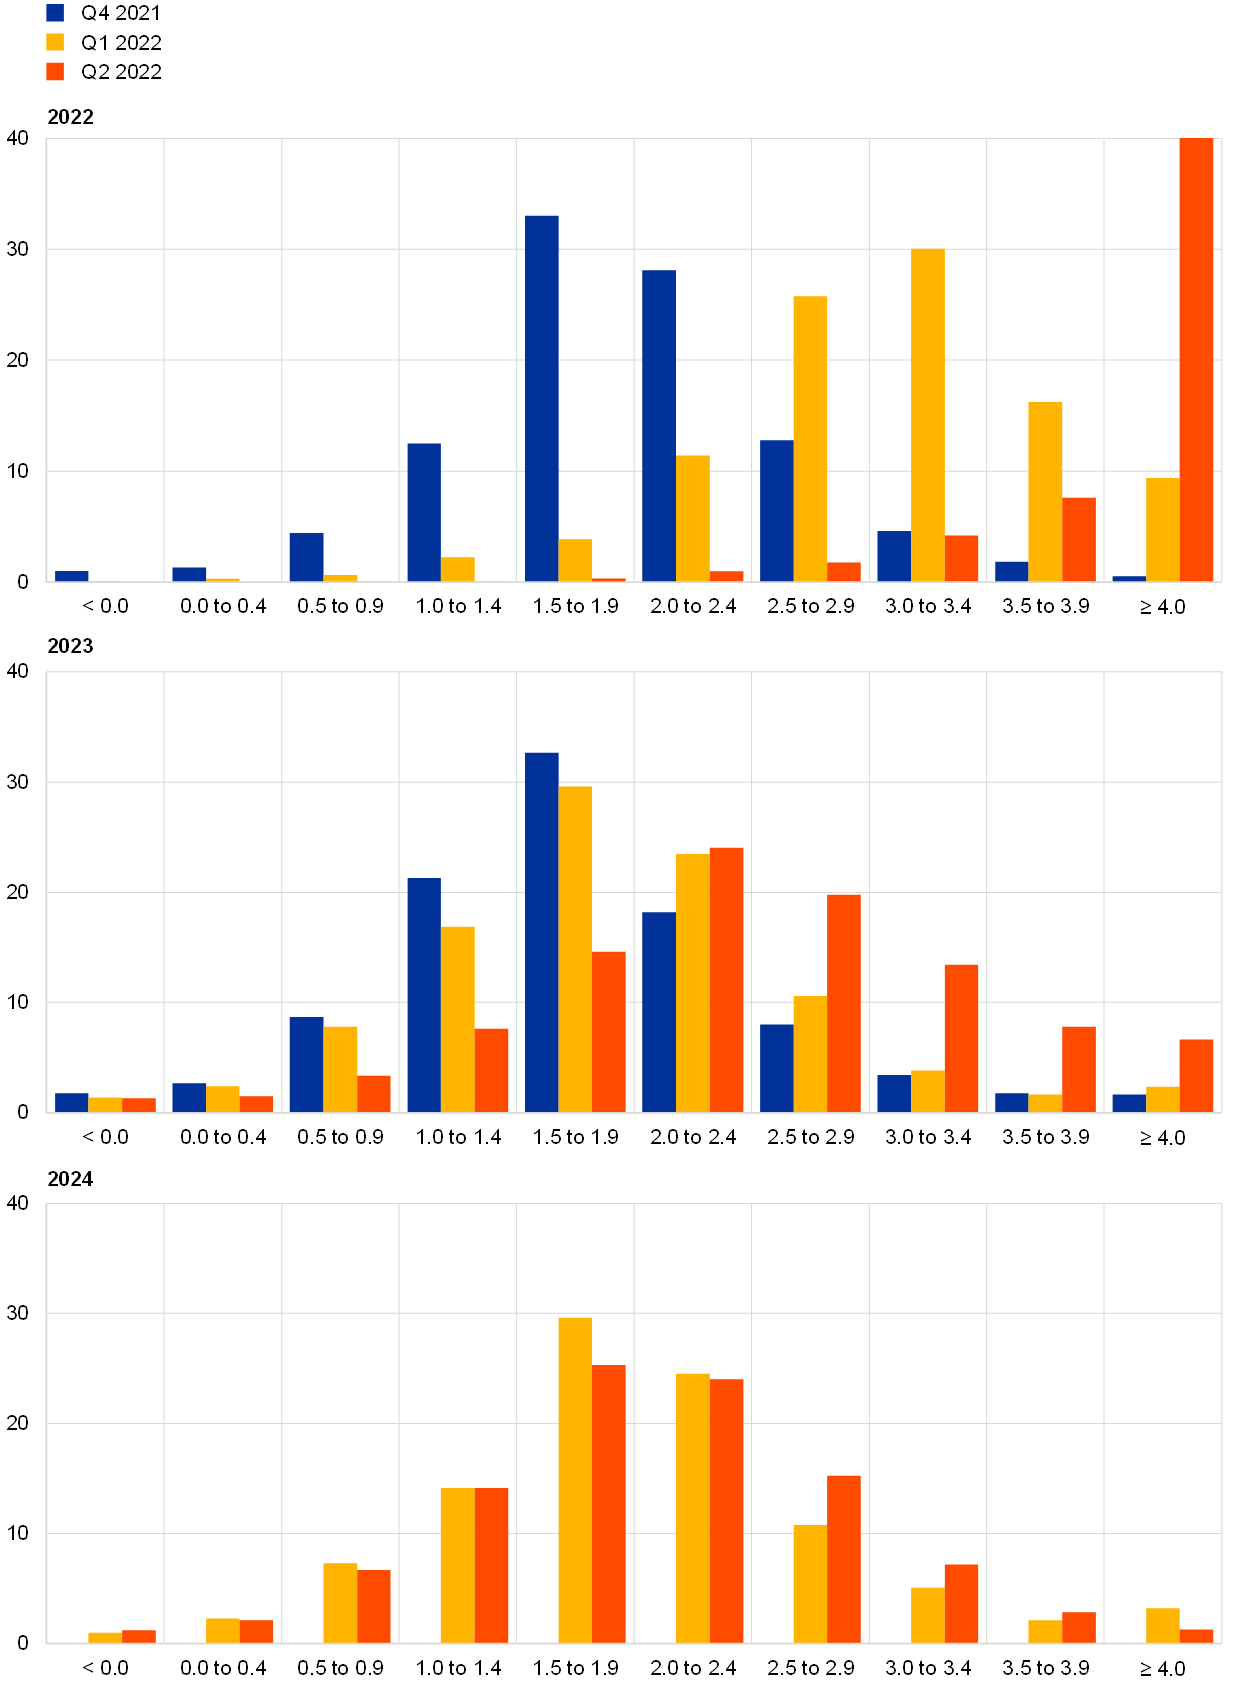
Notes: The SPF asks respondents to report their point forecasts and to separately assign probabilities to different ranges of outcomes. This chart shows the average probabilities they assigned to different ranges of inflation outcomes in 2022, 2023 and 2024. To minimise changes to the questionnaire, the upper bin for inflation outcomes was not changed. The fact that this would lead to most probability being assigned to the upper bin for 2022 was flagged to respondents when sending out the questionnaire. Expectations for 2024 were not surveyed in the Q4 2021 round.
2 Longer-term inflation expectations revised up further
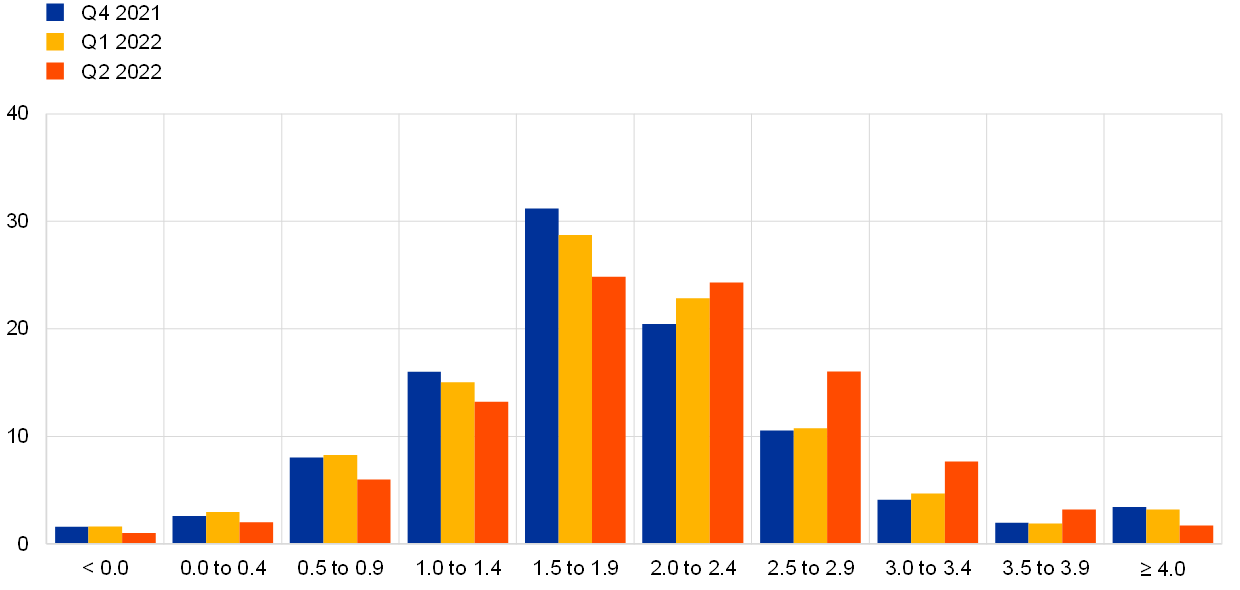
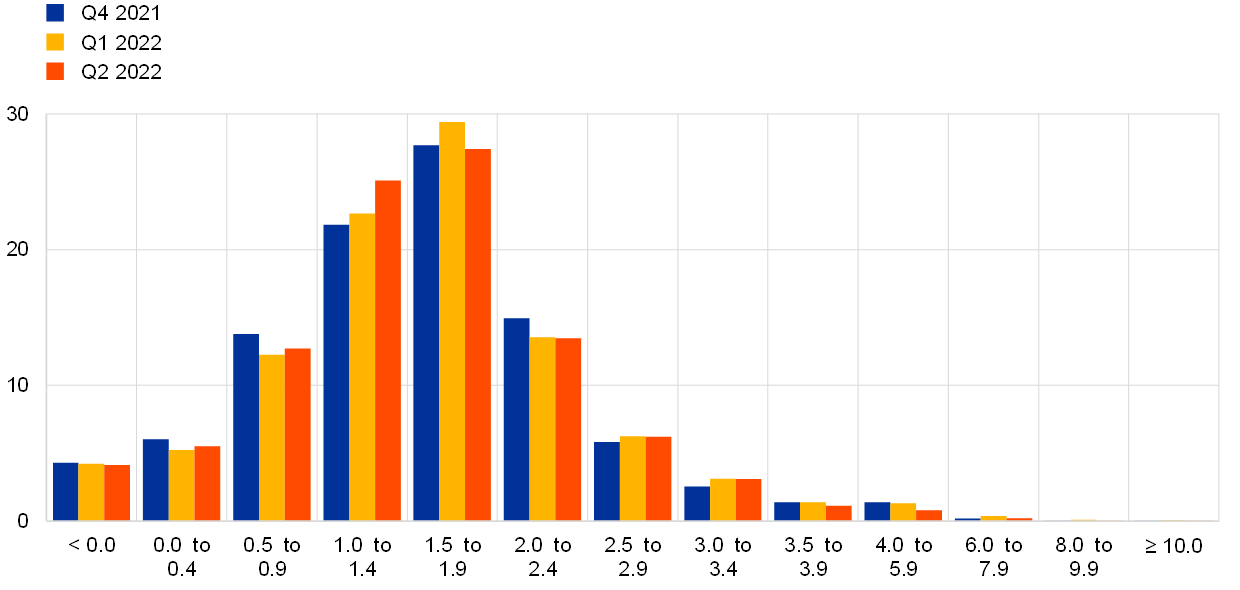
Longer-term inflation expectations (for 2026) averaged 2.1%, a further upward revision from 2.0% in the previous round. The median point expectation increased to 2.0% from 1.9% in the previous round. The estimated mean of the aggregate probability distribution also increased to 2.0% from 1.9% (see Chart 3). Having remained in a narrow range (1.64-1.69%) in the SPF rounds between the fourth quarter of 2019 and the second quarter of 2021, longer-term inflation expectations have moved up noticeably since the third quarter of 2021. In the most recent round (second quarter of 2022), considering a balanced panel of those who also replied in the first quarter of 2022 round, many more respondents revised their longer-term inflation expectations upward than downward.[3] In recent rounds, the distribution of individual point forecasts has changed considerably when compared with rounds from 2019 to 2021 (see Chart 4). The mode of the distribution was clearly at 2.0% and the general shape was relatively similar to that which prevailed over the period from the third quarter of 2003 (after the 2003 monetary policy strategy review) to the first quarter of 2014.

Chart 4
Distribution of point expectations for HICP inflation in the longer term
(x-axis: longer-term HICP inflation expectations, annual percentage changes; y-axis: percentages of respondents)
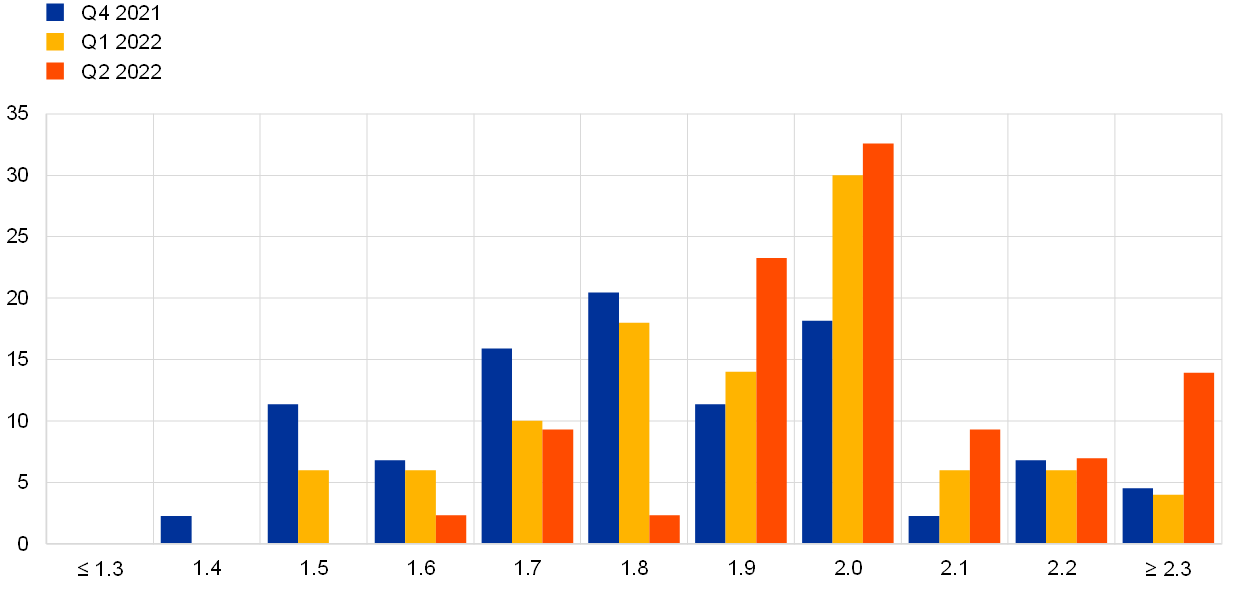
Notes: The SPF asks respondents to report their point forecasts and to separately assign probabilities to different ranges of outcomes. This chart shows the spread of point forecast responses.
Uncertainty surrounding longer-term inflation expectations eased somewhat, while the balance of risks became much less negative. However, the decrease in the standard deviation of the aggregate probability distribution (see Chart 5) owed primarily to decreased disagreement while individual uncertainty as measured by the average width of the individual probability distributions increased to a historically high level. The balance of risk indicator, while remaining to the downside, moved the closest to balanced observed since 2009. The probability associated with longer-term inflation being in the range 1.5-2.5% decreased slightly to 49% (from 52%). There was some shift in the probability associated with longer-term inflation being below 1.5%, (from 28% to 22%), to outcomes above 2.5% (from 20% to 29%).
Chart 5
Aggregate probability distribution for longer-term inflation expectations
(x-axis: HICP inflation expectations, annual percentage changes; y-axis: probability, percentages)
Notes: The SPF asks respondents to report their point forecasts and to separately assign probabilities to different ranges of outcomes. This chart shows the average probabilities they assigned to different ranges of inflation outcomes in the longer term.
The longer-term expectations for HICP inflation excluding energy, food, alcohol and tobacco (HICPX) remained at 1.9%. This unchanged figure conceals some upward movement at the second decimal place. Of the 28 respondents who provided longer-term HICPX expectations in both the second quarter of 2022 and first quarter of 2022 rounds, 15 revised them up, 11 were unchanged and two revised them down. The median longer-term point expectation for HICPX increased to 1.9% from 1.8%. The evolution of longer-term expectations for HICP and HICPX inflation has been broadly similar for the period of available data since the fourth quarter of 2016; and the level difference of around 0.1 percentage point on average has remained broadly unchanged also in the second quarter of 2022 round.
3 Real GDP growth expectations were on balance revised down
GDP growth expectations in the Q2 2022 survey round stood at 2.9% for 2022, at 2.3% for 2023 and at 1.8% for 2024 (see Chart 6). These imply downward revisions compared with the previous round of 1.3 percentage points for 2022 and 0.4 percentage points for 2023, but a small upward revision of 0.1 percentage points for 2024. Almost all respondents attributed their downward revisions to the repercussions of the Russian invasion of Ukraine. Aside from higher energy and food commodity prices, disruptions in some sectors and the sanctions imposed, they noted that the situation had resulted in falls in business and consumer confidence and loss of purchasing power for households. The new partial lockdowns in China (in response to coronavirus outbreaks there) were also mentioned as a factor contributing to prolonged supply chain disruptions and an additional economic headwind. Respondents decidedly pointed to downside risks to growth from economic sectors most affected by increased energy prices, such as manufacturing, which could be long-lasting. Going forward, risks are seen on the downside, particularly if the war’s duration is longer than assumed as well as with respect to the development of energy prices and supply bottlenecks. Upward risks mentioned were a quick resolution of the war as well as possible mitigation of the worst effects of high energy prices from fiscal interventions. Longer-term growth expectations (which refer to 2026) were marginally (by 0.1 percentage point) lower at 1.4%.

Respondents revised down the profile of their short-term GDP outlook in particular for the second quarter of 2022.[4] Actual quarter-on-quarter real GDP growth for the fourth quarter of 2021 was 0.3%, similar to the forecast of 0.4% in the first quarter of 2022 round.[5] In this round, forecasters expected quarter-on-quarter growth in the first quarter of 2022 to remain modest at 0.2% and to increase only slightly to 0.4% in the second quarter of 2022 (previously they expected an increase from 0.5% to 1.0%). Growth is then expected to move further up in 20022 Q3 and 2022 Q4, at 0.7% and 0.6% respectively (see Chart 7). Although one quarter of the forecasters who provided a forecast quarterly growth profile see at least one quarter of negative growth between the first and fourth quarters of 2022, only 4% forecast a technical recession (two consecutive quarters of negative growth). Compared with the March 2022 ECB staff macroeconomic projections, respondents were on average of the same opinion for the first quarter of 2022, and more pessimistic for the rest of 2022.
Chart 7
Expected profile of quarter-on-quarter GDP growth
(quarter-on-quarter percentage changes)
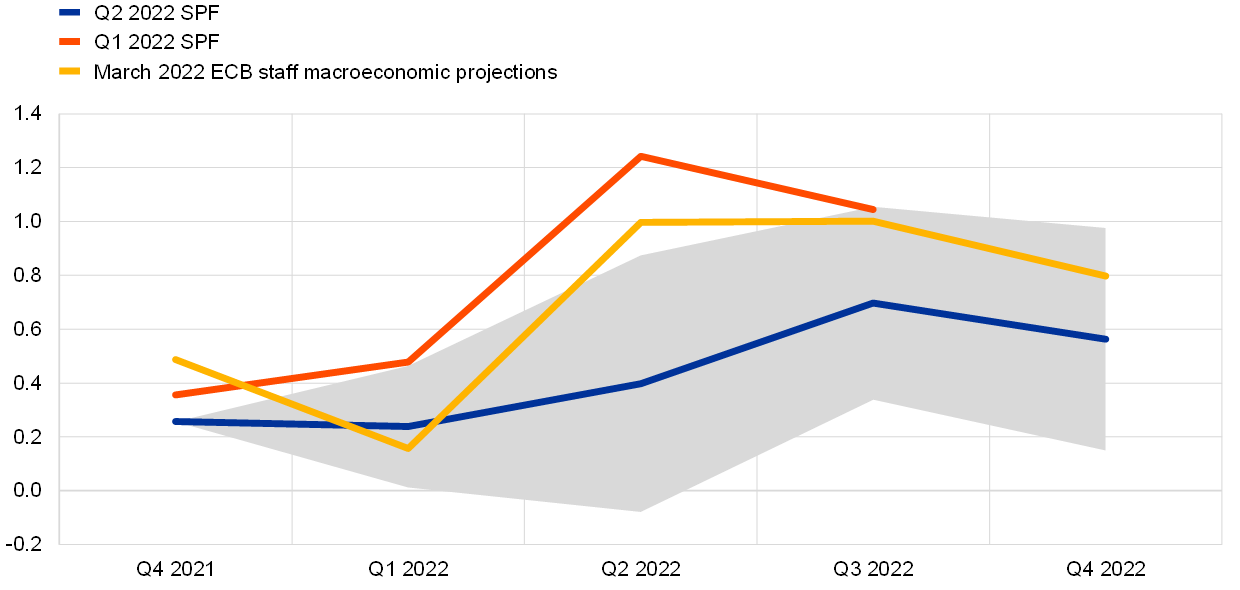
Notes: Grey area indicates one standard deviation (of individual expectations) around average SPF expectation.
Although real GDP returned to above its pre-pandemic level in the fourth quarter of 2021, the downward revisions to expected growth in 2022 and 2023 have delayed its expected return to the pre-pandemic profile – see Chart 8. Expected GDP levels are also lower (by 1.0-1.5 percentage points) than forecast in the March 2022 ECB staff macroeconomic projections.
Chart 8
Forecast profile of real GDP level
(2019 = 100)
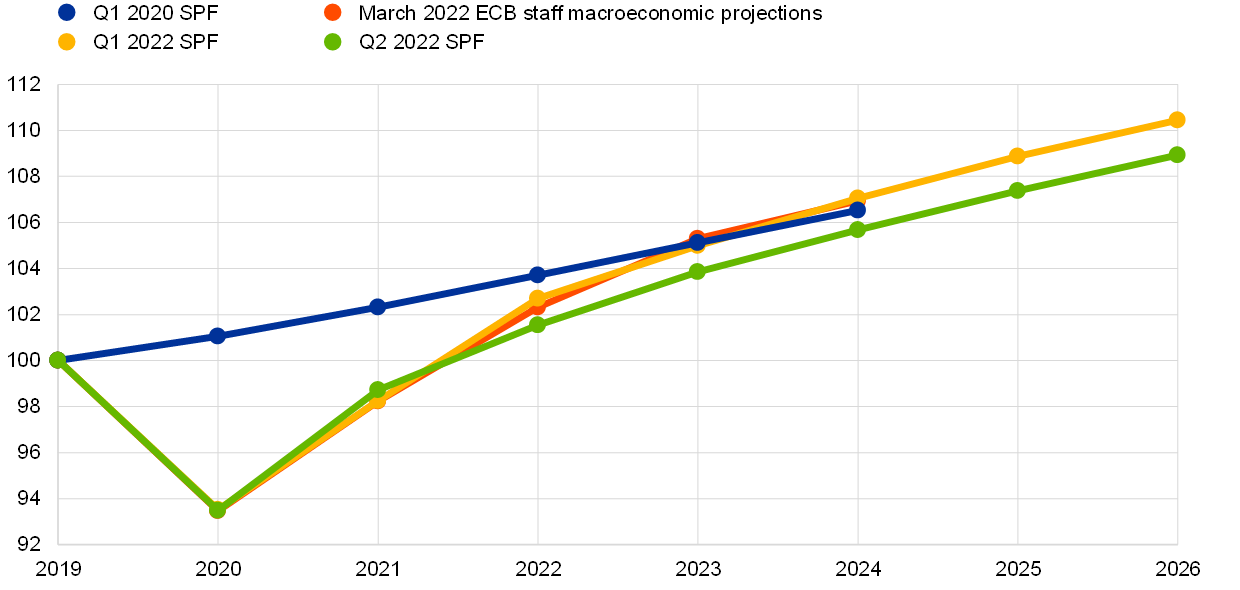
Note: Growth expectations for years not surveyed have been interpolated linearly.
Quantitative measures of uncertainty eased this round, but the medium-term balance of risk indicator turned negative (see Chart 9 and Chart 10). Aggregate uncertainty decreased at the two-years ahead and longer-term horizons. Overall, uncertainty was still elevated by historical standards but considerably lower than at its peak in the second and third quarters of 2020. Many of the risk factors identified in the qualitative comments were also factors mentioned when explaining the changes to the baseline forecasts. On the downside this was overwhelmingly related to the war in Ukraine, even higher food and commodity prices and further sanctions. Generally, with a prominent role of the war in Ukraine, in this round the coronavirus (COVID-19) pandemic was considered a less pertinent factor behind uncertainty and risk assessments.
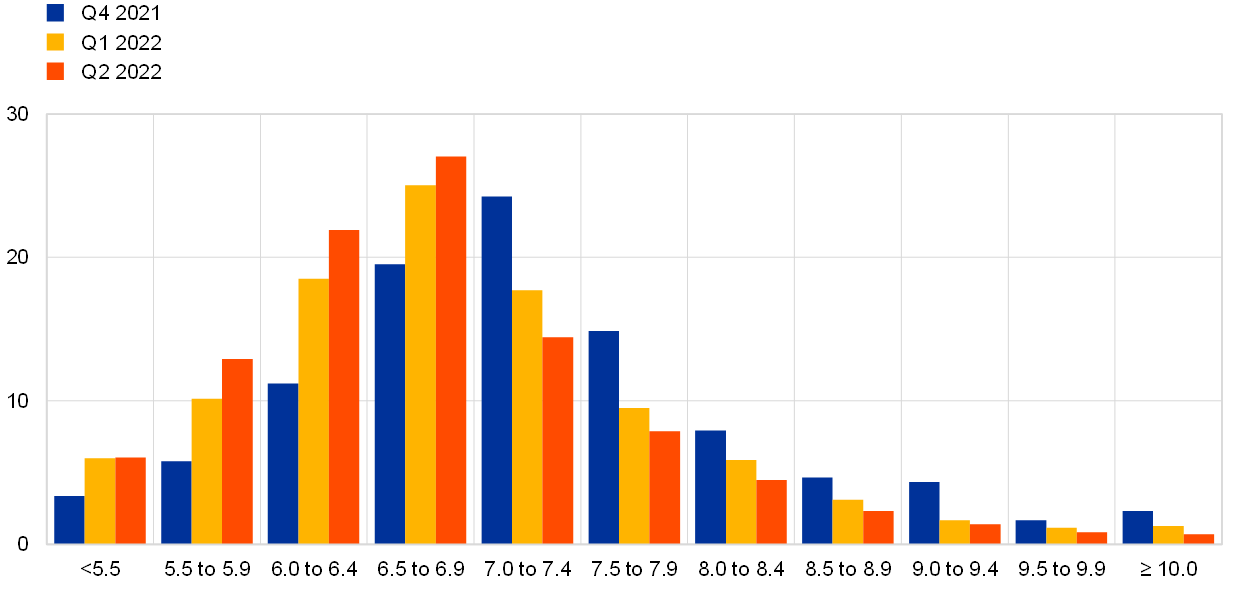
Chart 9
Aggregate probability distributions for GDP growth expectations for 2022, 2023 and 2024
(x-axis: real GDP growth expectations, annual percentage changes; y-axis: probability, percentages)
Notes: The SPF asks respondents to report their point forecasts and to separately assign probabilities to different ranges of outcomes. This chart shows the average probabilities they assigned to different ranges of real GDP growth outcomes in 2022, 2023 and 2024. For outcomes above 4%, bins are 2 percentage points wide. Expectations for 2024 were not surveyed in the previous two rounds.
Chart 10
Aggregate probability distribution for longer-term GDP growth expectations
(x-axis: real GDP growth expectations, annual percentage changes; y-axis: probability, percentages)
Notes: The SPF asks respondents to report their point forecasts and to separately assign probabilities to different ranges of outcomes. This chart shows the average probabilities they assigned to different ranges of real GDP growth outcomes in the longer term.
4 Unemployment rate expectations revised down again over all horizons
The average point forecasts for the unemployment rate in the second quarter of 2022 round were 6.9%, 6.8% and 6.7% for 2022, 2023 and 2024, respectively. The expectation for 2026 was 6.6%, the lowest rate recorded for long-term unemployment expectations since the fourth quarter of 2007. The expected downward sloping trajectory of the unemployment rate remains (as in the previous round), but, starting from a lower level in 2022, is somewhat flatter (see Chart 11). Notwithstanding the downward revisions to GDP growth forecasts, respondents have revised down their unemployment rate forecasts by between 0.1-0.3 percentage points depending on the horizon. Respondents reported that downward revisions for 2022 are due to the data indicating a better-than-expected strength of the labour market.

Uncertainty surrounding expectations for the unemployment rate decreased further for all horizons, however it still stands at relatively elevated levels, while overall risks were to the upside for all horizons. On balance, the probability distributions are showing marginally (positive) skewness toward higher unemployment rate outcomes mostly for shorter but also for longer horizons (see Chart 12 and Chart 13). The balance of risk indicator for longer-term expectations remained positive as the mean of the aggregated probability distribution (at 6.7%) was slightly higher than the average point forecast (6.6%). The biggest and most frequently mentioned risk being the scenario of lower growth, with the subsequent loss of confidence and hiring from the business sector. Higher inflation (reducing real disposable incomes and consumption as well as feeding into wages) and the possibility of large inflows of immigration due to the war in Ukraine are the other most frequently mentioned factors that could give rise to more adverse unemployment rate outcomes.
Chart 12
Aggregate probability distributions for the unemployment rate in 2022, 2023 and 2024
(x-axis: unemployment rate expectations, percentages of the labour force; y-axis: probability, percentages)
Notes: The SPF asks respondents to report their point forecasts and to separately assign probabilities to different ranges of outcomes. This chart shows the average probabilities they assigned to different ranges of unemployment rate outcomes for 2022, 2023 and 2024. Expectations for 2024 were not surveyed in the previous two rounds.
Chart 13
Aggregate probability distribution for the unemployment rate in the longer term
(x-axis: unemployment rate expectations, percentages of the labour force; y-axis: probability, percentages)
Notes: The SPF asks respondents to report their point forecasts and to separately assign probabilities to different ranges of outcomes. This chart shows the average probabilities they assigned to different ranges of unemployment rate outcomes in the longer term.
5 Expectations for other variables
Forecasters expected: the ECB’s key main refinancing operations (MRO) interest rate to remain largely unchanged until the fourth quarter of 2022 with a clearer and broad-based consensus for an increase in 2023; the euro to be largely stable against the dollar in a range between 1.10 and 1.12 until 2023; oil prices to decrease steadily to levels around USD 89 per barrel until 2023; and nominal wage growth to increase at a rate higher than 3% until 2023 and decrease in the longer-term.
The median (and majority) expectation was for the rate on the Eurosystem’s main refinancing operations to remain at 0% until the third quarter of 2022, even though 23% (11 out of 47) of respondents expect marginal increases already in the third quarter. Interest rates are expected to stand at an average level of 0.60% (up from 0.11%) in 2023 and reach 1.0% (up from 0.33%) by 2024 (see Chart 14a). Overall, consensus for an interest rate lift-off became stronger with about half of forecasters reporting a positive interest rate in the fourth quarter of 2022, 87% in the first quarter of 2023 and more than 95% in 2023.
The expected average USD/EUR exchange rate was revised downward over all horizons and is expected to stand on average at around 1.10 in 2022, to then slightly increase at a constant pace up to 1.15 by 2024 (see Chart 14b).
Compared with the previous round, the level of US dollar-denominated oil prices (per barrel) was heavily revised upwards. The revisions were about USD 31 and USD 21 per barrel for 2022 and 2023, respectively. Compared to the previous SPF round, oil price expectations follow a steeper downward trajectory from about USD 111 per barrel in the second quarter of 2022 to around USD 89 per barrel in 2024 (see Chart 14c). Given the expected USD/EUR exchange rate, the implied revisions to the profile for the oil price in euro terms are similar to those in US dollar terms – EUR 29.8 in 2022 and EUR 20.1 in 2023.
Expectations for the annual growth in compensation per employee were revised up by 0.7 percentage points for 2022 and by 0.5 percentage points for 2023 with respect to the previous round, while remaining roughly the same in 2024 (see Chart 14d). Although revised down by 0.1 percentage points, long-term expectations stand at 2.4% thereby remaining still above the average expected growth rate for that horizon of about 2.2% recorded between 2012 and 2019.

6 Annex (chart data)
Excel data for all charts can be downloaded here.
© European Central Bank, 2022
Postal address 60640 Frankfurt am Main, Germany
Telephone +49 69 1344 0
Website www.ecb.europa.eu
All rights reserved. Reproduction for educational and non-commercial purposes is permitted provided that the source is acknowledged.
For specific terminology please refer to the ECB glossary (available in English only).
PDF ISSN 2363-3670, QB-BR-22-002-EN-N
HTML ISSN 2363-3670, QB-BR-22-002-EN-Q
- The survey was conducted between 1 and 4 April 2022, with 58 responses received – this is in line with the historical average response rate. Participants were provided with a common set of the latest available data for annual HICP inflation (March 2022 flash estimates: overall inflation, 7.5%; underlying inflation, 3.0%), annual GDP growth (fourth quarter of 2021, 4.6%) and unemployment (February 2022, 6.8%).
- The width of the reported probability distributions indicates the perceived degree of overall uncertainty, whereas the asymmetry of the distributions indicates whether that uncertainty is more concentrated on higher or lower outturns, i.e. it measures the perceived balance of risks. Regarding uncertainty, it can be shown that the width (or standard deviation) of the aggregated probability distribution (i.e. “aggregate uncertainty”) is a function of the average width (or standard deviations) of the individual probability distribution (i.e. “individual uncertainty”) and standard deviation of the individual point forecasts (i.e. “disagreement”).
- Of the 39 respondents providing longer-term inflation expectations in both rounds, 22 revised them up, three revised them down and 14 were unchanged.
- 47 respondents provided this profile.
- At the time the survey was conducted the second estimate of GDP in Q4 2021 reported quarter-on-quarter growth of 0.3%.
-
15 April 2022