


Inflation developments in the euro area and the United States
Published as part of the ECB Economic Bulletin, Issue 8/2022.
Headline inflation has increased sharply in the euro area and in the United States since the start of 2021. An earlier and stronger increase had been recorded in the United States, but headline inflation has been higher in the euro area since July 2022.[1] In November inflation in the euro area Harmonised Index of Consumer Prices (HICP) stood at 10.1%, after 10.6% in October, while inflation in the US Consumer Price Index (CPI) peaked at 9.1% in June and then moderated somewhat, standing at 7.1% in November.
Chart A
Headline inflation and components
a) Inflation developments
(annual percentage changes and percentage point contributions)

b) Contributions of the main components of inflation
(annual percentage changes and percentage point contributions)

Sources: Eurostat, US Bureau of Labor Statistics and ECB calculations.
Notes: The HICPX is the euro area HICP excluding food and energy (i.e. core inflation). The PCE is the US personal consumption expenditure price index. The latest observations are for November for the HICP and CPI, and October for the PCE.
Energy and food price inflation have played a key role as drivers of the higher headline inflation recorded in the euro area. In November energy inflation alone accounted for 38% of headline inflation in the euro area – but only for 14% in the United States. Together, energy and food inflation make up around two-thirds of headline inflation in the euro area, but only around one-third of headline inflation in the United States (Chart A). A key reason for higher energy inflation in the euro area is the much higher natural gas prices – resulting from the important role Russian gas had played for the euro area before Russia’s war against Ukraine – and the knock-on effects on electricity prices.[2] HICP inflation excluding food and energy stood at 5.0% in November in the euro area. This was still lower than inflation in the US CPI excluding food and energy (core inflation), which stood at 6.0% in the same month. However, the HICP excluding food and energy moved sideways at a high level in November, whereas the US CPI excluding food and energy declined slightly.
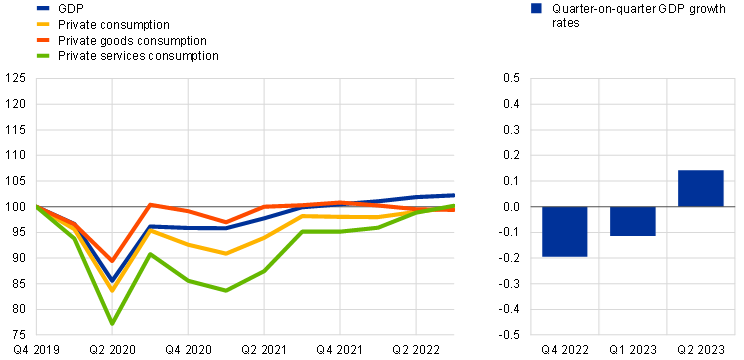
A stronger consumption-driven recovery in the United States has been a key driver of differences between underlying inflation developments in the two economies. Real GDP in the United States returned to its pre-pandemic level about two quarters ahead of euro area real GDP (Chart B), primarily as a result of stronger recoveries in US private consumption and investment. In particular, private consumption of both goods and services has only very recently returned to the level recorded in the fourth quarter of 2019 in the euro area, whereas it had already surpassed its pre-pandemic level in the United States in early 2021. Stronger consumer spending together with a faster easing of supply bottlenecks in the United States also supported a return of US private non-residential investment to its pre-pandemic level in the first half of 2021. By contrast, such investment in the euro area, adjusted for particularly volatile intangible investment, only surpassed its pre-pandemic level in late 2021.
Chart B
Real GDP and consumption
a) Euro area
(Q4 2019 = 100; quarter-on-quarter percentage changes)
b) United States
(Q4 2019 = 100; quarter-on-quarter percentage changes)

Sources: Eurostat, US Bureau of Economic Analysis, December 2022 Eurosystem staff macroeconomic projections database and ECB calculations.
Notes: The latest observations for the left-hand panels are for the third quarter of 2022. The right-hand panels show projected GDP growth.
Discrepancies in consumption growth between the two economies can largely be explained by two factors – fiscal policy design and terms-of-trade dynamics. First, a very fast and strong recovery in goods consumption in the United States was spurred by general and relatively large household income support during the pandemic, including stimulus checks and enhanced unemployment benefits.[3] In the euro area, government support was more targeted towards those most exposed to the pandemic, either through compensation of income losses or through job retention schemes.[4] Second, the rise in energy prices since the spring of 2021, which was significantly exacerbated a year later by the war in Ukraine, resulted in a terms-of-trade shock which hit the euro area far harder than the United States, as the euro area was heavily dependent on gas imports from Russia (Chart C).[5] This impact was intensified by exchange rate developments, with the US dollar appreciating strongly while the euro depreciated not only vis-à-vis the US dollar but also in effective terms. In the euro area, the estimated impact was equivalent to a transfer of around 2.2% of GDP to the rest of the world, cumulated over four quarters up to the third quarter of 2022. In the United States, the income effect was broadly neutral, as the country is self-sufficient in terms of energy. The terms-of-trade losses significantly reduced household disposable income in the euro area, with a particularly strong impact on demand for durable goods.[6] Income losses through this channel may increase further and hence dampen activity in the euro area in the coming quarters.
Chart C
Income effects of terms of trade
(impact on year-on-year GDP growth in percentage points)

Sources: Haver analytics, Eurostat and ECB calculations.
Notes: The income effect of terms of trade is calculated by weighting export and import price changes by their respective past values (one-year lag) and is expressed as a percentage share of GDP. The latest observations are for September 2022.
In line with last year’s slower recovery in the euro area, the importance of demand as a driver of core inflation has increased more gradually and later than in the United States (Chart D). In the United States, the contribution of demand to core inflation had already reached levels of around 1.5 percentage points in mid-2021 and has increased further to nearly 2 percentage points recently, while in the euro area it increased much more gradually and has reached levels above 1.5 percentage points only in recent months. Focusing on goods inflation, the contribution of supply remains higher than the contribution of demand in both the United States and the euro area. For services, supply factors have played a more important role in the United States, while in the euro area demand factors have been more prominent. In services inflation, where labour is usually by far the biggest input, the higher absolute and relative importance of supply factors in the United States can in part be linked to the tighter labour market and the more sizeable impact of labour shortages on wages than in the euro area.[7]
Chart D
Decomposition of core inflation into demand and supply components
(percentage point contributions)

Sources: Eurostat and ECB calculations.
Notes: The measures for core inflation are the HICP excluding energy and food (HICPX) for the euro area and the personal consumption expenditure deflator excluding food and energy (core PCE) for the United States. The series are seasonally adjusted. The data are based on an application of Shapiro, A.H., “How Much Do Supply and Demand Drive Inflation?”, FRBSF Economic Letters, No 2022-15, Federal Reserve Bank of San Francisco, 21 June 2022; and Shapiro, A.H., “Decomposing Supply and Demand Driven Inflation”, Working Papers, No 2022-18, Federal Reserve Bank of San Francisco, October 2022. For euro area results, see the box entitled “The role of demand and supply in underlying inflation – decomposing HICPX inflation into components”, Economic Bulletin, Issue 7, ECB, 2022. The latest observations are for September 2022 for the euro area and October 2022 for the United States.
Looking ahead, the near-term growth outlook is weaker for the euro area than for the United States, which implies that the impetus from economic activity for inflation will remain smaller in the euro area. Real GDP is expected to contract slightly in the fourth quarter of 2022 and the first quarter of 2023 in the euro area, while it is foreseen to continue to record positive, although modest, growth in the United States according to the December 2022 Eurosystem staff macroeconomic projections (Chart B). The December 2022 Eurosystem staff projections foresee headline HICP inflation to be 6.3% in 2023 and 3.4% in 2024, while HICP inflation excluding food and energy is expected to be 4.2% in 2023 and 2.8% in 2024. While headline inflation is expected to remain higher in the euro area than in the United States in the short term, as a result of the euro area’s greater exposure to energy price shocks related to the war in Ukraine, underlying inflation is foreseen to remain somewhat lower than in the United States in a context of continuing terms-of-trade losses and a less tight labour market.
Professional forecasters expect inflation two years ahead to be slightly higher in the United States than in the euro area. One-year ahead HICP inflation in the euro area is expected to stand at 4.8% according to the ECB Survey of Professional Forecasters (SPF). This is considerably higher than inflation in the personal consumption expenditure (PCE) price index in the United States, which is expected to stand at 3% one year ahead according to the survey conducted by the Federal Reserve Bank of Philadelphia in the fourth quarter of 2022 (Chart E). At the same time, inflation expectations two years ahead for the United States stand at 2.6% for the PCE and 2.8% for the CPI, while two-year ahead inflation expectations for the euro area HICP stand at 2.4% (Chart E). These results suggest that levels of inflation above the central bank target are seen to be somewhat more persistent in the United States. This could reflect the stronger domestic component of inflation in the United States, together with overall more optimistic expectations regarding US labour market dynamism.
Chart E
Short and medium-term inflation expectations and forecasts
(annual percentage changes)

Sources: ECB Survey of Professional Forecasters (EA SPF) for the fourth quarter of 2022, Federal Reserve Bank of Philadelphia Survey of Professional Forecasters for the fourth quarter of 2022 (US SPF).
Notes: The US SPF is conducted one month later than the EA SPF. For the US SPF, one-year ahead expectations are calculated as the average expected inflation rate over the four quarters after the SPF round (i.e. for the survey conducted in the fourth quarter of 2022, this means the average from the first quarter of 2023 to the fourth quarter of 2023) and two-year ahead inflation expectations are the expectations in the quarter the survey is conducted regarding the calendar year after next. For the EA SPF, expectations one year ahead are calculated as the expected inflation rate one year ahead of the latest available data (i.e. in the fourth quarter of 2022 data for September 2022 were available and the one-year ahead expectation refers to the annual inflation rate expected in September 2023) and expectations two years ahead are calculated as the expected inflation rate two years ahead of the latest available data (i.e. in the fourth quarter of 2022 data for September 2022 were available and the two-year ahead expectation refers to the annual inflation rate expected in September 2024).
For earlier developments, see the box entitled “Comparing recent inflation developments in the United States and the euro area”, Economic Bulletin, Issue 6, ECB, 2021, and the box entitled “Recent inflation developments in the United States and the euro area – an update”, Economic Bulletin, Issue 1, ECB, 2022.
See the box entitled “Natural gas dependence and risks to euro area activity”, Economic Bulletin, Issue 1, ECB, 2022, and the box entitled “The impact of the war in Ukraine on euro area energy markets”, Economic Bulletin, Issue 4, ECB, 2022.
See also the box entitled “Economic developments in the euro area and the United States in 2020”, Economic Bulletin, Issue 2, ECB, 2021, and “The EA and the US in the COVID-19 crisis: Implications for the 2022-2023 policy stance”, OECD, January 2022.
See Licchetta, M et al. (2022), “Economic adjustment in the euro area and the United States during the COVID-19 crisis”, European Economy Discussion Paper, 160, European Commission, March.
For more details, see the box entitled “Implications of the terms-of-trade deterioration for real income and the current account”, Economic Bulletin, Issue 3, ECB, 2022.
See the box entitled “The impact of higher energy prices on services and goods consumption in the euro area”, in this issue of the Economic Bulletin.
For details on wage developments, see the box entitled “Comparing labour market developments in the euro area and the United States and their impact on wages” in the article entitled “Wage developments and their determinants since the start of the pandemic” in this issue of the Economic Bulletin.