
- Speech
Monetary policy during the pandemic: the role of the PEPP
Speech by Philip R. Lane, Member of the Executive Board of the ECB, at the International Macroeconomics Chair Banque de France – Paris School of Economics
Paris, 31 March 2022
Introduction
It is a pleasure to speak to you here today. While delivering this lecture in person rather than online is a reflection of the declining public health impact of the pandemic (the current high infection rate notwithstanding), the step-by-step transition to the new normal is currently being overshadowed by the Russian invasion of Ukraine. This war not only confronts us with the immediate implications of a war in Europe, but also constitutes a tectonic shock to the global geopolitical and economic order. Above all, the Governing Council of the ECB expresses its full support to the people of Ukraine. We will ensure smooth liquidity conditions and implement the sanctions decided by the European Union and European governments. We will take whatever action is needed to fulfil the ECB’s mandate to pursue price stability and to safeguard financial stability.
Turning now to the main focus of this lecture, this is a milestone week: the end of March marks the conclusion of ECB net asset purchases under the pandemic emergency purchase programme (PEPP). This is a good moment to review the conduct of monetary policy during the pandemic, with a primary focus on the PEPP. In addition to this review, I will also discuss the current challenges for monetary policy.[1]
The monetary policy response to the pandemic
From the outset, the pandemic posed three challenges for the ECB: first, stabilising financial markets; second, protecting credit supply; and third, countering the adverse impact of the pandemic on the projected inflation path. Tackling the first pair of challenges was necessary to achieve the inflation target, since market instability or a credit crunch would have made it impossible to run an effective monetary policy.
In relation to the adverse impact on the projected inflation path, the June 2020 Eurosystem staff projections marked down the end-of-horizon annual inflation rate for 2022 from 1.6 per cent to 1.3 percent, while the end-of-horizon inflation rate was modelled to decline even further to 0.9 per cent in a severe pandemic scenario. These large-scale inflation downgrades reflected the projected increase in economic slack due to the substantial declines in GDP that were feared.
From a stance perspective, an insufficient monetary policy response would have implied a longer period of low inflation, putting at risk the timely convergence of inflation to the target rate (now defined as two per cent). Excessively-low inflation would have implied higher real interest rates, thereby weakening the recovery of investment and consumption. Moreover, especially in the context of the effective lower bound on policy rates, a protracted period of low inflation might have fostered a downward drift in inflation expectations that could ultimately become entrenched, making it even more difficult for us to deliver our inflation aim. This concern was subsequently codified in the 2021 monetary policy strategy statement that concluded that the delivery of the symmetric two per cent inflation target requires – when the economy is in the proximity of the lower bound – especially forceful or persistent monetary policy measures to avoid negative deviations from the inflation target becoming entrenched.
Monetary policy was already accommodative before the pandemic shock. The prospect of persistent below-target inflation had resulted in a further easing of the monetary stance in September 2019: the deposit facility rate had been lowered to minus 0.5 per cent and net asset purchases were resumed at a rate of €20 billion per month under the ECB’s baseline asset purchase programme (APP). These measures were reinforced by forward guidance that tied future monetary policy decisions to the inflation outlook and developments in underlying inflation dynamics. In addition, credit supply was supported by the third series of targeted longer-term refinancing operations (the TLTRO III programme).
In its initial response to the pandemic crisis in spring 2020, the ECB adopted a comprehensive package of complementary measures. The central elements included: the escalation of asset purchases through the 12 March 2020 decision to add an extra € 120 billion to the already-running APP and the 18 March 2020 launch of the pandemic emergency purchase programme (PEPP), a revision in the structure and pricing of the TLTRO programme, an easing of the collateral framework, and a set of supportive supervisory measures (taken by the supervisory wing of the ECB).
In combination with the forceful fiscal responses at national and EU level – also complemented by the responses of macroprudential and supervisory authorities – these measures have been successful in stabilising financial markets and protecting credit supply. In addition to its market stabilisation role, the additional quantitative easing provided by the PEPP and the extra injection of liquidity through the expansion of the TLTRO programme also eased the overall monetary stance, helping to counter the negative impact of the pandemic on the projected inflation path. The combination of asset purchases and the targeted lending programme led to a substantial expansion of the balance sheet of the Eurosystem, which was of comparable size to the balance sheet increases of the Federal Reserve and the Bank of England (Chart 1).
Chart 1
Change in balance sheets of the Eurosystem, the Federal Reserve and the Bank of England since 2019

Sources: ECB, Federal Reserve Bank of New York, Bank of England, Haver Analytics and ECB calculations.
Notes: For the Eurosystem asset purchases include all PEPP and APP purchases. Credit operations include all TLTROs, PELTROs, MROs, and LTROs. For the Federal Reserve asset purchases include all Treasury bills, notes, and bonds as well as inflation-protected Treasuries and floating-rate Treasuries. These also include agency bonds and mortgage-backed securities. Credit operations include all repurchase agreements, loans, and operations under the Commercial Paper Funding Facility II, the Corporate Credit Facility, the Municipal Liquidity Facility, the Main Street Lending Programme, and TALF II. For the Bank of England asset purchases include all Gilts and corporate assets held within the Asset Purchase Facility. Credit operations include all operations within the ILTR, CTRF, TFS and TFSME. The latest observations are for December 2021.
The pandemic measures should be viewed as acting to reinforce the impact of the already-low levels of the key policy rates. Moreover, the ECB’s forward guidance about the future setting of its policy measures played a central role in determining the overall monetary stance. In relation to the key policy rates, since September 2019 the forward guidance linked future rate setting to the inflation outlook.[2]
The Governing Council framed its forward guidance on the path of policy rates in terms of a commitment to attaining the inflation target by clarifying that policy rates would be lifted only if the evidence was sufficiently robust to foster a high degree of confidence that the inflation rate would reach two per cent on a durable basis.[3] Such state-contingent forward guidance represents a strong commitment to keep financing conditions at sufficiently accommodative levels for as long as necessary to stabilise inflation at the medium-term inflation target in a sustainable fashion.
In line with the state-contingent forward guidance, market-based expectations of future policy rates adjusted in response to changes to the inflation outlook. Chart 2 shows the evolution of the expected timing of the first increase in our key policy rates since the introduction of the state-contingent forward guidance on the path of interest rates. In the initial weeks of the pandemic, the lift off date was pushed from 2022 to 2027, before stabilising around 2025/2026 for most of 2020. Over time, the market view of the lift-off date has been pulled forward, in response to the changing outlook for inflation. While time-varying risk premia (possibly also reflecting some uncertainty about the central bank reaction function) means that the scale of movement in the lift off date might not always conform to the most likely path for future policy rates, the directional pattern of adjustments broadly reinforced the monetary policy stance during much of this period.
Chart 2
Market-based lift-off dates

Sources: Bloomberg, Refinitiv and ECB calculations.
Notes: The market-based lift-off date is the date during which the €STR forward rate exceeds the current €STR rate by at least 10 basis points or 25 basis points. The latest observations are for 18 March 2022.
As I described in earlier contributions, the PEPP was designed with a dual role.[4] First, alongside the ECB’s other monetary policy instruments, asset purchases were the most important mechanism for delivering the additional monetary accommodation required to support the economic recovery and safeguard price stability in the medium term. Second, the flexibility embedded in the PEPP – across time, asset classes and jurisdictions – was essential in enabling the ECB to stabilise financial markets in an efficient and effective manner.
The forward guidance for PEPP was connected to the pandemic: net PEPP purchases would continue until the Governing Council judged that the coronavirus crisis phase was over. In December 2020, the initial calendar guidance that the pandemic crisis phase would last until at least June 2021 was extended to March 2022. The March 2022 end date was confirmed in December 2021, while the calendar guidance on the reinvestment horizon was revised until at least the end of 2024. In any case, the future roll-off of the PEPP portfolio will be managed to avoid interference with the appropriate monetary policy stance.
The calibration of the PEPP had to take into account the substantial step up in net issuance of both public and private securities entailed by the pandemic (Chart 3). In the absence of sufficient asset purchasing by the ECB, this extraordinary increase in issuance could have put significant upward pressure on funding costs, putting firms and households under extra financial pressure and running the risk of an adverse real-financial doom loop by which tighter financing conditions and declining activity levels reinforce each other.
Taken together, the APP and PEPP portfolios now amount to €5 trillion. Chart 4 shows the evolution of these holdings for the four largest member countries, expressed in ten-year equivalents. On this maturity-adjusted basis and expressed as a ratio to the total universe of bonds outstanding, the Eurosystem’s holdings increased from 19 percent to 30 per cent over the period 2020-2021. Chart 5 shows the monthly purchases flows during the pandemic.
While the ex ante flexibility to deviate from the capital key was an essential feature of the PEPP, the ex post deviations from the capital key were relatively limited and also self-corrected over time (Chart 6). In particular, capital key deviations peaked in the early weeks of the PEPP, while subsequent purchasing was generally aligned with the capital key, in view of the rapid stabilisation of spreads in the wake of the PEPP announcement.
Chart 3
Annual net issuance of public and private sector securities
(EUR billion)

Sources: ECB and EBA.
Notes: The dotted line shows ECB staff projections of debt issuance of securities issued by the public sector and the non-financial corporate sector and projections of the European Banking Authority (EBA) for (unsecured) securities issued by the banking sector. The latest observation is for 18 March 2022.
Chart 4
The stock of the APP and the PEPP portfolios
(left side: EUR billions; right side: percentage)
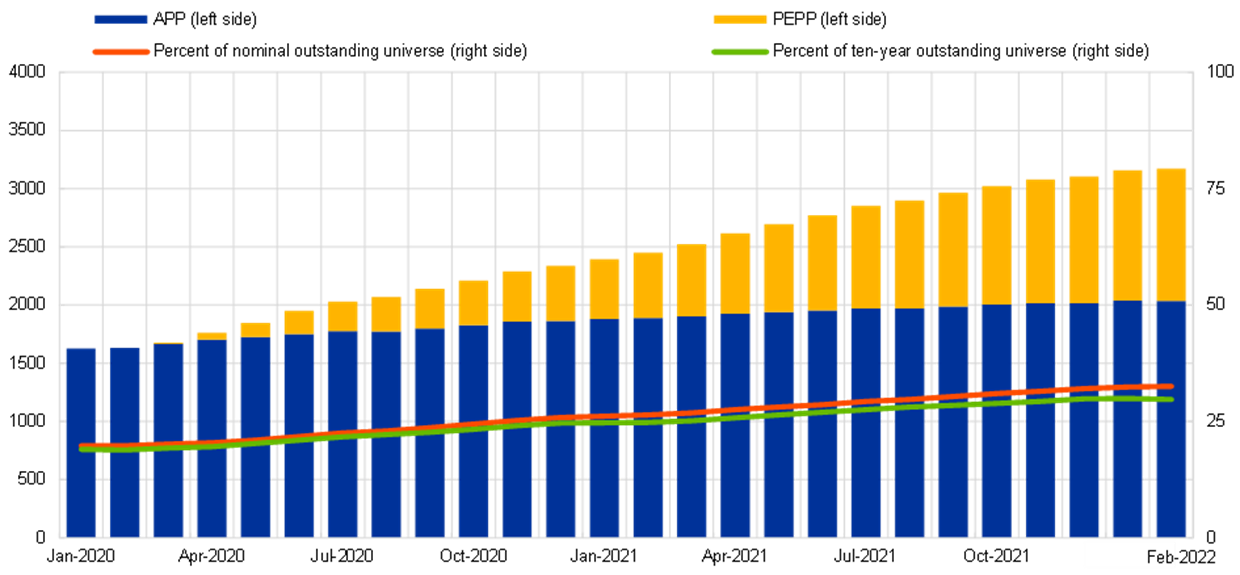
Source: ECB and ECB calculations.
Notes: PEPP and APP government bond holdings (including national government bonds, regional and local government bonds and other relevant agency bonds; excluding supranational bonds) are shown in ten-year equivalent terms. The share of the total outstanding universe is both in terms of nominal holdings and ten-year equivalents. The latest observations are for February 2022.
Chart 5
The monthly flow of net purchases under APP and PEPP
(EUR billion)

Source: ECB.
Notes: Monthly net purchases in book value at month-end. The latest observations are for February 2022.
Chart 6
PEPP portfolio relative to the ECB capital key
(percentage)

Source: ECB.
Notes: The chart plots the cumulative net purchases per country under the PEPP as a share of total cumulative net purchases of public sector securities under the PEPP (excluding supranational securities) in May 2020 and January 2022 against the ECB capital key. The latest observations are for January 2022.
The combination of the pre-pandemic and pandemic-specific monetary policy measures successfully contributed to the stabilisation of markets and thereby helped to ensure the smooth transmission of monetary policy. Charts 7 and 8 show the evolution of the ten-year risk-free yield (as captured by the overnight index swap (OIS) rate) and the spread of the GDP-weighted ten-year sovereign yield over the OIS rate at that tenor. Sovereign yields are central to the transmission of euro area monetary policy, since sovereign bond yields in each member country are the basis for funding costs for households, corporates and banks (in addition to governments).
In relation to the risk-free yields, Chart 7 shows a significant lowering of the ten-year risk-free rate over the course of 2020. Since the short-term risk-free rate is anchored by the deposit facility rate level of minus 50 basis points and the ten-year rate fell towards those levels, the yield curve was relatively flat by December 2020, prompting a pivot in the conduct of the PEPP towards an emphasis on maintaining favourable financing conditions – in particular, preventing a tightening in financing conditions that would have been inconsistent with countering the downward impact of the pandemic on the projected path of inflation.[5]
Chart 7
10-year OIS rate
(percentages per annum)

Sources: Refinitiv, Bloomberg and ECB calculations.
Note: The latest observation is for 25 March 2022.
While Chart 8 shows that sovereign yields have largely tracked the evolution of the risk-free rate, there was an initial decoupling in the first weeks of the pandemic. The significant drop in yields upon the announcement of the PEPP vividly illustrated the importance of central banks in underpinning market stability in the event of a large adverse shock.
Chart 8
Ten-year euro area GDP-weighted sovereign yield spread over OIS
(percentages per annum)

Sources: Refinitiv, Bloomberg and ECB calculations.
Note: The latest observation is for 25 March 2022.
In a monetary union that lacks an area-wide common safe asset, flight-to-safety episodes have a geographic dimension, in view of the high substitutability across national financial systems that is enabled by the absence of currency risk.[6] The nature of such episodes is that heightened risk aversion not only may involve a reassessment of the pricing of fundamentals-based risks but also may induce a self-fulfilling withdrawal to so-called safe haven jurisdictions in the belief that other investors may also opt to make the same geographic reallocation decision.
In the absence of active market stabilisation by the central bank, the intrinsic self-validating nature of flight-to-safety dynamics creates the risk of asset price movements and cross-border financial flows that, in terms of their magnitude, are unwarranted by fundamentals, but that also reflect a switch across multiple self-fulfilling beliefs-driven equilibria.
While it is always challenging to distinguish between fundamentals-driven and beliefs-driven repricing and reallocation dynamics (especially in real time), the specific circumstances of the pandemic crisis suggest that there was a compelling case for the central bank to act as a market stabiliser. First, as outlined above, it was clear that flight-to-safety pressures were operating at a global level, with the risk of a broad disconnect between asset prices and fundamentals across many markets. Second, the nature of the shock (a worldwide pandemic) meant that concerns about moral hazard were more attenuated than in some other scenarios.
The narrowing in sovereign spreads during 2020 was also critically supported by the development of the Next Generation EU (NGEU) programme. The collective commitment of the EU to underpin economic recovery across all member countries through common funding and an allocation key that was not simply proportionate to each country’s size led global investors to re-evaluate their beliefs about the resilience of the EU and the euro.[7]
Chart 9 captures some of the main considerations in calibrating the quarterly pace of purchases under the PEPP. While there was an indicative initial overall envelope for PEPP, the framework also allowed for adjustments to overall stock of asset purchasing. In particular, the overall envelope was rescaled from the initial € 750 billion to € 1,350 billion in June 2020 and € 1,850 billion in December 2020 in line with re-evaluations of the likely duration of the pandemic, the scale of pressure on the bond market and size of the pandemic inflation gap. With its emphasis on maintaining favourable financing conditions (following the flattening of the yield curve in autumn 2020), the December 2020 decision allowed for two-sided flexibility: relative to the € 1,850 billion envelope, the overall expected stock could be revised down if financing conditions eased or the projected inflation shortfall declined; in the other direction, the overall expected stock could be revised up if financing conditions tightened or the projected inflation shortfall increased. In this way, quarterly adjustments to the pace of PEPP purchases could be interpreted as signalling a revision to the overall expected stock of purchases, thereby influencing yields through the well-established stock channel of quantitative easing.
As already noted in the discussion of Charts 7 and 8, the right panel of Chart 9 shows the quarterly evolution of the risk-free rate and the sovereign spreads. During 2020, the decline in the risk-free rate and the stabilisation of sovereign spreads meant that PEPP purchases decelerated quite quickly during the summer of 2020. From the start of 2021, the increase in the risk-free rate posed a challenge for the calibration of PEPP since, all else equal, a premature tightening in financing conditions posed a risk to medium-term inflation dynamics. In early 2021, the assessment that a significant proportion of the increase in the risk-free rate constituted a spillover from rising yields in the US market reinforced the case for leaning against the yield increase. Accordingly, there was a step up in the PEPP purchase pace during the second and third quarters of 2021.
However, as shown in the left panel of Chart 9, the narrowing of the pandemic inflation gap (which is the difference between the end-of-horizon projected inflation rate in the pre-pandemic December 2019 projections and the latest end-of-horizon projected inflation rate) acted as a countervailing force. While there was already a slight narrowing in the December 2020 projections (the end-of-horizon projected inflation rate increased from 1.3 per cent to 1.4 per cent), the improvements in the September 2021 and December 2021 projection rounds (to 1.5 per cent and 1.8 per cent respectively) warranted a more substantial reduction in the pace of purchases in the last quarter of 2021 and the first quarter of 2022.
Chart 9
Longer-term interest rates, the pandemic inflation gap and PEPP purchase amounts
(left panel: left-hand scale: EUR billions; right-hand scale: basis points; right panel: percentage per annum)
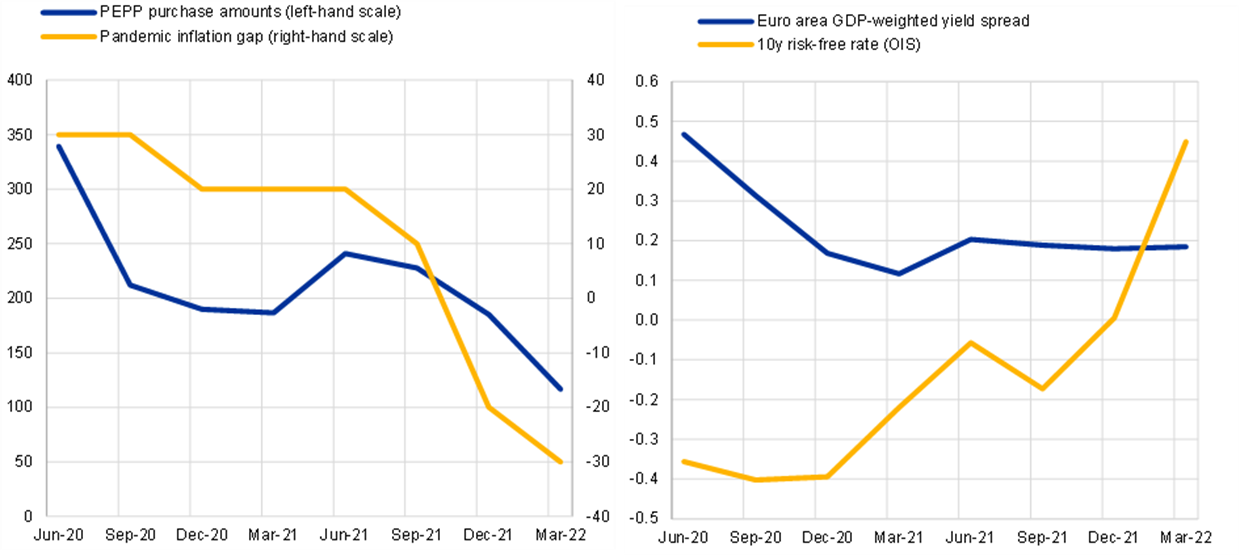
Notes: The pandemic inflation gap is defined the difference between the pre-pandemic forecast of 1.6 per cent and the end-of-horizon projection for each quarter. The end-of-horizon projection corresponds to the most ahead annual forecast of the Eurosystem staff macroeconomic projections. The 10y risk-free rate corresponds to the ten-year OIS rate. Yields and rates are averaged over the quarter.
The calibration of the TLTRO III programme in response to the pandemic has provided significant monetary accommodation in a manner that is designed to protect credit supply. In particular, an important innovation was to set the minimum borrowing rate at 50 basis points below the average interest rate on the deposit facility. This lowered funding costs for bank-intermediated credit, even without a generalised reduction in the main traditional policy rates. The remarkable expansion in the scale of TLTRO III operations, which have increased by about €2.2 trillion during the pandemic, is visible in Chart 1. ECB estimates indicate that TLTRO III liquidity can be expected to boost loan volumes considerably, to the tune of four percentage points cumulatively by 2022, and also contributed to a substantial lowering of lending rates to non-financial corporations. The euro area bank lending survey confirms that TLTRO funding has boosted loan generation and eased credit terms and conditions (Charts 10 and 11).
Chart 10
Use of TLTRO III liquidity by banks
(percentages of banks over the past and next six months)
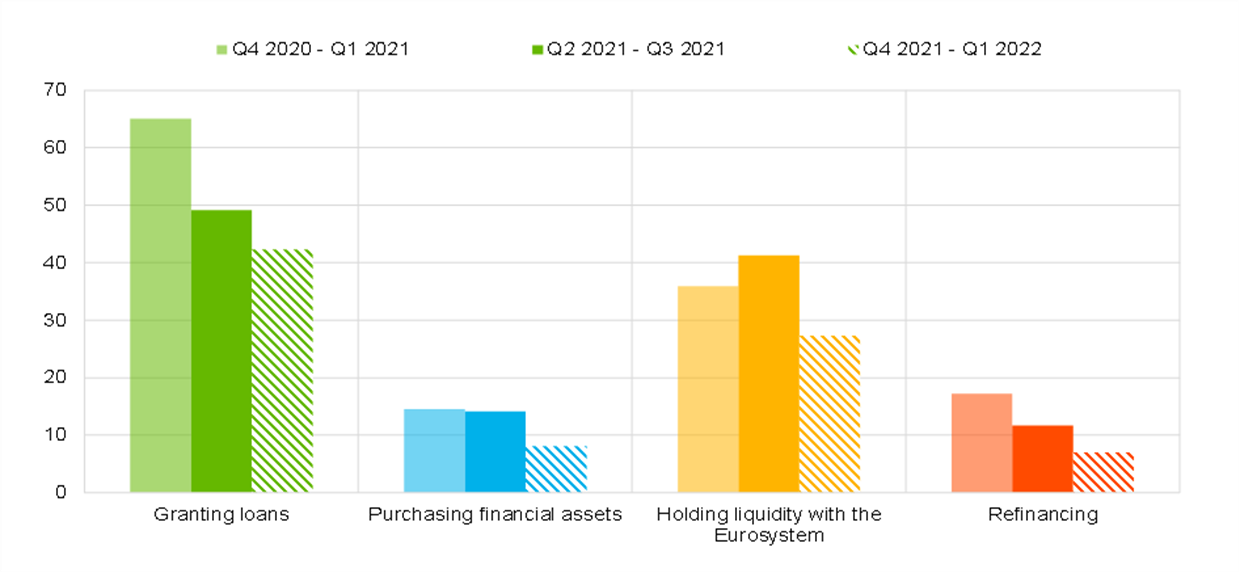
Source: Euro area bank lending survey (BLS).
Notes: Banks were asked to indicate the relevance of the different objectives, with multiple mentions possible. “Purchasing financial assets” is the average of “purchasing domestic sovereign bonds” and “purchasing other financial assets”. “Granting loans” refers to loans to the non-financial private sector. The last period denotes expectations indicated by banks in the October 2021 round of the BLS. The latest observations are for the third quarter of 2021.
Chart 11
Bank lending conditions and loan growth to firms and households
(left side: net percentages of banks reporting an easing (+)/tightening (-) of credit standards and an increase (+)/decrease (-) in loan demand; right side: percentages)
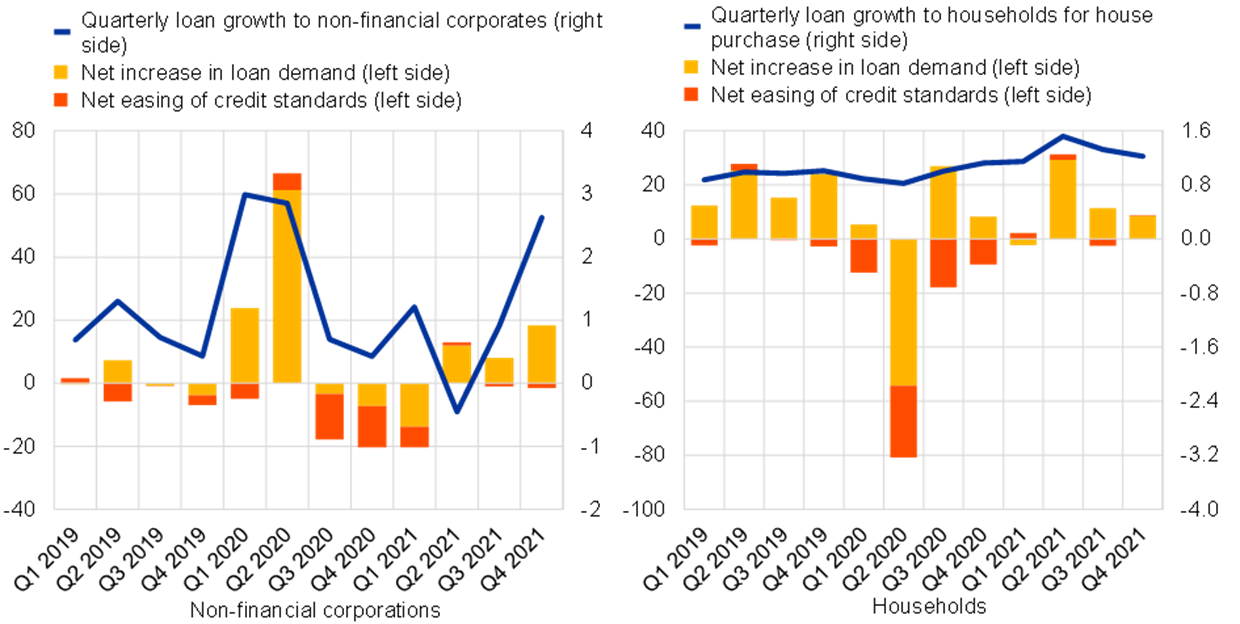
Sources: ECB (BLS and balance sheet items (BSI) statistics) and ECB calculations.
Notes: The BSI and BLS series on households refer to loans for house purchase. Loan growth is based on notional stocks. Loans are adjusted for seasonality and for sales, securitisation, and cash pooling activities. The latest observations are for the fourth quarter of 2021.
Chart 12 shows the time series of the average euro area lending rate, which incorporates the factors that banks consider when pricing a loan: the base rate (a term overnight interest swap rate), funding costs, credit risk and the cost of capital. It is apparent that, despite an increase in credit risk, the supportive conditions of the ECB funding have contributed to keeping the lending rate around the historically low levels it had reached before the pandemic crisis.
Chart 12
Lending rate to non-financial corporations and the intermediation wedge

Sources: ECB (MIR statistics) and Bloomberg.
Notes: The intermediation wedge is the distance from the base rate (three-year OIS) to the realised lending rate, as measured by the observed lending rate for non-financial corporations. The latest observations are for January 2022.
The impact of the pandemic monetary policy measures
To assess the contribution of monetary policy to countering the pandemic shock, a natural point of comparison is the calculation of the adverse impact that would have materialised in the absence of the monetary policy response. The alternative path the economy would have taken without responsive monetary policy can be calculated by constructing counterfactual financial conditions and then feeding these into macroeconomic models.
A first approach to calculating such counterfactual financial conditions is to employ pre-pandemic impact estimates of past monetary policy recalibrations in order to calculate by how much higher, for example, yields would have been absent monetary policy action. Averaging across a range of models, ECB staff analysis based on this approach indicates that, without our monetary policy measures, euro area output would be 1.8 percentage points lower and the annual inflation rate would be 1.2 percentage points lower by 2023 in cumulative terms.
Chart 13
Estimated impact of the ECB’s decisions since March 2020 on the central tendency of inflation and economic activity

Notes: The estimated impact across a suite of models refers to the average across a set of models used by the Eurosystem for policy simulations, a Bayesian vector autoregression model (Rostagno, M., Altavilla, C., Carboni, G., Lemke, W., Motto, R., and Saint Guilhem, A. (2021), “Combining negative rates, forward guidance and asset purchases: identification and impacts of the ECB’s unconventional policies”, Working Paper Series, No 2564, ECB), the NAWM-II model, and the ECB-BASE model.
However, these calculations are based on elasticities of financial conditions to policy impulses that are estimated based on data observed in non-stressed market conditions. This implies, in turn, that the impact estimates are typically moderate in size. It follows that this first approach to quantifying the effects of our policies is likely to underestimate by a wide margin their true effect under the macro-financial conditions generated by the extraordinary pandemic shock. This approach likely also understates the overall impact of monetary policy during the pandemic, since it does not take into account that fiscal policy would likely have been less countercyclical in the absence of favourable financing conditions.
More generally, in the macroeconomic models that central banks typically use for simulation and policy analysis, it is challenging to reflect the role of monetary policy measures in providing a credible backstop against adverse tail risks, such as an arrest in the flow of credit to the economy and acute financial instability. A more realistic assumption for constructing counterfactual financial conditions is to recognise that, in the event of policy inaction, financial markets – which were already highly destabilised – would have gone into a tailspin, sending the economy into a meltdown.
Building on recent advances in the macro-econometrics of estimating the impact of financial tail risks, preliminary results produced by ECB staff indicate that the ECB’s removal of the financial tail risk associated with the pandemic ensured a degree of support to growth that is several times larger than the impact derived by the more limited calculation shown in Chart 13. In particular, as Chart 14 shows, econometric analysis that quantifies the impact of a tightening in euro area financial conditions – not only on the mean of output growth but also on different parts of its empirical distribution through quantile regression – shows a negative impact on activity that is several times larger when the economy is experiencing headwinds than in a situation in which a tightening occurs during better economic times.
Chart 14
Impact of financial tightening on real GDP growth under different quantiles of the distributions

Source: ECB calculations.
Notes: The chart shows the impact of a one standard deviation increase in the euro area composite indicator of systemic stress (CISS) on the one-year ahead annual growth rate of euro area GDP, by GDP decile. The estimates are based on quantile regressions of the one-year ahead GDP growth rate on the CISS index. The estimation is carried out for the period January 1999 to December 2021, based on monthly observations. The shaded area is the 64% confidence interval for the estimates of the coefficients, while the linear model refers to the ordinary least squares estimate.
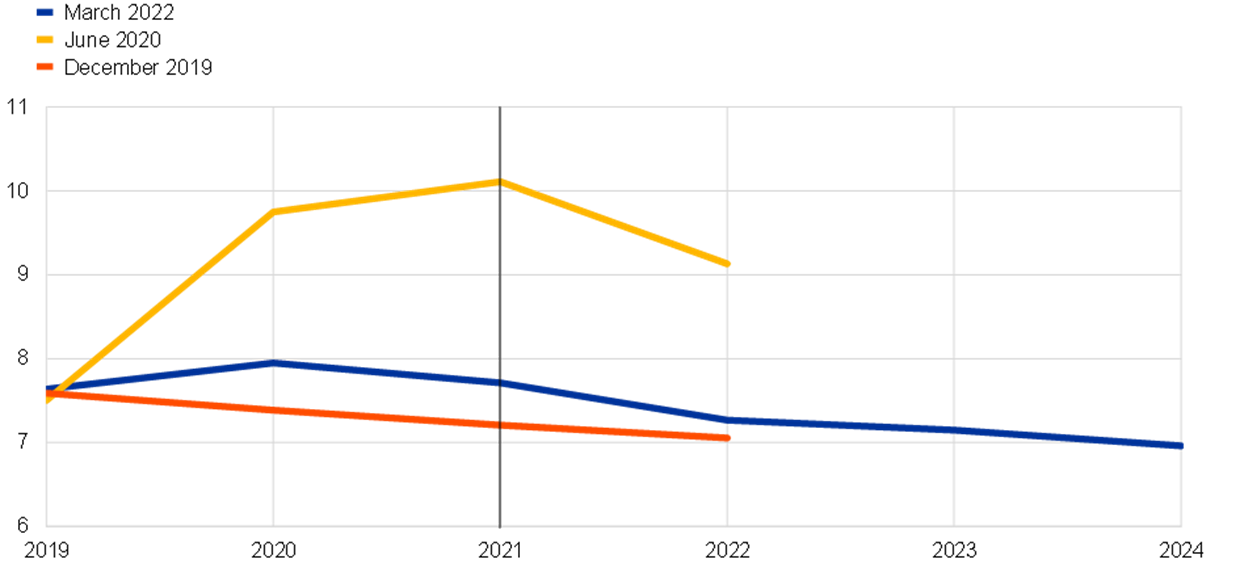
Chart 15 shows the evolution of the projected inflation path (as summarised by the end-of-horizon projected inflation rate). Over the period 2018-2019, the end-of horizon projections for inflation had gradually declined before the pandemic, such that the risk of downside de-anchoring was already elevated before the pandemic. The chart shows the sharp deterioration in the inflation outlook following the pandemic shock, with the end-of-horizon projection for HICP dropping to 1.3 per cent in the June 2020 forecast.
Chart 15
End-of-horizon projections for HICP inflation and HICP inflation excluding energy and food
(percentages per annum)

Sources: ECB/Eurosystem staff macroeconomic projections and ECB calculations. |
The medium-term inflation outlook substantially recovered from mid-2021 onwards, following the successful development of vaccinations and the reopening of the economy – some pandemic-induced volatility notwithstanding – that generated a forceful rebound in activity over the course of the year. Important milestones were the upgrade to an end-of-horizon inflation forecast of 1.4 percent in June to 1.5 percent in September 2021, a large step to 1.8 percent in the December 2021 round, and the further increase to 1.9 percent in March 2022. The improvement in the inflation outlook in the second half of 2021 resulted in the December 2021 assessment that the stance objective of the PEPP – to counter the negative pandemic shock to the path of inflation – was fulfilled.
In making monetary policy decisions, the Governing Council systematically assesses the proportionality of its measures, as we also emphasised in the outcome of our monetary policy strategy review last July.[8] This assessment includes an analysis of the benefits and the possible side effects of monetary policy measures, their interaction and their balance over time. The assessment of the benefits applies to the transmission to financing conditions as well as to the intended effect on inflation, while the assessment of possible side effects relates to unintended effects on the real economy and on the financial system.
With regard to households, by putting downward pressure on longer-term interest rates, asset purchases tend to lower longer-term interest rates for private borrowers and savers. Beyond these direct effects, the contribution of asset purchases to more benign macroeconomic conditions overall supports household incomes, through higher employment, growing wages and positive wealth effects.[9] Distributional implications are also routinely tracked, and the assessment is that monetary policy measures, including asset purchase programmes contribute to a reduction in income inequality through positive employment and wage effects, while their implications for wealth inequality can be mixed, as asset holdings tend to exhibit heterogeneity.[10]
For corporates, the protection of favourable financing conditions likely contributed to the survival of many firms that would otherwise have been forced to shut down towing to the catastrophic loss of revenues during the pandemic. Low bond rates and banking rates, together with supportive credit terms and conditions, played a direct role in underpinning the survival of many firms. Yet more powerful was the indirect role by which favourable financing conditions enabled large-scale fiscal borrowing that in turn enabled governments to provide an array of subsidies and credit guarantees to firms. While favourable financing conditions and fiscal subsidies might have kept alive some zombie firms, the return to pre-pandemic GDP levels by the end of 2021 suggests that a comprehensive approach to supporting firm survival was broadly appropriate.
In assessing the implications of our monetary policy for the conduct of fiscal policy, it is essential to recognise that fiscal policy has been front and centre in averting the propagation of the economic fallout from the pandemic, as it is especially well-suited to provide targeted economic support. Fiscal policy also plays an important role as driver of aggregate demand, where the positive contribution from fiscal policy to demand marks an important contrast to the contractionary stance adopted in the wake of the global financial crisis. The pandemic experience thus serves to demonstrate that in response to a severe shock, simultaneous and ambitious policy actions by governments and central banks working in the same direction – within their respective responsibilities and mandates – can effectively complement each other. At the same time, the overriding mandate conferred on us by the Treaty to maintain price stability is unambiguous and the ECB remains undeterred in the pursuit of this mandate.
In relation to the banking system, it is estimated that the net impact of the APP and PEPP on bank profitability has been overall broadly neutral. On the one side, as reported in the October 2021 bank lending survey, the ECB’s asset purchases (and, even more so, the negative deposit facility rate) were assessed by many banks as exerting a negative impact on their profitability through a negative impact on their net interest income, while capital gains had a positive net impact. On the other side, a high percentage of banks reported that the ECB’s two-tier system for remunerating excess liquidity holdings supported bank profitability, mainly related to a positive impact on net interest income, offsetting some of the pressure associated with the excess liquidity generated by asset purchases.
However, a comprehensive assessment of the impact on the banking system must take into account that supportive monetary policies during the pandemic improved the macroeconomic outlook. Through this positive macroeconomic channel, stronger credit volumes and lower credit risk boosted bank profitability. The macroeconomic channel was likely especially powerful during the pandemic. In particular, a failure to stabilise the financial system or resist the considerable downward pressure on the projected inflation path in the initial stages of the pandemic could have given rise to considerably worse macroeconomic performance, falling asset prices and rising credit losses. On net, even allowing for the negative impact on net interest margins, the beneficial macroeconomic impact suggests an overall positive assessment of the impact of monetary policy during the pandemic on the health of the banking system.
In terms of the effects of asset purchases on market functioning, on balance, the effect of the purchase programmes on market liquidity and price formation, has been positive. Importantly, there is no evidence of a systematic negative impact on liquidity in euro area sovereign bond markets and price formation in these markets has remained intact. In particular, purchases have supported market functioning in times of severe stress, such as during the outbreak of the Covid-19 crisis early 2020. At the same time, liquidity conditions do warrant continued monitoring since purchases may at times have reduced liquidity in some smaller market segments, which has, however, been mitigated by precautionary measures such as the securities lending scheme.
Finally, twice a year the Governing Council assesses in-depth the interrelation between monetary policy and financial stability, in line with our new monetary policy strategy. The December 2021 assessment concluded that an accommodative monetary policy has underpinned growth, which supports the balance sheets of companies and financial institutions, as well as preventing risks of market fragmentation. At the same time, the impact of accommodative monetary policy on property markets and financial markets warrants close monitoring as a number of medium-term vulnerabilities have intensified. Still, macroprudential policy remains the first line of defence in preserving financial stability and addressing medium-term vulnerabilities.
From the pandemic challenge to the present
In recent months, the improvement in the medium-term inflation outlook has been overshadowed by the surge in the spot inflation rate (Chart 16). For the euro area, the current high inflation rates reflect to a large extent a very substantial surge in energy prices in recent months and a pandemic cycle that has generated global bottlenecks for manufactured goods over the last year. These are factors that act to raise the price level but, conditional on the appropriate conduct of monetary policy, should not be a source of persistent inflation.
Chart 16
Headline and core inflation in the euro area
(annual percentage changes)
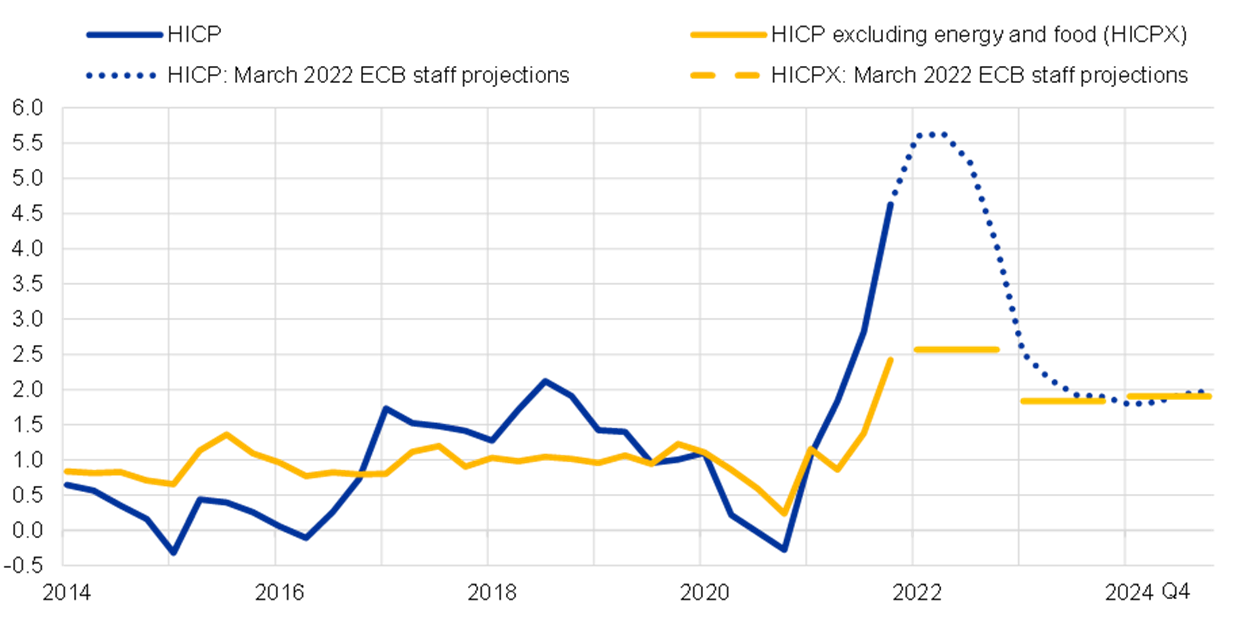
Sources: Eurostat, ECB calculations and March 2022 ECB staff macroeconomic projections.
Notes: Historical data are at monthly frequency. Forecast data are at quarterly frequency for HICP and annual frequency for HICPX. The forecast starts in the first quarter of 2022. The latest observations are for February 2022.
The energy price shock, with energy prices 30 per cent higher in February 2022 compared to February 2021, is the main driver of the high inflation rate, both through the direct contribution of energy to the overall price index and its indirect impact on costs across all sectors of the economy. However, even if energy prices, which historically have exhibited a considerable degree of short-term mean reversion, were to remain close to current levels, the level shift on inflation mechanically falls out of the inflation calculation over time. Similarly, the relative price dislocations associated with bottlenecks – demand-supply mismatches – should fade as extra supply becomes available and sectoral demand surges normalise.[11]
In analysing the current high inflation rate, the surge in energy prices constitutes an adverse terms of trade shock for the euro area, which imports more than 90 per cent of its energy inputs. In addition, the bottlenecks in global supply chains are primarily external in nature rather than reflecting an overheating of domestic demand in the euro area. Chart 17 illustrates this for the trade balance. Whereas the euro area goods trade balance generally registered a surplus of around two per cent before the pandemic, the goods trade balance has gradually deteriorated over 2021. This deterioration reflects the steady worsening of the energy and food trade balance, which was largely driven by the rising bill for energy imports. By the same token, the euro area terms of trade have declined during 2021 (Chart 18).[12] Higher import prices for energy reduce the disposable incomes of households and the cash flows of energy-intensive firms. The impact of this terms of trade shock on euro area macroeconomic dynamics will warrant close monitoring in the coming quarters.
Chart 17
(percentage of GDP)
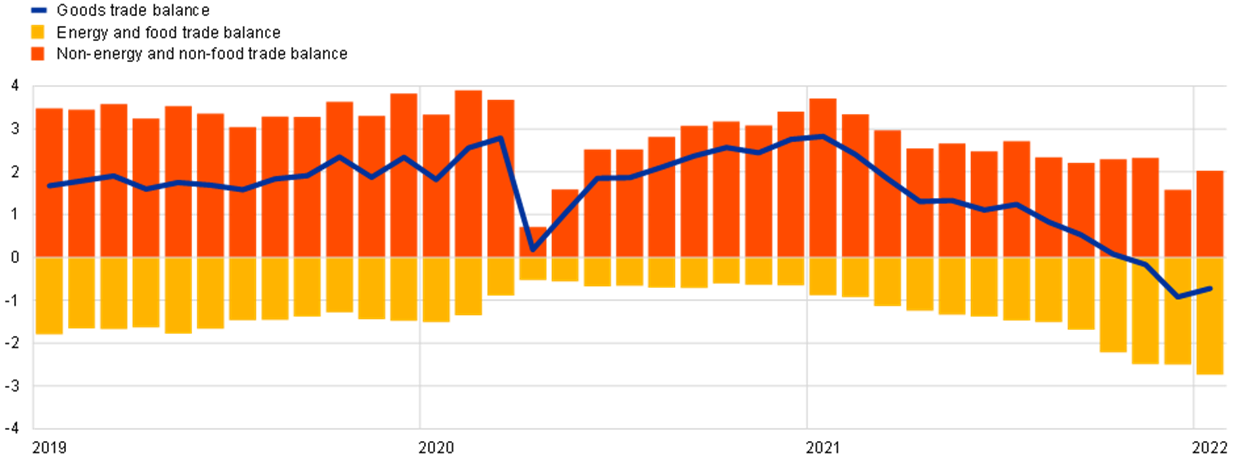
Sources: Eurostat and ECB calculations.
Notes: The value for GDP in the first quarter of 2022 is forecasted. The latest observations are for January 2022.
Chart 18
Euro area terms of trade
(quarterly percentage point impact in terms of annual GDP growth)
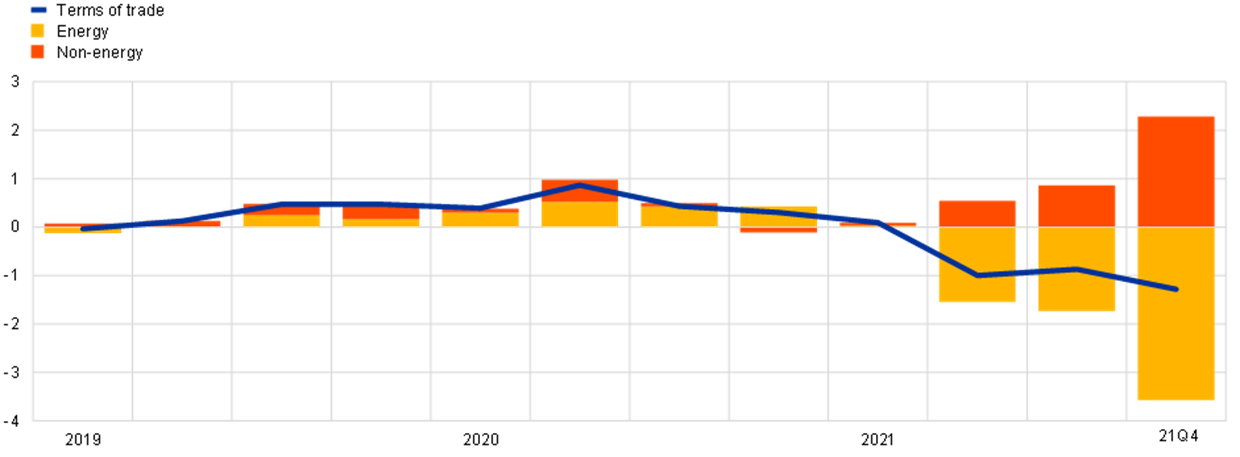
Sources: Eurostat and ECB calculations.
Notes: The income effect of terms of trade is calculated by weighing export and import price changes by their respective values and considered as a percentage share of GDP. The latest observations are for the fourth quarter of 2021.
The above-trend current readings for core inflation reflect to a significant extent the indirect effects of high energy prices and also global bottlenecks, with every sector hit by the energy shock. Chart 19 shows that around 70 basis points of core inflation can be accounted for by the energy shock. Charts 20 and 21 show that both non-energy industrial goods (NEIG) inflation and services inflation have been significantly affected by the oil price shock, with the bottleneck effects proxied by the PMI supply indicator also leaving a visible mark on NEIG inflation.
Chart 19
Impact of oil price changes on HICP excluding energy and food
(percentage points)
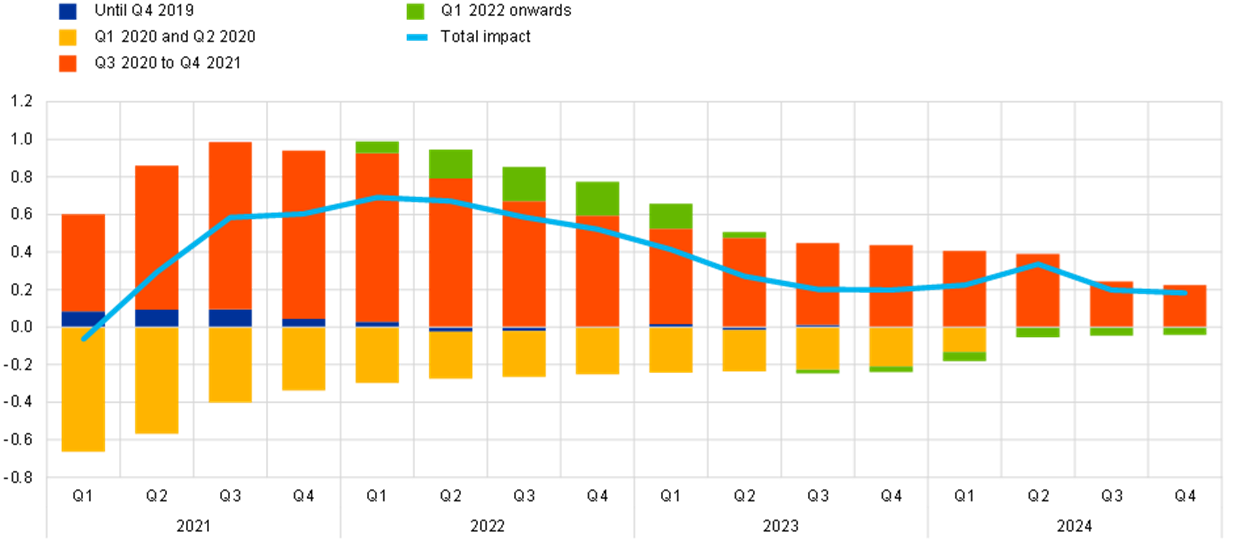
Sources: ECB and ECB staff calculations.
Note: Impact computed using basic model elasticities of the forecasting models used in the Eurosystem national central banks.
Chart 20
Decomposition of NEIG inflation
(annual percentage changes and percentage point contributions)
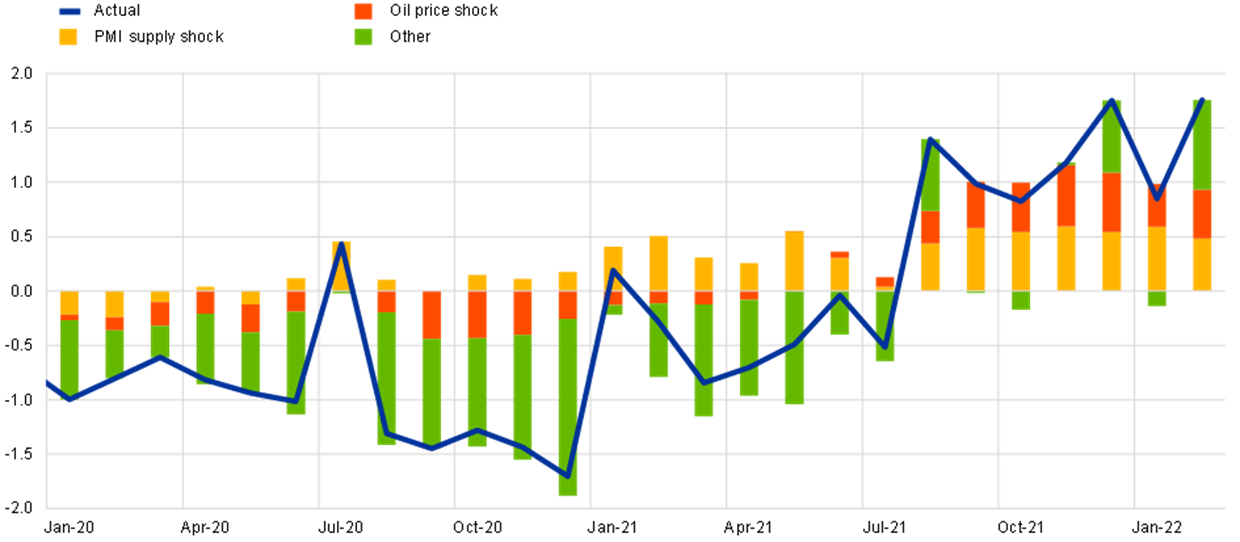
Sources: Eurostat, NIPE and ECB staff calculations.
Notes: All series are de-meaned. Historical decompositions are based on a vector autoregression including a bottleneck proxy, oil prices, HICP NEIG, producer prices, industrial production, and export and import volumes. The bottleneck and oil price shock are identified using short-run restrictions averaged across all possible orderings of the bottleneck and oil price series. As a bottleneck proxy, a PMI supply shock is estimated from a separate vector autoregression including PMI output and supply delivery times and identified via sign restrictions. Gas prices are not explicitly included in the model, but oil prices are highly correlated with gas prices and thus capture a major part of the energy shock. The latest observations are for February 2022.
Chart 21
Decomposition of services inflation
(percentage points)

Sources: Eurostat and ECB staff calculations.
Notes: Decomposed with non-constant weights. The column on the left shows the average contributions. The latest observations are for February 2022.
In comparing inflation dynamics across regions, Chart 22 shows that the increase in core inflation has been much higher in the United States relative to the euro area. Two basic factors behind this are the larger contribution from supply bottlenecks to inflation and the higher levels of domestic demand in the United States, which is shown in Chart 23.
Chart 22
Inflation excluding food and energy: euro area (left) vs. United States (right)
(annual percentage changess)
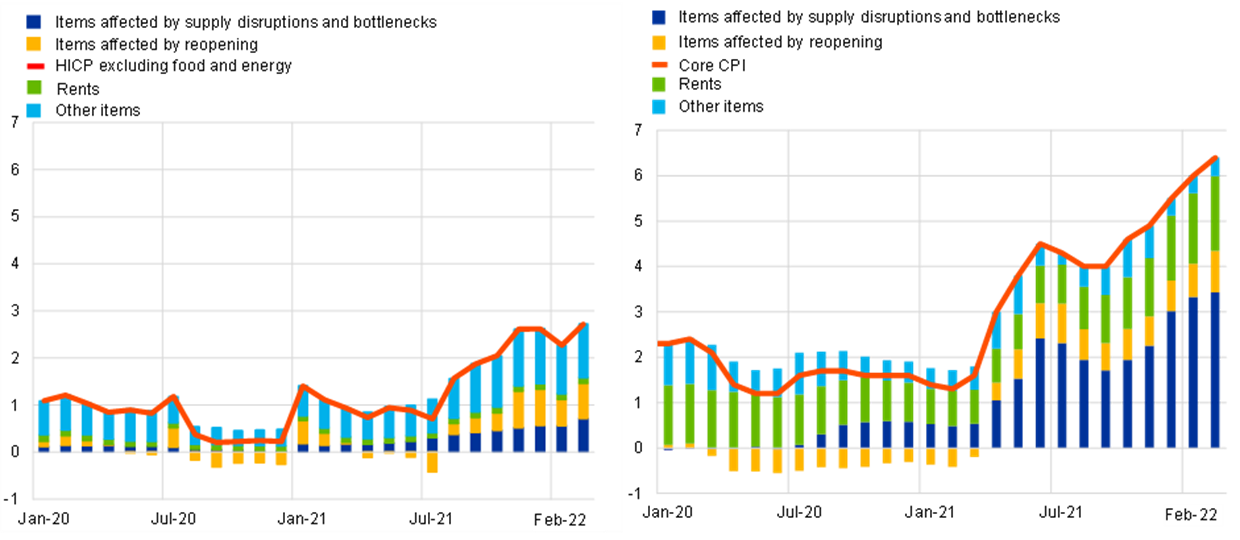
Sources: Eurostat, Haver and ECB staff calculations.
Notes: For the euro area, the panel shows the HICP excluding food and energy, as well as the contributions to it. For the United States the panel shows the CPI excluding food and energy, as well as the contributions to it. Items affected by bottlenecks include new motor cars, second-hand motor cars, spare parts and accessories for personal transport equipment, and furnishings and household equipment. Items affected by reopening include clothing and footwear, recreation and culture, recreation services, hotels and motels, and domestic and international flights. Rents include actual rents paid by tenants, and for the United States also imputed rents for owner-occupied housing. The latest observations are for February 2022 for core CPI and the contributions in the United States and HICP excluding food and energy in the euro area, otherwise January 2022.
Chart 23
Real consumption expenditure: euro area (left) vs. United States (right)
(left side index: Q4 2019=100; right side: index: December 2019=100)
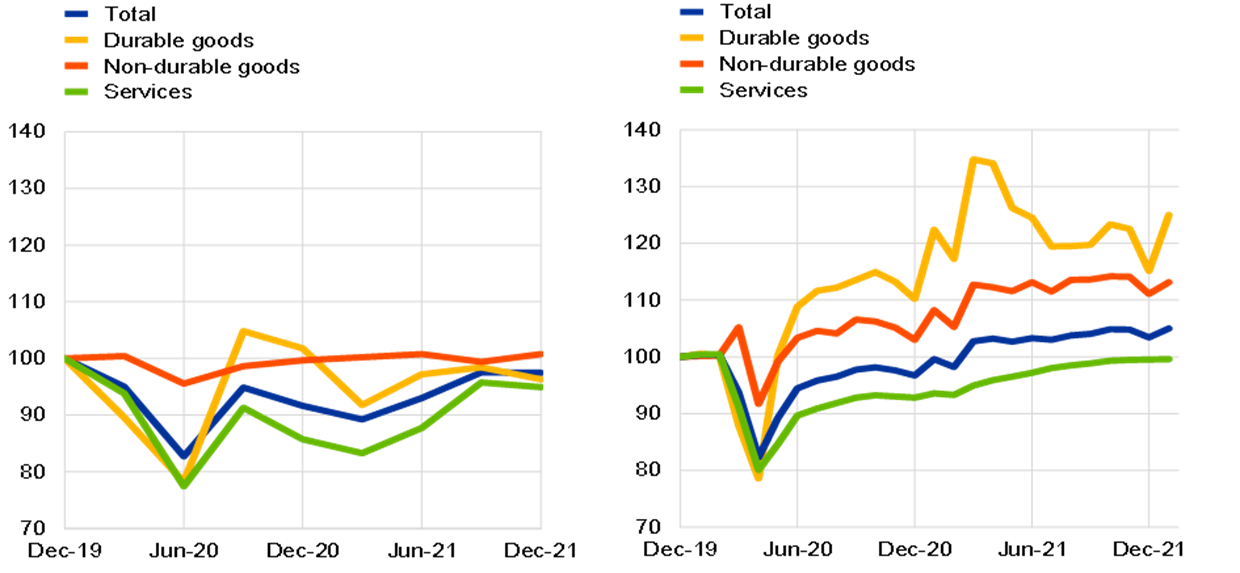
Sources: Eurostat and ECB staff calculations for the euro area; US Bureau of Labor Statistics and ECB staff calculations for the United States.
While the supply shock nature of the contributions from energy prices and global bottlenecks means that inflation should not be expected to persist at the current high levels, it is also plausible that medium-term inflation will not revert to the pre-pandemic below-target equilibrium but, conditional on appropriately-calibrated monetary policy, rather may stabilise around the ECB’s two per cent target.
This conjecture is supported by two basic underlying trends. First, there has been a considerable revision in inflation expectations over the last year. The anchoring of inflation expectations is a first order issue, since a persistent shift in inflation expectations can play a significant role in determining medium-term inflation dynamics. Surveys are signalling a recovery of longer-term inflation expectations that is consistent with inflation settling at our two per cent target over the medium term. In the ECB’s Survey of Monetary Analysts, the modal value in the most recent round stands at around two per cent (Chart 24). In addition, while survey participants unanimously expect inflation to remain above two per cent this year, the distribution of those expecting inflation to stand at above two per cent and below two per cent is fairly balanced in 2023 and 2024. Similarly, in the Survey of Professional Forecasters the mode for longer-term inflation expectations has also materially shifted from 1.6 per cent to 2.0 per cent, although it is notable that the mass of below-target inflation remains higher than above-target inflation (Chart 25). Market-based indicators of inflation compensation also show a significant shift: model-based analysis suggest that the expectations component for inflation has moved closer to the two per cent target, while model analysis largely attributes the recent spikes in measures such as the 5y5y inflation-linked swaps to the pricing of inflation risk premia (Chart 26).
What might explain this revision in inflation expectations? At one level, the success of monetary and fiscal policies in countering the pandemic shock may have led to greater optimism that excessively-low inflation episodes would not be tolerated by policymakers. The policy commitment to resist below-target inflation was also reinforced by publication of the ECB’s new monetary policy strategy statement in July 2021, which articulated our determination to deliver our symmetric two per cent inflation target, including through forceful or persistent policy measures in the neighbourhood of the effective lower bound. More recently, the surge in inflation since autumn 2021 also has potentially acted as a circuit breaker in terms of the setting of inflation expectations by overturning the pre-pandemic narrative that an array of structural forces would permanently keep inflation at a low level.
While a re-anchoring of longer-term inflation expectations around the two per cent target rate acts as a stabilising force and reinforces the credibility of the inflation target, complacency should be avoided. In particular, the current prolonged phase of spot inflation rates far above the target might lead some types of economic actors to make further upward revisions to their near-term and medium-term inflation expectations. Accordingly, it is essential for the ECB to monitor closely a wide array of indicators of inflation expectations and to ensure that its commitment to delivering two per cent inflation over the medium term is understood by the full spectrum of economic actors.
Chart 24
Inflation expectations in the Survey of Monetary Analysts
(left: pooled probability distribution; right: average probability)
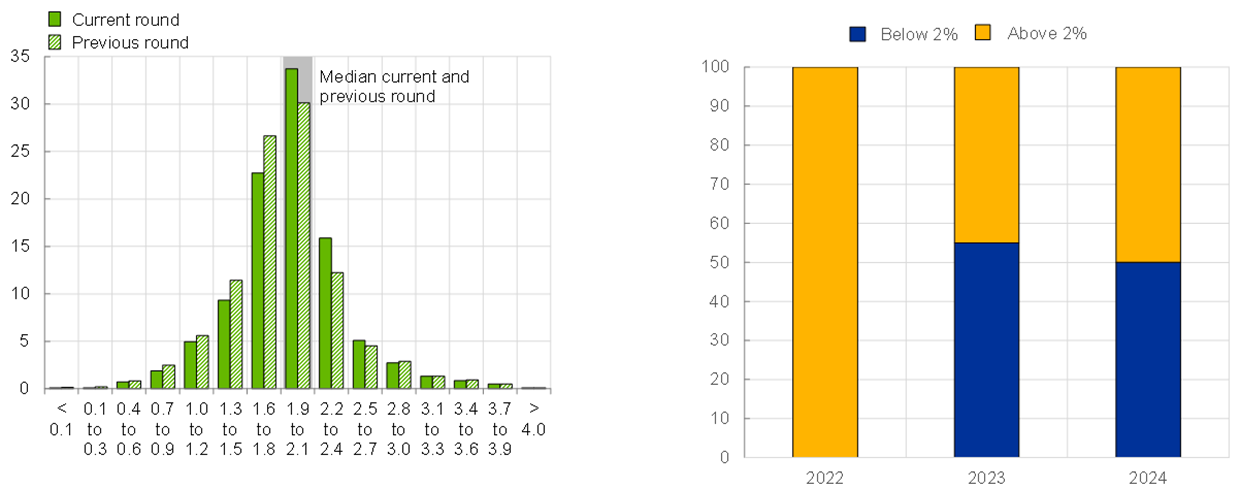
Sources: March 2022 Survey of Monetary Analysts (SMA) and February 2022 SMA.
Notes: Left side – maximum number of respondents is 23 for March 2022 SMA and 22 for February 2022 SMA. Grey area denotes the median. Right side – number of respondents for March 2022 SMA is 21.
Chart 25
Euro area long-term HICP inflation expectations: Survey of Professional Forecasters
(x-axis: annual percentage changes; y-axis: percentages of respondents)
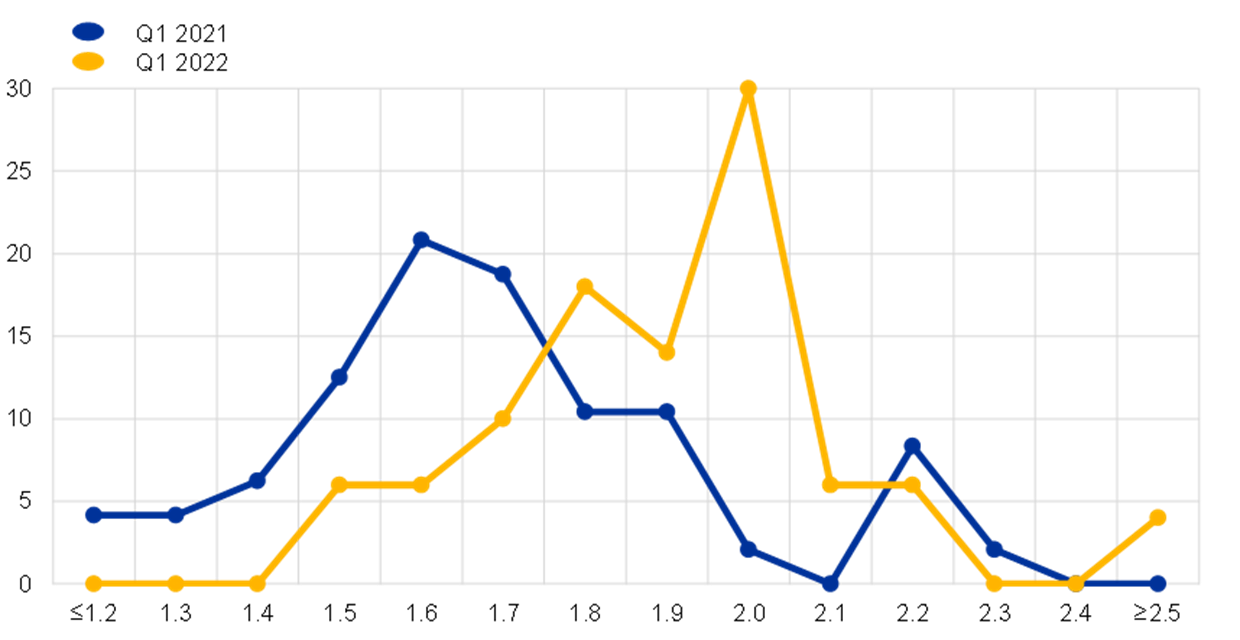
Source: ECB Survey of Professional Forecasters.
Notes: Respondents are asked to report their point forecasts and to separately assign probabilities to different ranges of outcomes. This chart shows the distribution of point forecast responses.
Chart 26
Euro area 5y5y inflation-linked swap rate
(percentages per annum)
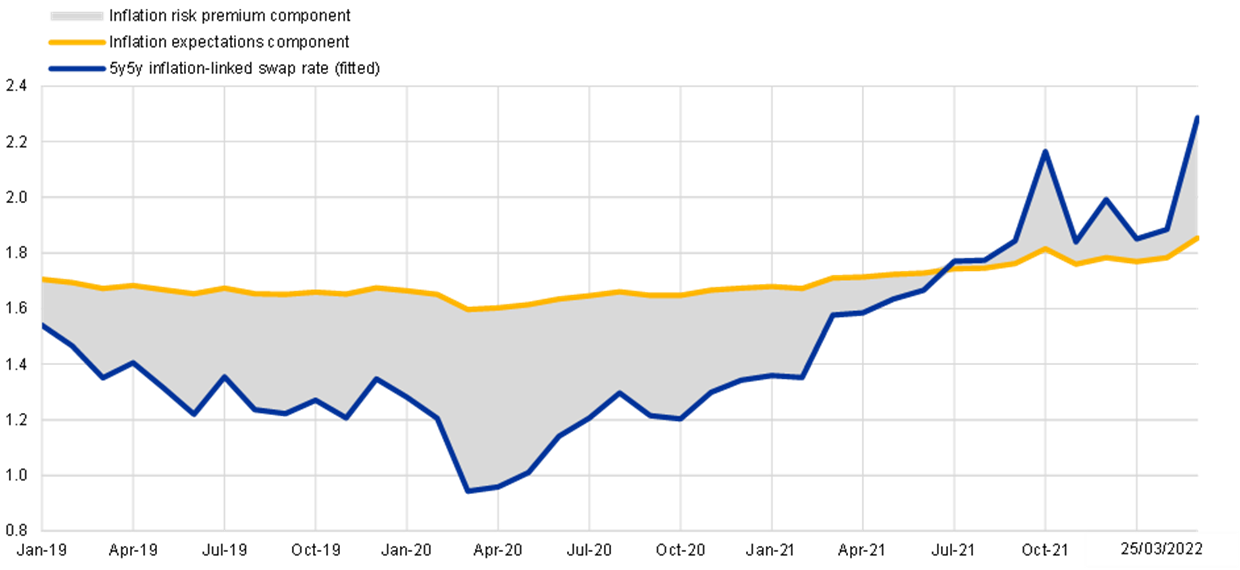
Sources: Refinitiv and ECB calculations.
Notes: Average estimates based on two affine term structure models following Joslin, Singleton and Zhu (2011) applied to ILS rates adjusted for the indexation lag (monthly data), as in Camba-Mendez and Werner (2017); see Burban, V. et al. (2021), “Decomposing market-based measures of inflation compensation into inflation expectations and risk premia”, Economic Bulletin, Issue 8, ECB. The latest observations are for 25 March 2022.
The second factor that can underpin the anchoring of longer-term inflation expectations at the two per cent target is the re-assessment of the labour market. As shown in Chart 27, a supportive macroeconomic environment and targeted labour market policies resulted in the labour market performing much stronger than had been expected during the pandemic, limiting the risk of long-term scarring effects. The latest ECB staff macroeconomic projections foresee a substantial further decline of the euro area unemployment rate over 2022-2024 to levels not seen in decades.
Chart 27
Unemployment rate in ECB/Eurosystem staff macroeconomic projections
(percentages of labour force)
Sources: ECB/Eurosystem staff macroeconomic projections.
The step-by-step adjustment in monetary policy
Against this background, the Governing Council sees it as increasingly likely that inflation will stabilise at our two per cent target over the medium term. Under this pathway, the degree of monetary policy stimulus put in place to address the pre-pandemic challenge of persistent below-target inflation can be normalised in a gradual fashion towards a more neutral setting.
At its December 2021 meeting, the Governing Council judged that the progress on economic recovery and towards the medium-term inflation target permitted a step-by-step reduction in the pace of our asset purchases over the coming quarters and the end of net purchases under the PEPP at the end of March.
Subsequently, at the March 2022 meeting, the new inflation landscape warranted a further scaling back of the profile of APP purchases. Accordingly, monthly net purchases will amount to €40 billion in April, €30 billion in May and €20 billion in June. The calibration of net purchases for the third quarter will be data-dependent and reflect our evolving assessment of the outlook. If the incoming data support the expectation that the medium-term inflation outlook will not weaken even after the end of our net asset purchases, the Governing Council will conclude net purchases under the APP in the third quarter. If the medium-term inflation outlook changes and if financing conditions become inconsistent with further progress towards our two per cent target, we stand ready to revise our schedule for net asset purchases in terms of size and/or duration.
At the same time, the Governing Council revised its forward guidance on interest rates to signal that any adjustments to the key ECB interest rates will take place “some time after” the end of our net purchases under the APP. This formulation disentangles the calendar for a rate hike from the end date for net purchases and gives some extra space to test the conditions after we stop purchasing bonds and before we take the next step towards normalisation. The expression “some time” also conveys that, especially in an uncertain environment, the time interval between the end of net asset purchases and lift-off is not predetermined but will depend on the timeline for the fulfilment of our rate forward guidance criteria and the appropriate incorporation of prevailing economic, financial and market conditions in our interest rate decisions.
This new formulation clearly enhances the Governing Council’s flexibility and optionality as it helps to manage in a more agile manner the specific steps regarding the implementation of the sequence of normalisation decisions, allowing us to attune such steps to incoming data. Moreover, the Governing Council reconfirmed that the path for our policy rates will continue to be determined by our forward guidance and by our strategic commitment to stabilise inflation at two per cent over the medium term, and we also signalled that any adjustments to our interest rates will be gradual, which is especially important in times of uncertainty.
More than ever, it is important to maintain optionality in the conduct of monetary policy. In current conditions, it is especially important to remain data-dependent and for optionality to be two-sided. On the one side, we should ensure that our policy settings are adjusted if de-anchored inflation expectations, an intensification in catch-up wage dynamics or a persistent deterioration in supply capacity threaten to keep inflation above target in the medium term. On the other side, we should also be fully prepared to appropriately revise our monetary policy settings if the energy price shock and the Russia-Ukraine war were to result in a significant deterioration in macroeconomic prospects and thereby weaken the medium-term inflation outlook.
Conclusions
My overall assessment is that the monetary policy response of the ECB to the pandemic has been a success. Our ECB policy package (PEPP, revised TLTRO III, collateral easing and supervisory measures) preserved favourable financing conditions and enabled the large-scale fiscal response that was crucial to mitigating the economic and financial impact of the pandemic on households and firms. In particular, the PEPP has been a proportionate, well-designed and necessary asset purchase programme that fulfilled its dual role of stabilising financial markets and reversing the initial adverse impact of the pandemic on the projected inflation path.
As recently emphasised by President Lagarde, flexibility is a special principle for conducting monetary policy in a monetary union, as we must continually focus on ensuring that policy is transmitted evenly to all parts of the euro area.[13] With diverging initial conditions, exogenous shocks can affect economies asymmetrically. If this leads to financial fragmentation, the transmission of monetary policy can be disrupted.
The pandemic was a particularly extreme exogenous shock and the PEPP has shown that, under stressed conditions, flexibility in the design and conduct of asset purchases has helped to counter the impaired transmission of monetary policy and made the Governing Council’s efforts to achieve its goal more effective. Within the Governing Council’s mandate, under stressed conditions, flexibility will remain an element of monetary policy whenever threats to monetary policy transmission jeopardise the attainment of price stability. This means that we are ready to use a wide range of instruments to address fragmentation.
One application of the flexibility principle relates to the reinvestment of the PEPP portfolio. In particular, in the event of renewed market fragmentation related to the pandemic, PEPP reinvestments can be adjusted flexibly across time, asset classes and jurisdictions at any time. This could include purchasing bonds issued by the Hellenic Republic over and above rollovers of redemptions in order to avoid an interruption of purchases in that jurisdiction, which could impair the transmission of monetary policy to the Greek economy while it is still recovering from the fallout from the pandemic. Net purchases under the PEPP could also be resumed, if necessary, to counter negative shocks related to the pandemic. Another application of the flexibility principle during the pandemic took the form of a set of collateral easing measures. In providing a timeline for the gradual phasing out of these measures, the Governing Council last week also noted that it “reserves the right to deviate also in the future from credit rating agencies’ ratings if warranted, in line with its discretion under the monetary policy framework, thereby avoiding mechanistic reliance on these ratings.” More generally, as noted by President Lagarde in her recent speech, the flexibility principle means that we are ready to deploy a wide range of instruments to address fragmentation.
These remarks draw on Lane, P.R. (2021), “The monetary policy response in the euro area”, in English, B., Forbes, K. and Ubide, A. (eds.), “Monetary Policy and Central Banking in the Covid Era”, CEPR Press, as well as Lane, P.R. (2022), “The Monetary Policy Strategy of the European Central Bank”, Special Issue of Revue d’Économie Financière: New Doctrines in Central Banking; Lane P.R. (2022), “The monetary policy strategy of the ECB: the playbook for monetary policy decisions”, speech at the Hertie School, Berlin, 2 March; Lane, P.R. (2020), “The monetary policy package: an analytical framework”, The ECB Blog, 13 March; Lane, P.R. (2020), “Understanding the pandemic emergency purchase programme”, The ECB Blog, 22 June; Lane, P.R. (2020), “The pandemic emergency: the three challenges for the ECB”, speech at the Jackson Hole Economic Policy Symposium, Federal Reserve Bank of Kansas City “Navigating the Decade Ahead: Implications for Monetary Policy”, 27 August; Lane, P.R. (2021), “The compass of monetary policy: favourable financing conditions”, speech at Comissão do Mercado de Valores Mobiliários, 25 February; Lane, P.R. (2021), “Inflation Dynamics During a Pandemic”, The ECB Blog, 1 April; Lane, P.R. (2021), “The Resilience of the Euro”, Journal of Economic Perspectives, Vol. 35, No 2, pp. 3-22.
From September 2019 to March 2022 the APP net asset purchase time horizon was linked to the future tightening of the key policy rates, being expected to run for as long as necessary to reinforce the accommodative impact of the policy rates, and to end shortly before the start of raising the key ECB interest rates. Furthermore, reinvestment, in full, of the principal payments from maturing securities purchased under the APP will be continued for an extended period of time past the date when the ECB starts to increase interest rates, and in any case for as long as necessary to maintain favourable liquidity conditions and an ample degree of monetary accommodation.
The September 2019 formulation put this in terms of the expectation to keep policy rates at their current or lower levels until the Governing Council has seen the inflation outlook robustly converge to its inflation aim within the projection horizon, and such convergence has been consistently reflected in underlying inflation dynamics. The Governing Council updated its forward guidance in July 2021 upon the conclusion of its monetary policy strategy review, to account for two innovations: first, the redefinition of the ECB’s price stability objective as a symmetric two per cent inflation target over the medium term; and, second, a conditional commitment to take into account the implications of the effective lower bound when conducting policy in an environment of structurally-low nominal interest rates. Since then, the forward guidance comprises three key conditions: “In support of its symmetric two per cent inflation target and in line with its monetary policy strategy, the Governing Council expects the key ECB interest rates to remain at their present or lower levels until it sees inflation reaching two per cent well ahead of the end of its projection horizon and durably for the rest of the projection horizon, and it judges that realised progress in underlying inflation is sufficiently advanced to be consistent with inflation stabilising at two per cent over the medium term. This may also imply a transitory period in which inflation is moderately above target.”
See Lane, P.R. (2020), “The macroeconomic impact of the pandemic and the policy response”, The ECB Blog, 4 August and Lane, P.R. (2020), “The market stabilisation role of the pandemic emergency purchase programme”, The ECB Blog, 22 June.
See also Lane, P.R. (2021), “The compass of monetary policy: favourable financing conditions”, Speech at Comissão do Mercado de Valores Mobiliários, 25 February.
For a more detailed discussion of the market stabilisation role of the PEPP, see Lane, P.R. (2020), “The market stabilisation role of the pandemic emergency purchase programme”, The ECB Blog, 22 June.
Lane, P.R. (2021), “The Resilience of the Euro”, Journal of Economic Perspectives, Vol. 35, No 2, pp. 3-22.
My colleague Frank Elderson discussed the role of the proportionality assessment in a speech last week. See Elderson, F. (2022), “Proportioning policy action to the evidence: making the monetary policy strategy of the ECB concrete”, speech at the Institute of International & European Affairs webinar, Frankfurt am Main, 24 March.
The individual effect of the APP can only be distinguished from the effects of other monetary policy measures implemented over the same period by means of econometric models. See Dossche M., Hartwig J. and Pierluigi, B. (2021), “The impact of the PSPP and negative interest rate policy on savers and borrowers”, in Rostagno, M. et al., Monetary Policy in Times of Crisis: A Tale of Two Decades of the European Central Bank, Oxford University Press, Oxford. See also Lenza M. and Slacalek, J. (2018), “How does monetary policy affect income and wealth inequality? Evidence from quantitative easing in the euro area”, Working Paper Series, No 2190, ECB, Frankfurt am Main, October; Slacalek, J., Tristani, O., and Violante, G.L. (2020), “Household balance sheet channels of monetary policy: A back of the envelope calculation for the euro area”, Journal of Economic Dynamics and Control, Vol. 115; Christelis, D., Georgarakos, D., Jappelli, T., Pistaferri, L. and Van Rooij, M. (2020), “Heterogeneous Wealth Effects”, CEPR Discussion Papers, No 14453, Centre for Economic Policy Research, February; Paz-Pardo G. (2021), “Homeownership and portfolio choice over the generations”, Working Paper Series, No 2522, ECB, February; Moll, B. (forthcoming), “Comment on Hubmer, Krusell and Smith (2020), ‘Sources of U.S. Wealth Inequality: Past, Present, and Future’”, NBER Macroeconomics Annual; and Greenwald D.L., Leombroni L., Lustig H. and Van Nieuwerburgh, S. (2021), “Financial and Total Wealth Inequality with Declining Interest Rates”, NBER Working Paper Series, No 28613.
See Dossche, M., Slacalek, J. and Wolswijk, G. (2021), “Monetary policy and inequality”, Economic Bulletin, Issue 2, ECB; Section 3.5.2 of Altavilla, C., Lemke, W., Linzert, T., Tapking, J. and von Landesberger, J. (2021), “Assessing the efficacy, efficiency and potential side effects of the ECB’s monetary policy instruments since 2014”, Occasional Paper Series, No 278, ECB; and Work stream on employment (2021), “Employment and the conduct of monetary policy in the euro area”, Occasional Paper Series, No 275, ECB.
Lane, P.R. (2022), “Bottlenecks and monetary policy”, The ECB Blog, 10 February.
The rising prices of manufacturing exports have partly offset rising import prices.
Lagarde, C. (2022), “Monetary policy in an uncertain world”, Speech at the “ECB and Its Watchers Conference XXII” conference, 17 March.
Europejski Bank Centralny
Dyrekcja Generalna ds. Komunikacji
- Sonnemannstrasse 20
- 60314 Frankfurt am Main, Niemcy
- +49 69 1344 7455
- media@ecb.europa.eu
Przedruk dozwolony pod warunkiem podania źródła.
Kontakt z mediami