
The ECB Survey of Professional Forecasters (SPF) - Fourth quarter of 2018
Summary
The results of the ECB Survey of Professional Forecasters (SPF) for the fourth quarter of 2018 show average inflation expectations of 1.7% for each of 2018, 2019 and 2020, unchanged from the previous survey.[1] Average longer-term inflation expectations (which refer to 2023) remained stable at 1.9%. Expectations for real GDP growth were revised down further to stand at 2.0%, 1.8%, and 1.6% for 2018, 2019 and 2020, respectively. Expectations for real GDP growth in the longer term remained unchanged at 1.6%. The unemployment rate was expected to continue falling further, and expectations for 2018, 2019 and 2020 were revised down.
Table 1
Results of the SPF in comparison with other expectations and projections
(annual percentage changes, unless otherwise indicated)
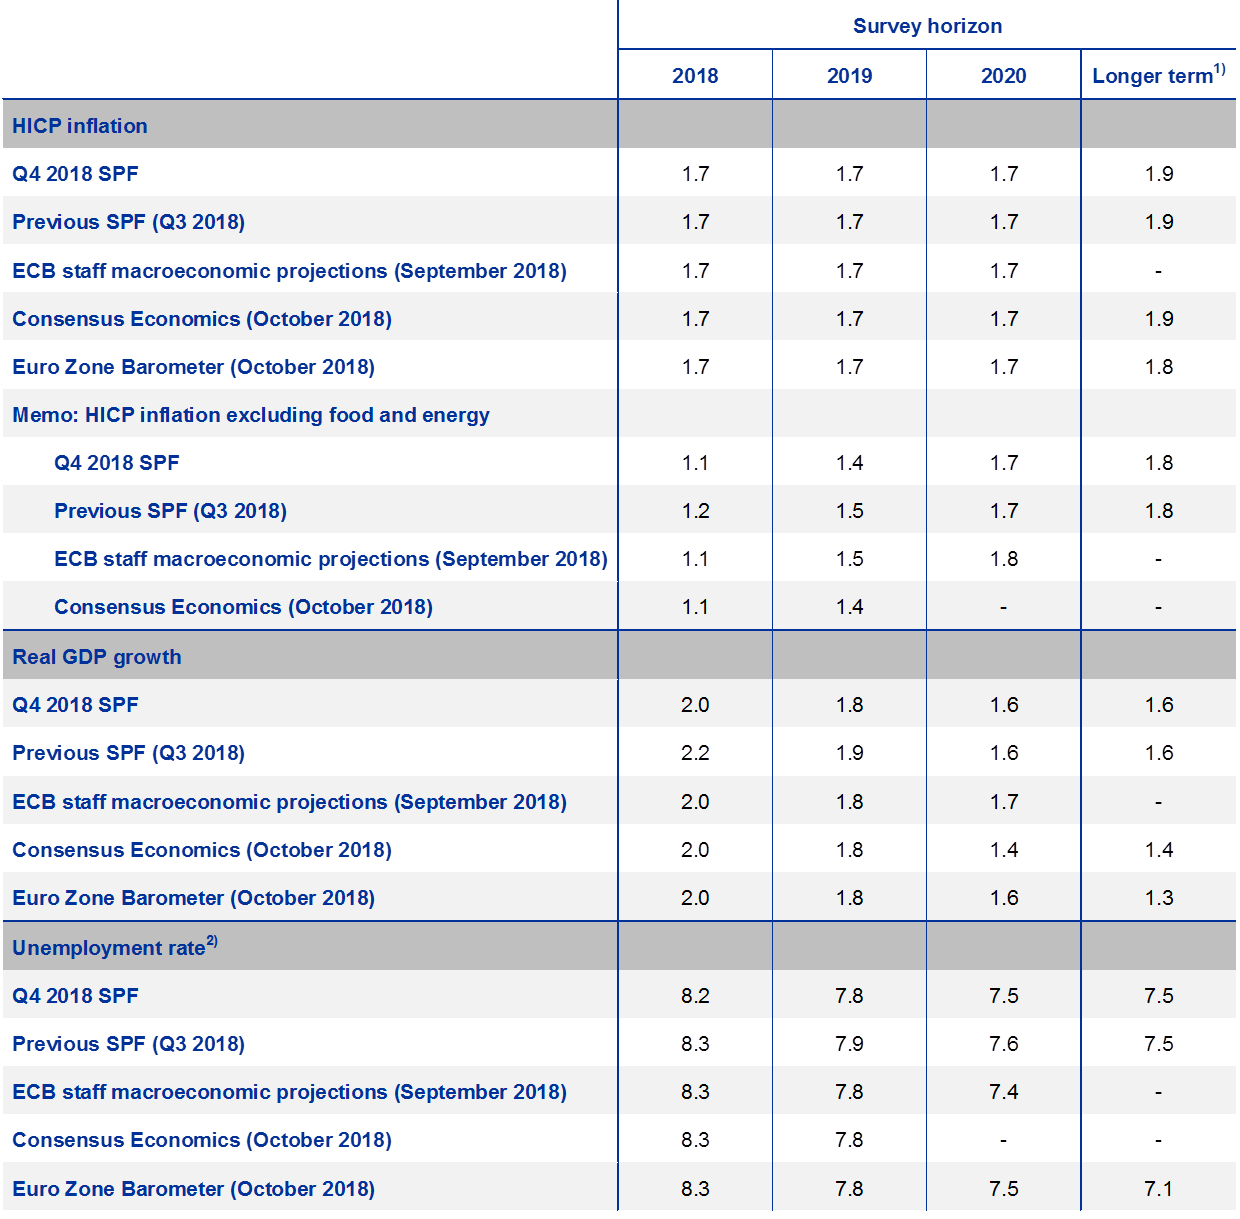
1) Longer-term expectations refer to 2023 for SPF and Consensus Economics and to 2022 for Euro Zone Barometer. For Euro Zone Barometer the numbers are preliminary.
2) As a percentage of the labour force.
1 HICP inflation expectations unchanged
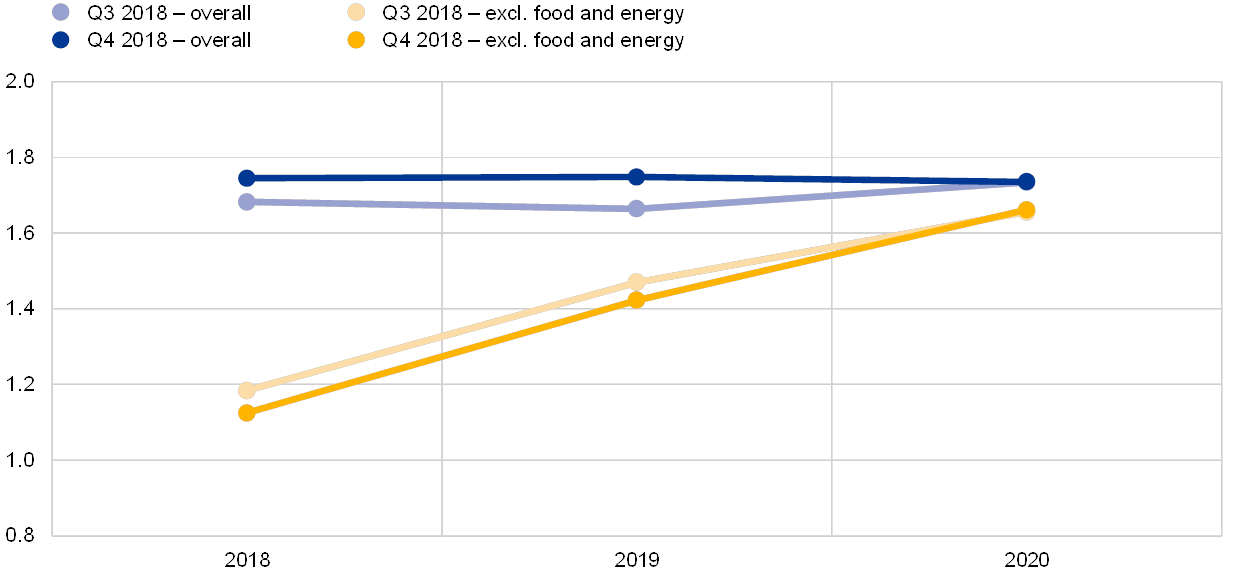
The results of the survey for the fourth quarter of 2018 show average inflation expectations of 1.7% for each of 2018, 2019 and 2020. This is unchanged from the profile in the previous survey, although the unrounded numbers are slightly higher for 2018 and 2019 (see Chart 1). Just over half of those who responded to both this and the previous survey made small upward revisions to their forecasts for 2018 and 2019, and, in their qualitative comments, typically attributed this to the higher oil price. The latest SPF results for inflation over the period 2018-2020 are comparable with the expectations reported in other surveys (see Table 1).
Average expectations for inflation excluding energy and food were revised down to stand at 1.1%, 1.4% and 1.7% for 2018, 2019 and 2020, respectively. The change in the unrounded results was much smaller, but nevertheless sufficient to cross the rounding threshold. The expected pick-up in underlying inflation remained underpinned by a pick-up in annual growth in compensation per employee, which was expected to increase to 2.3% by 2020.
Chart 1
Inflation expectations: overall HICP and HICP excluding food and energy
(annual percentage changes)
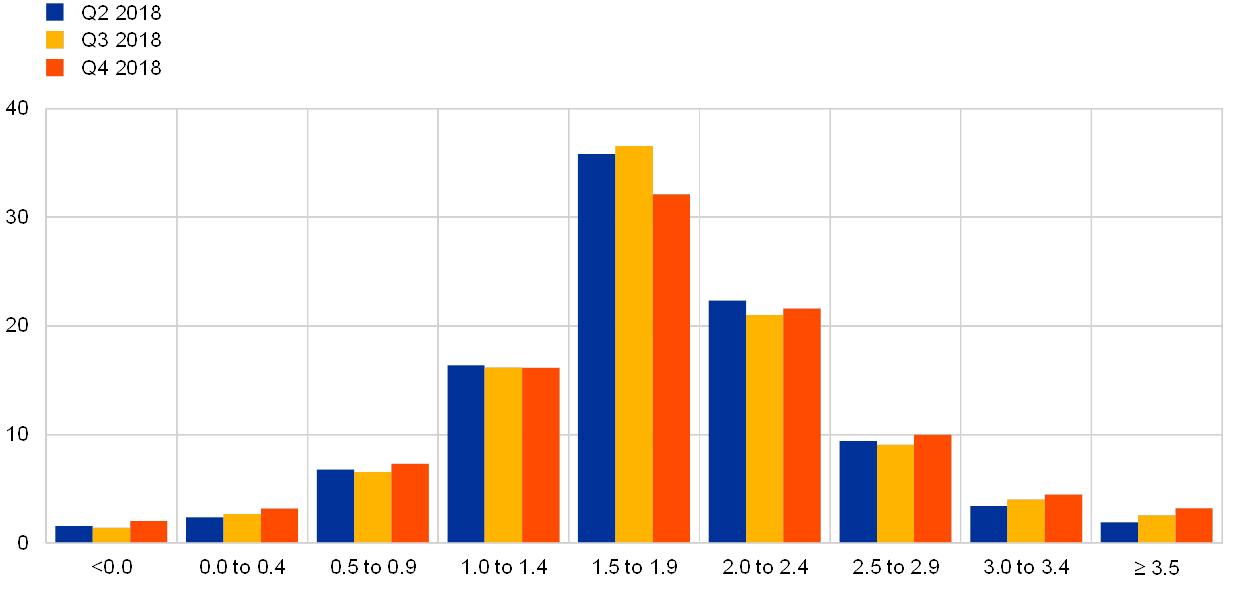
The reported probability distributions indicate slightly higher uncertainty around expected inflation in two years’ time and that the balance of risks moved a little further to the downside. The width of the forward-looking probability distributions indicates the perceived degree of overall uncertainty, whereas the asymmetry of the distributions indicates whether that uncertainty is concentrated more on higher or lower outturns, i.e. it measures the perceived balance of risks. For the calendar years 2018-2020, the aggregate probability distributions shifted a little to the right, mirroring the small moves in the point forecasts (see Chart 2). For 2018 and 2019 they also narrowed, which likely reflects the natural decline in uncertainty that occurs the nearer a forecast horizon becomes. The distributions at the two-year fixed horizon widened, indicating increased uncertainty, and became a little more negatively skewed, indicating that the balance of risks had tilted a little more to the downside. Respondents’ qualitative comments also tended to discuss downside risks, which were mainly seen as stemming from the downside risks to economic growth.
Chart 2
Aggregate probability distributions for inflation expectations for 2018, 2019 and 2020
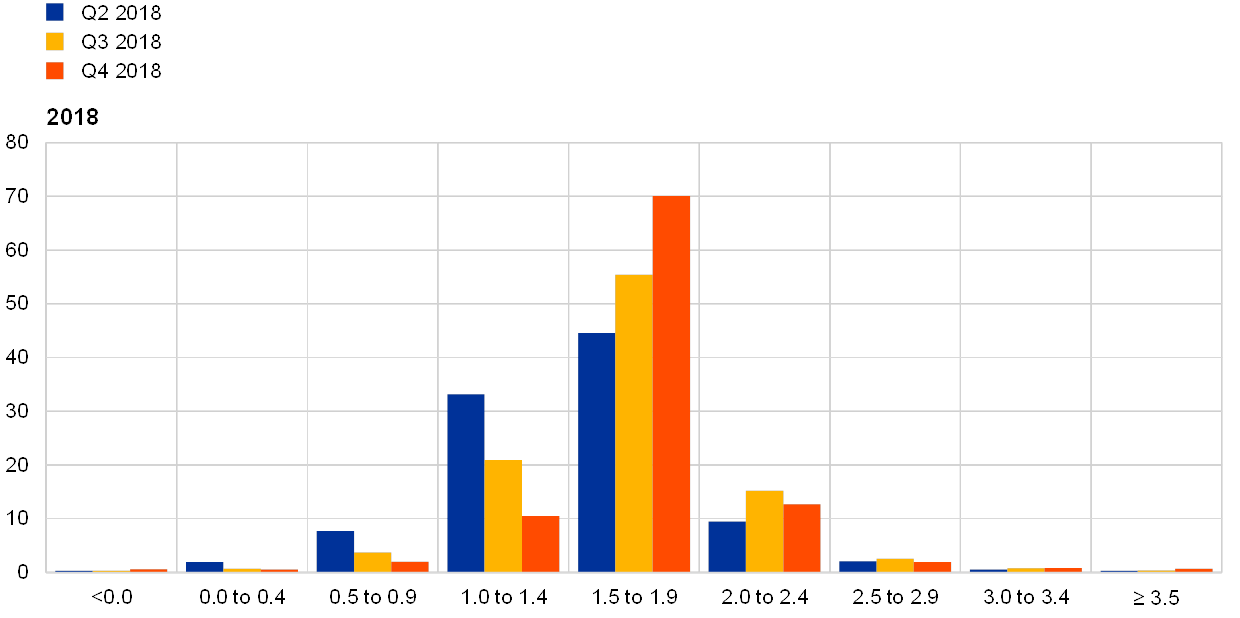
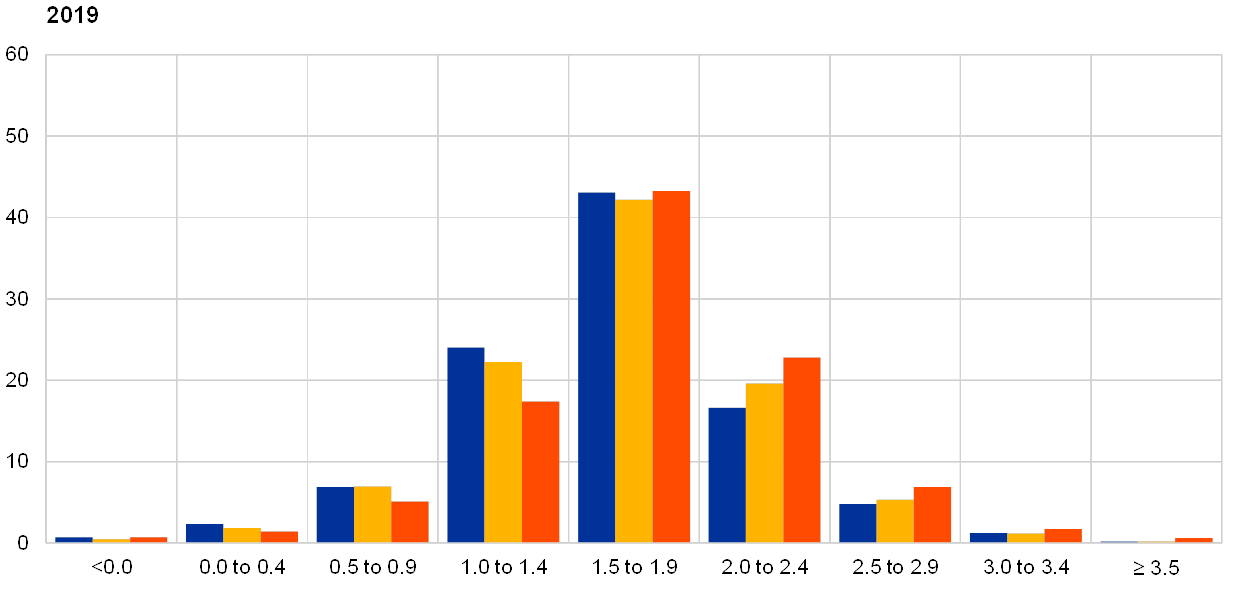
Note: The SPF asks respondents to report their point forecasts and to separately assign probabilities to different ranges of outcomes. This chart shows the average probabilities they assigned to inflation outcomes in 2018, 2019 and 2020.
2 Longer-term inflation expectations stable at 1.9%
The average point forecast for longer-term inflation expectations remained unchanged at 1.9%. The most reported value was again 1.9%, while the proportion of forecasters reporting 1.9% or 2.0% was higher than in the previous survey. At the same time, however, there was a small increase in the proportion of respondents reporting relatively high values (2.2%) and relatively low values (1.5%) (see Chart 3). This means that disagreement amongst forecasters, as measured by the cross-sectional standard deviation of the cross-section of responses, increased.
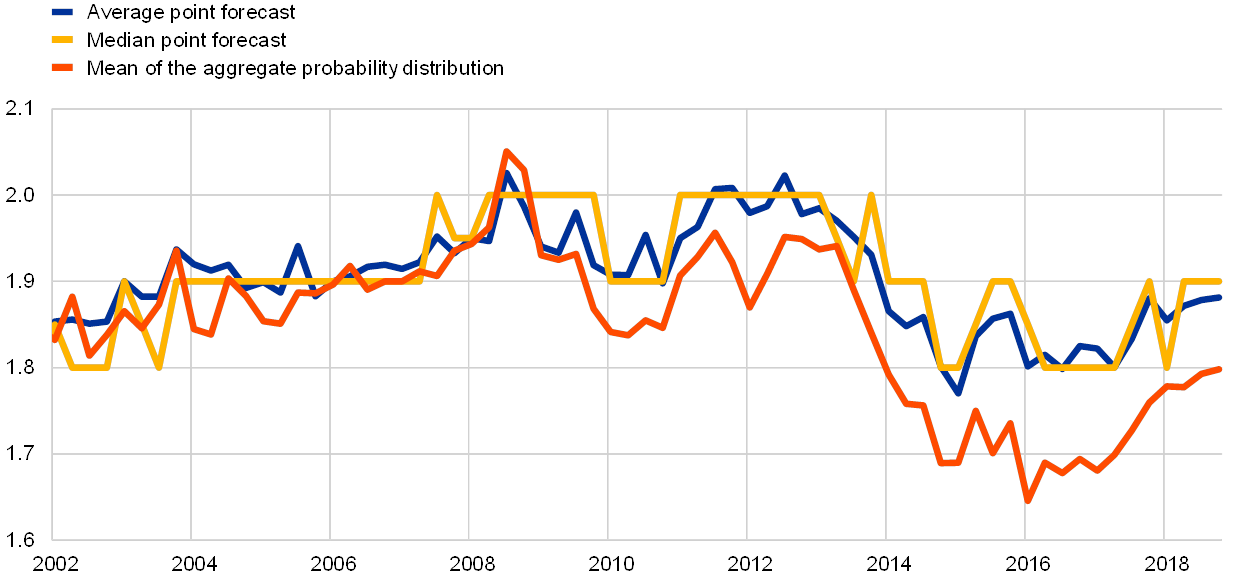
Other summary statistics also point to stable longer-term inflation expectations. The median point forecast remained unchanged at 1.9% and the mean of the expected probability distribution remained unchanged at 1.8% (see Chart 4). Overall, the different measures continue to indicate that longer-term inflation expectations have recovered somewhat from the low rates recorded in 2016, but have not yet fully returned to their pre-crisis rates.
Chart 3
Distribution of point expectations for HICP inflation in the longer term
(percentages of respondents)
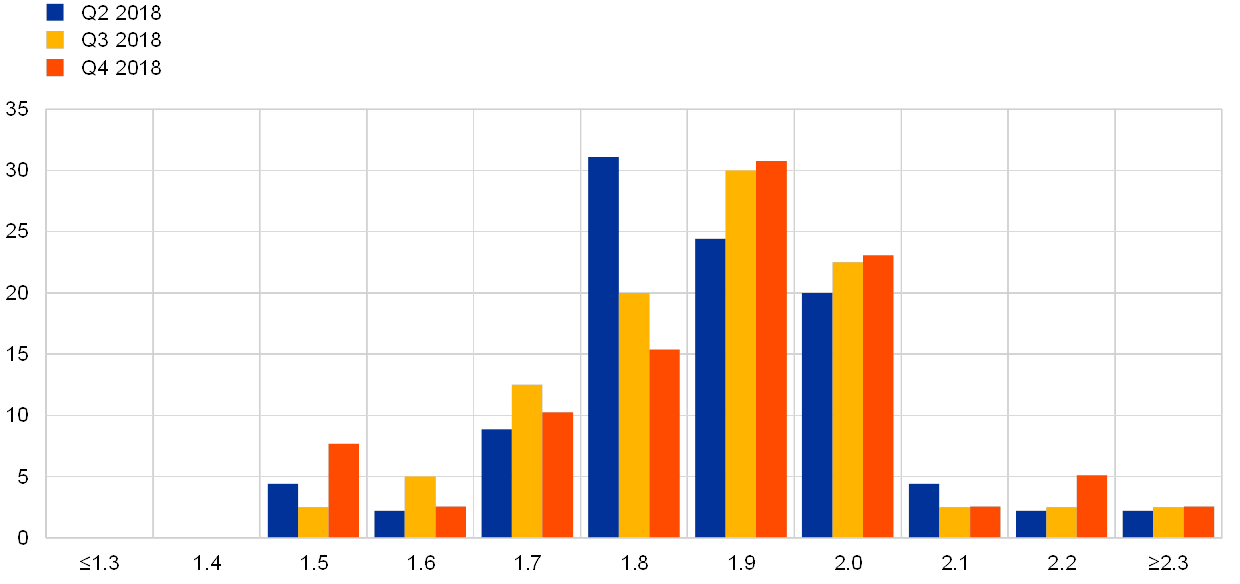
Note: The SPF asks respondents to report their point forecasts and to separately assign probabilities to different ranges of outcomes. This chart shows the spread of point forecast responses.
Chart 4
Longer-term inflation expectations
(annual percentage changes)
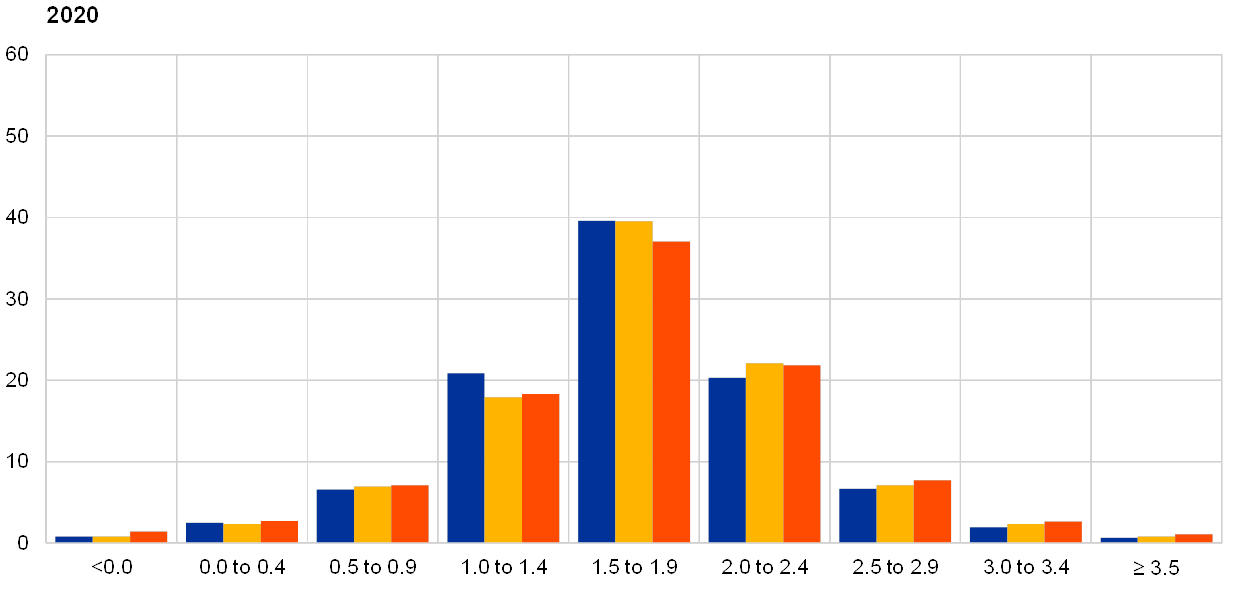
Probability distributions imply a small increase in overall uncertainty and a balance of risks that remained to the downside. The width of forecasters’ probability distributions for inflation in the longer term increased, indicating that they had become more uncertain. For example, the aggregate probabilities for both high outcomes (greater than 3%) and low outcomes (less than 1%) at this horizon increased (see Chart 5). In terms of asymmetry, the distribution remained skewed towards lower inflation rates; in other words, the balance of risks remained to the downside.
Chart 5
Aggregate probability distribution of longer-term inflation expectations
Note: The SPF asks respondents to report their point forecasts and to separately assign probabilities to different ranges of outcomes. This chart shows the average probabilities they assigned to inflation outcomes in the longer term.
3 Real GDP growth expectations revised down for 2018 and 2019
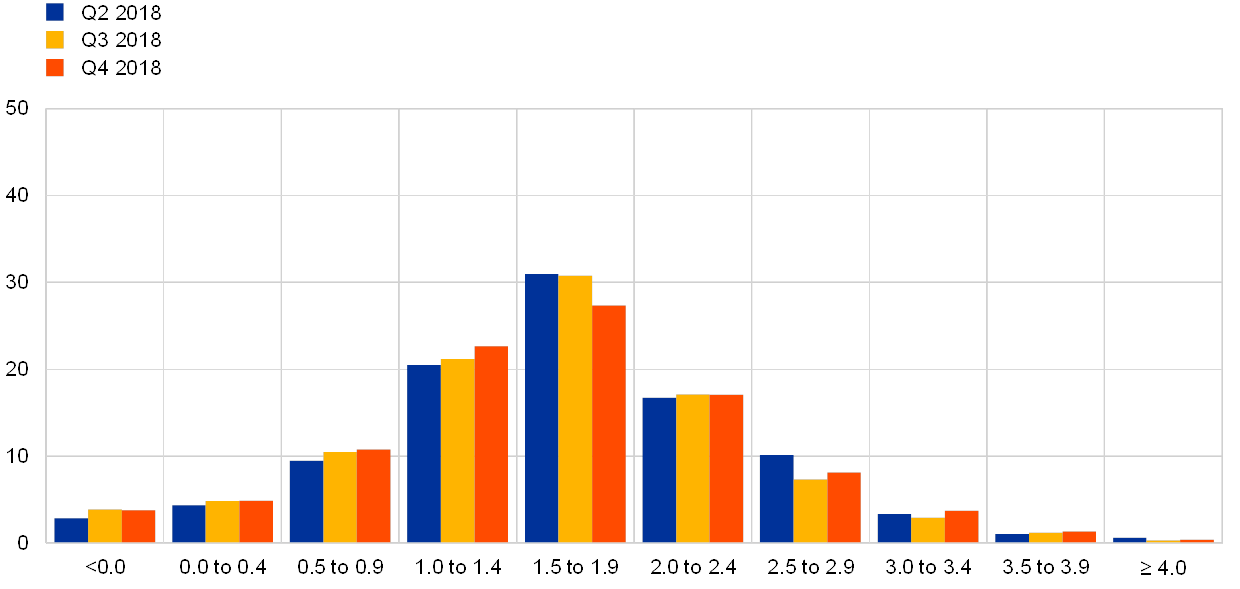
Expectations for real GDP growth stood at 2.0%, 1.8%, and 1.6% for 2018, 2019 and 2020, respectively. Compared with the previous survey round, this implies downward revisions of 0.2 p.p. for 2018 and 0.1 p.p. for 2019. In their qualitative comments, respondents typically attributed their revisions to external factors such as higher energy prices weighing on disposable income, with many also noting that they had now incorporated into their baseline forecasts at least some dampening impact on exports and investment due to increased uncertainty surrounding the outlook for world trade. Longer-term growth expectations continued to stand at 1.6%. The reported probability distributions moved to the left, echoing the downward revisions to point forecasts (see Chart 6 and Chart 7).
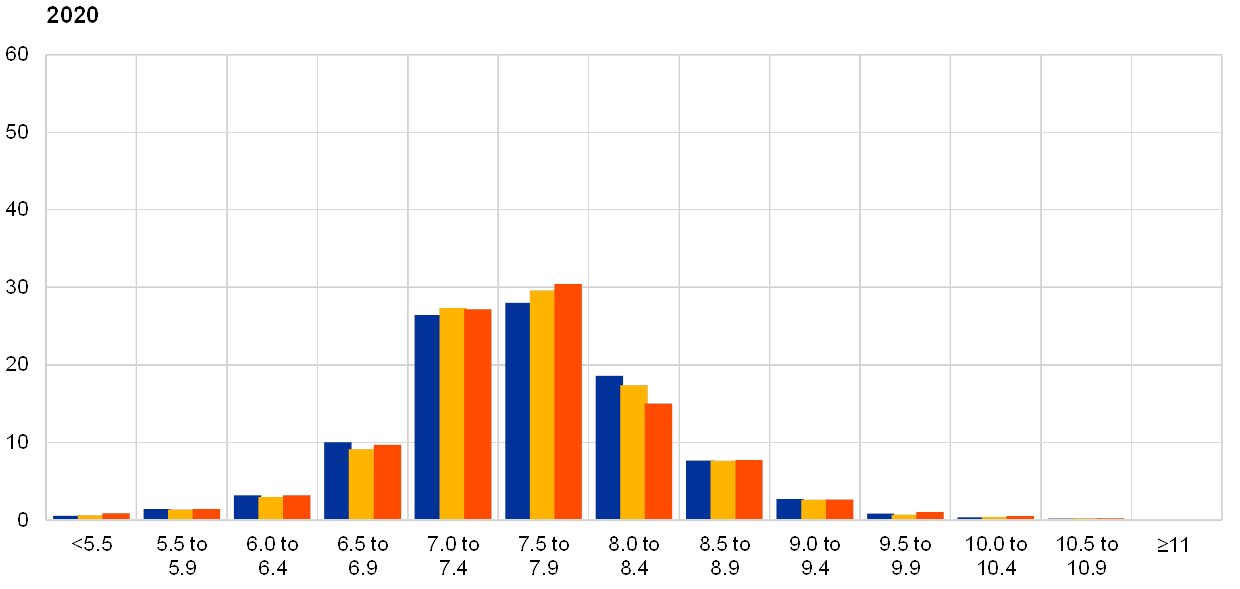
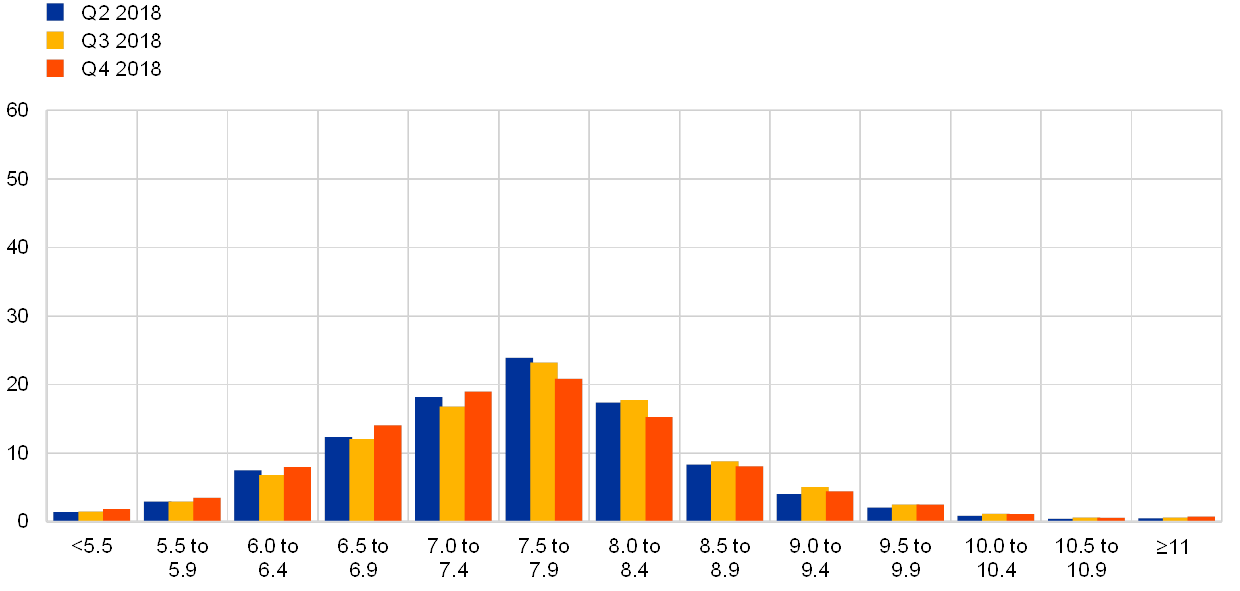
Risks to real GDP growth were seen as being to the downside across all horizons. As was the case in the previous survey round, respondents’ qualitative comments referred almost exclusively to downside risks to their real GDP growth forecasts, with only few respondents explicitly stating that they saw risks as balanced or to the upside. The main downside risk continued to be the possibility of a further escalation of the trade conflict between the US and China, and its global implications. In terms of the aggregate reported probability distributions, the probability of GDP growth of over 2% in 2018 fell from 67% to 62%, while for 2019 it decreased to 38%, from 44% in the previous round. Quantitative measures of the asymmetry of the probability distributions also indicate that the balance of risks around GDP growth expectations was skewed to the downside across the horizons.
Chart 6
Aggregate probability distributions for GDP growth expectations for 2018, 2019 and 2020


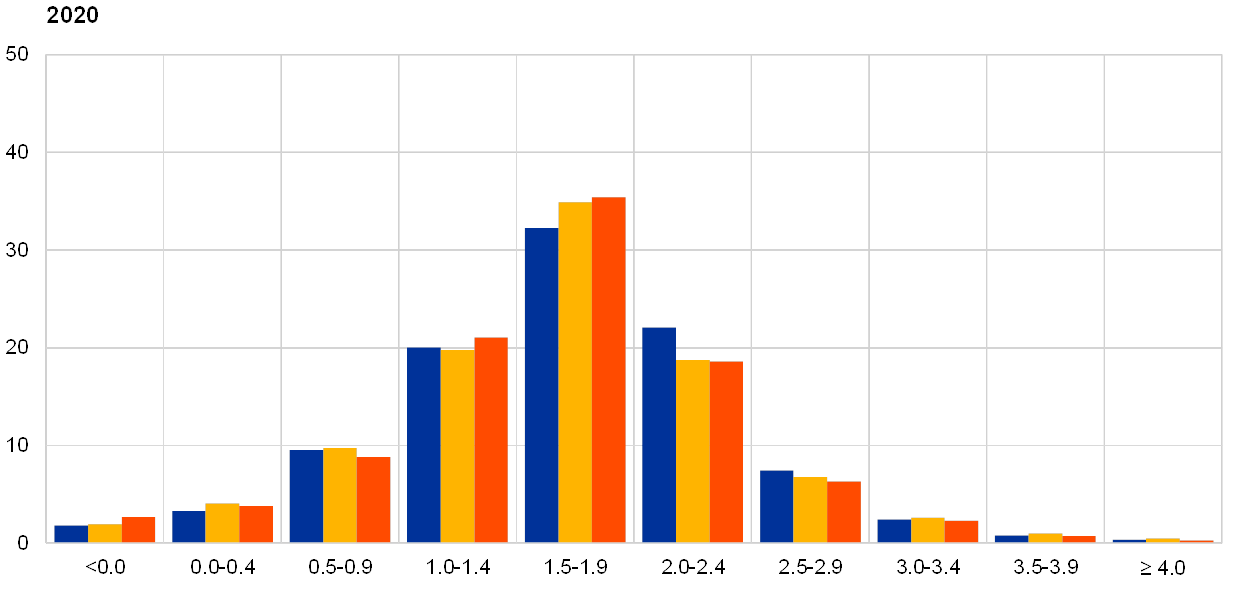
Note: The SPF asks respondents to report their point forecasts and to separately assign probabilities to different ranges of outcomes. This chart shows the average probabilities they assigned to real GDP growth outcomes in 2018, 2019 and 2020.
Chart 7
Aggregate probability distribution for longer-term GDP growth expectations
Note: The SPF asks respondents to report their point forecasts and to separately assign probabilities to different ranges of outcomes. This chart shows the average probabilities they assigned to real GDP growth outcomes in the longer term.
4 Unemployment rate expectations revised down slightly
The average point forecasts for the unemployment rate were 8.2%, 7.8% and 7.5% for 2018, 2019 and 2020, respectively. These results represent a small (0.1 p.p.) downward revision for each of these three horizons. Longer-term unemployment rate expectations remained unchanged at 7.5%.
The balance of risks remained tilted to higher unemployment rates at all horizons. In the aggregate probability distributions, although the probabilities assigned in the aggregate distributions to the range containing the point forecast increased for most horizons, there was little reduction in the probability assigned to the far right tails of the distributions (see Chart 8 and Chart 9). Thus the distributions remained skewed towards higher unemployment rate outcomes, indicating that the balance of risks is to the upside. In their qualitative comments, respondents tended to focus on risks which would limit the expected decline in the unemployment rate, for example the expected slowing in economic growth (where the balance of risks was seen as to the downside), and the potential build-up of wage pressures as the labour market tightened, and which might be exacerbated by increasing skills mismatch.
Chart 8
Aggregate probability distributions for the unemployment rate in 2018, 2019 and 2020
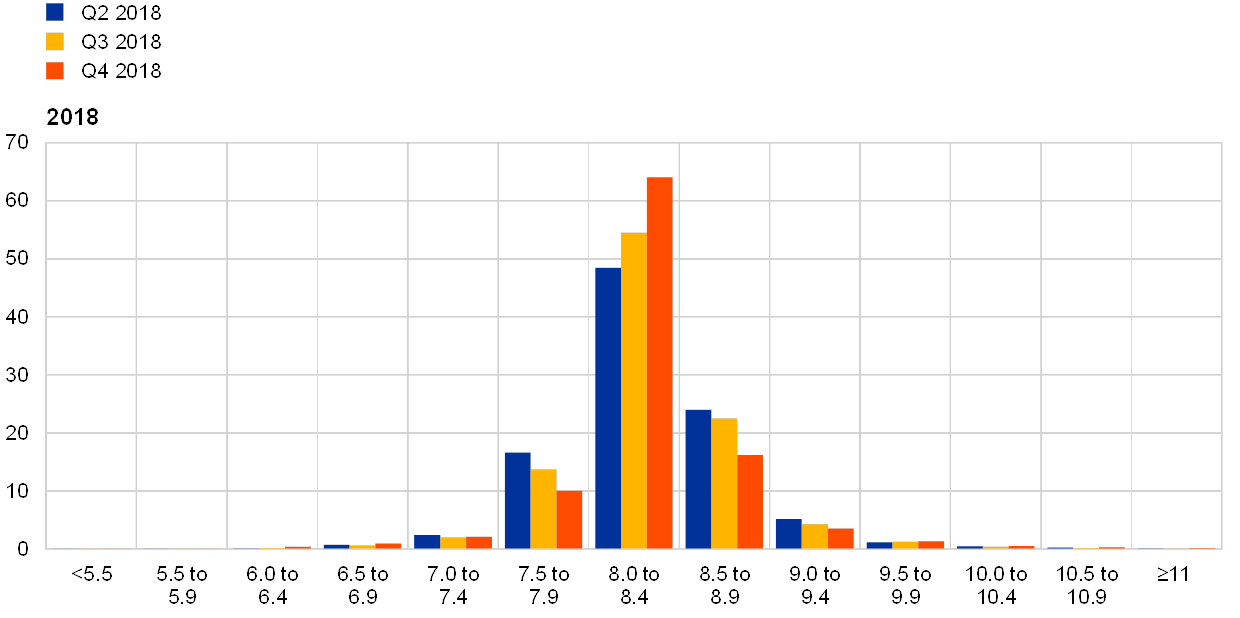
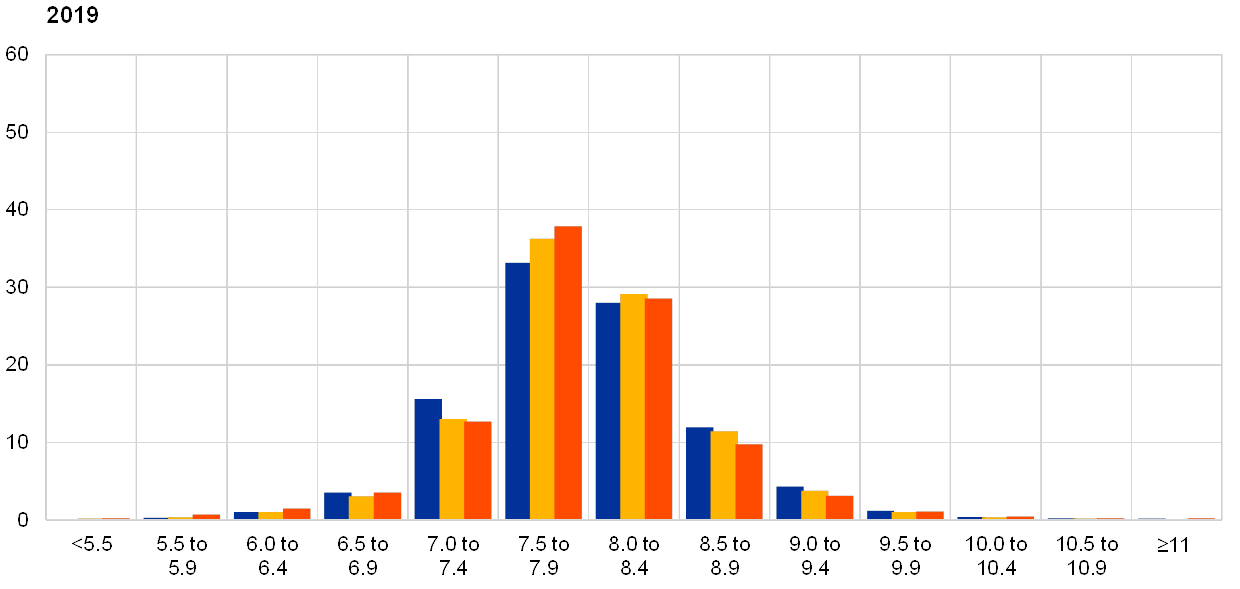
Note: The SPF asks respondents to report their point forecasts and to separately assign probabilities to different ranges of outcomes. This chart shows the average probabilities they assigned to unemployment rate outcomes for 2018, 2019 and 2020.
Chart 9
Aggregate probability distribution for the unemployment rate in the longer term
Note: The SPF asks respondents to report their point forecasts and to separately assign probabilities to different ranges of outcomes. This chart shows the average probabilities they assigned to unemployment rate outcomes in the longer term.
5 Expectations for other variables
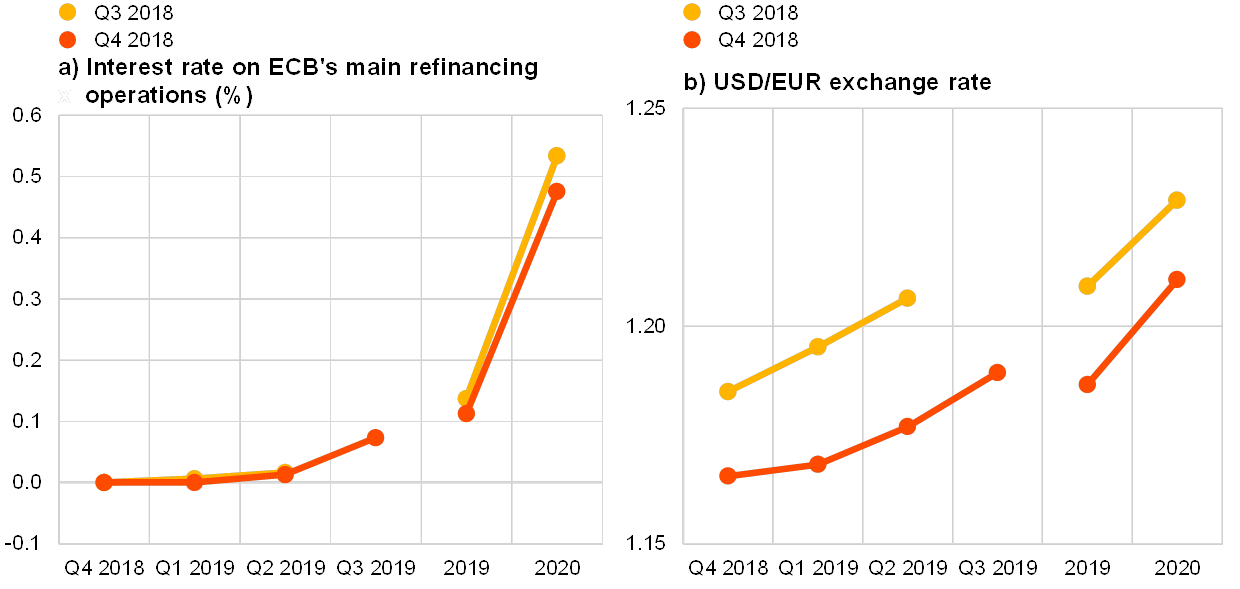
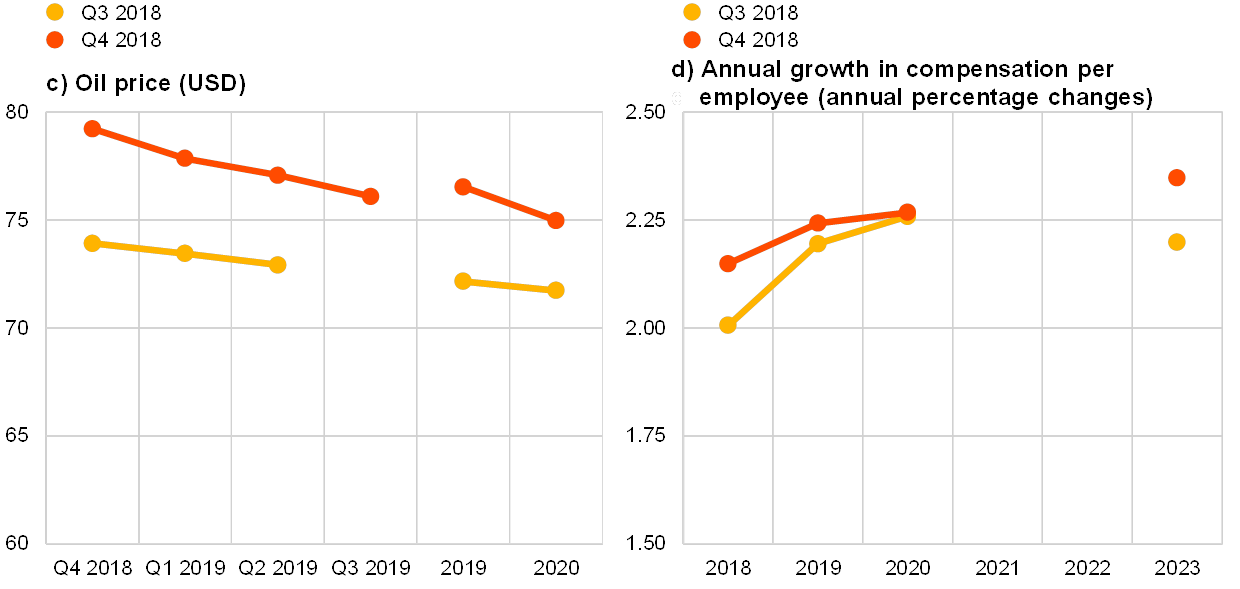
Respondents’ average expectations were for: the ECB’s main refinancing rate to stay at zero until the third quarter of 2019; the euro to continue appreciating against the dollar until 2020; USD oil prices to keep decreasing until 2020; and labour cost growth to increase over the whole forecast horizon.
The mean expectation for the rate on the ECB’s main refinancing operations was for it to remain at 0.0% in the near term, increasing a little to 0.11% in 2019 and then to 0.48% in 2020 (see panel (a) of Chart 10). The aggregate expectation for the near-term, quarterly profile is nearly unchanged from the previous round, whereas the expected policy rate for both 2019 and 2020 has been revised down.
The average expected USD/EUR exchange rate fell at all horizons, but more so for 2019 than 2020. Thus the expected pace of future appreciation of the euro increased relative to that lower starting point (see panel (b) in Chart 10).
US dollar-denominated oil prices were expected to average $79.2 in the last quarter of 2018, $76.5 in 2019 and $75 in 2020. This implies that forecasters now expect prices to be between 4.5% and 7.2% higher across the horizons than they did in the previous survey (see panel (c) of Chart 10). When combined with expectations of a weaker USD/EUR exchange rate, especially in the near term, these results imply a profile for the oil price in euro that is around 6.6% higher than in the previous survey.
On average, annual growth in compensation per employee was expected to be 2.2% in both 2018 and 2019 and 2.3% in both 2020 and 2023, revised up at all horizons from the previous survey (see panel (d) of Chart 10).
Chart 10
Expectations for other variables
6 Annex (chart data)
Excel data for all charts can be downloaded here.
© European Central Bank, 2018
Postal address 60640 Frankfurt am Main, Germany
Telephone +49 69 1344 0
Website www.ecb.europa.eu
All rights reserved. Reproduction for educational and non-commercial purposes is permitted provided that the source is acknowledged.
For specific terminology please refer to the ECB glossary.
PDF ISSN: 2363-3670, QB-BR-18-004-EN-N
HTML ISSN: 2363-3670, QB-BR-18-004-EN-Q, 10.2866/346197
- The survey was conducted between 1 and 5 October 2018. The total number of responses was 54. The survey requested information on expectations for the euro area HICP inflation rate (overall and excluding food and energy), the real GDP growth rate and the unemployment rate for 2018, 2019, 2020 and 2023, as well as for each of these variables one and two years ahead, with respect to the latest available data point. Participants were provided with a common set of the latest available data for annual HICP inflation (September 2018 flash estimates: overall inflation, 2.1%; excluding food and energy 0.9%), annual GDP growth (Q2 2018, 2.1%) and unemployment (August 2018, 8.1%).