
Euro area foreign direct investment since 2018: the role of special purpose entities
Published as part of the ECB Economic Bulletin, Issue 5/2019.
In 2018 gross foreign direct investment (FDI) flows in the euro area experienced a reversal for the first time since the inception of the euro.[1] FDI flows have decreased on both the liability side and the asset side since early 2016, when gross flows accounted for around 9% of euro area GDP (see Chart A).[2] In 2018 FDI liability flows became positive, suggesting disinvestments of either foreign parents outside the euro area or affiliates resident in the euro area, then FDI asset flows turned negative, implying disinvestments of either parents resident in the euro area or foreign affiliates outside the euro area. It is important to track gross flow dynamics as they can signal changes in international market conditions.[3] Like other mature and developed economies, the euro area tends to be a net foreign lender and, despite the reversal in gross flows, it posted net FDI outflows (gross asset flows minus gross liability flows) within the historical range in 2018. Cumulated gross FDI flows continued the reversal in early 2019 but they may be beginning to normalise. Liabilities gross flows recently recorded a recovery, which resulted in net capital inflows in the euro area, although this is likely to be temporary.
Chart A
Euro area foreign direct investment
(as a percentage of GDP; 12-month moving sum)
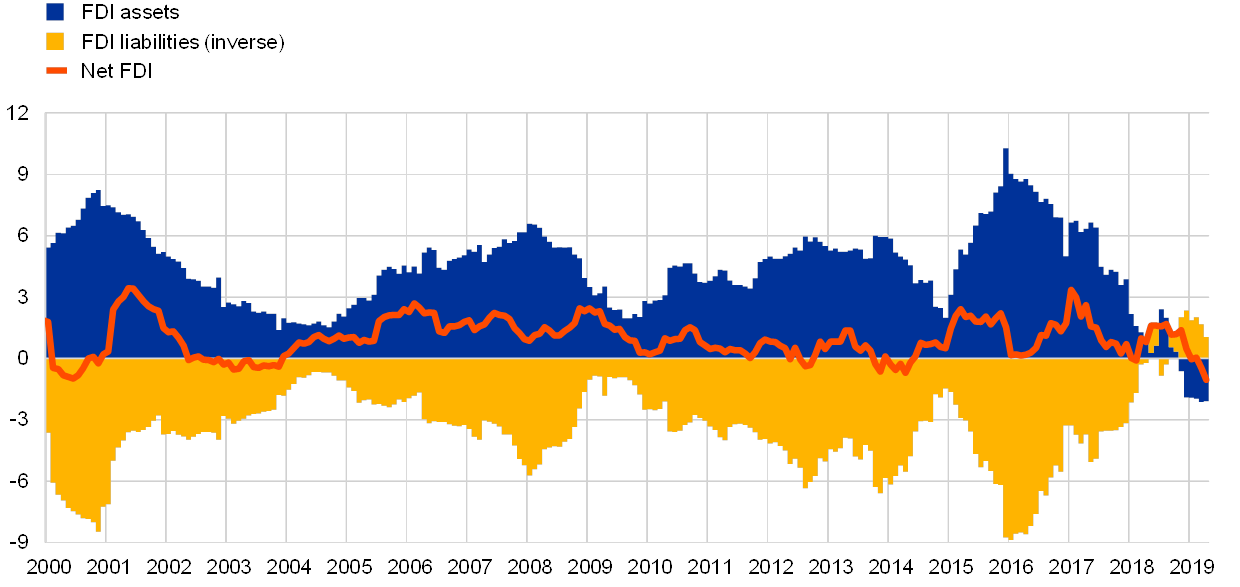
Sources: ECB, Eurostat and ECB Staff calculations.
Note: Net FDI is the difference between gross assets and gross liabilities; positive values represent net capital outflows and negative values represent net capital inflows. The latest observation is for April 2019.
Regarding the geographical composition, gross flows to Luxembourg and the Netherlands accounted for the bulk of the reversal in liabilities in 2018, although Ireland and Belgium also contributed significantly.[4] The decomposition by destination indicates that the retrenchment reflected a reversal in the liabilities of Luxembourg, the Netherlands and, to a lesser extent, Ireland and Belgium. On the contrary, the other euro area Member States continued to attract inward FDI in 2018 and in the first quarter of 2019 (see panel (a) of Chart B).
Chart B
Euro area foreign direct investment transactions by Member State
(EUR billions, four-quarter moving sum)
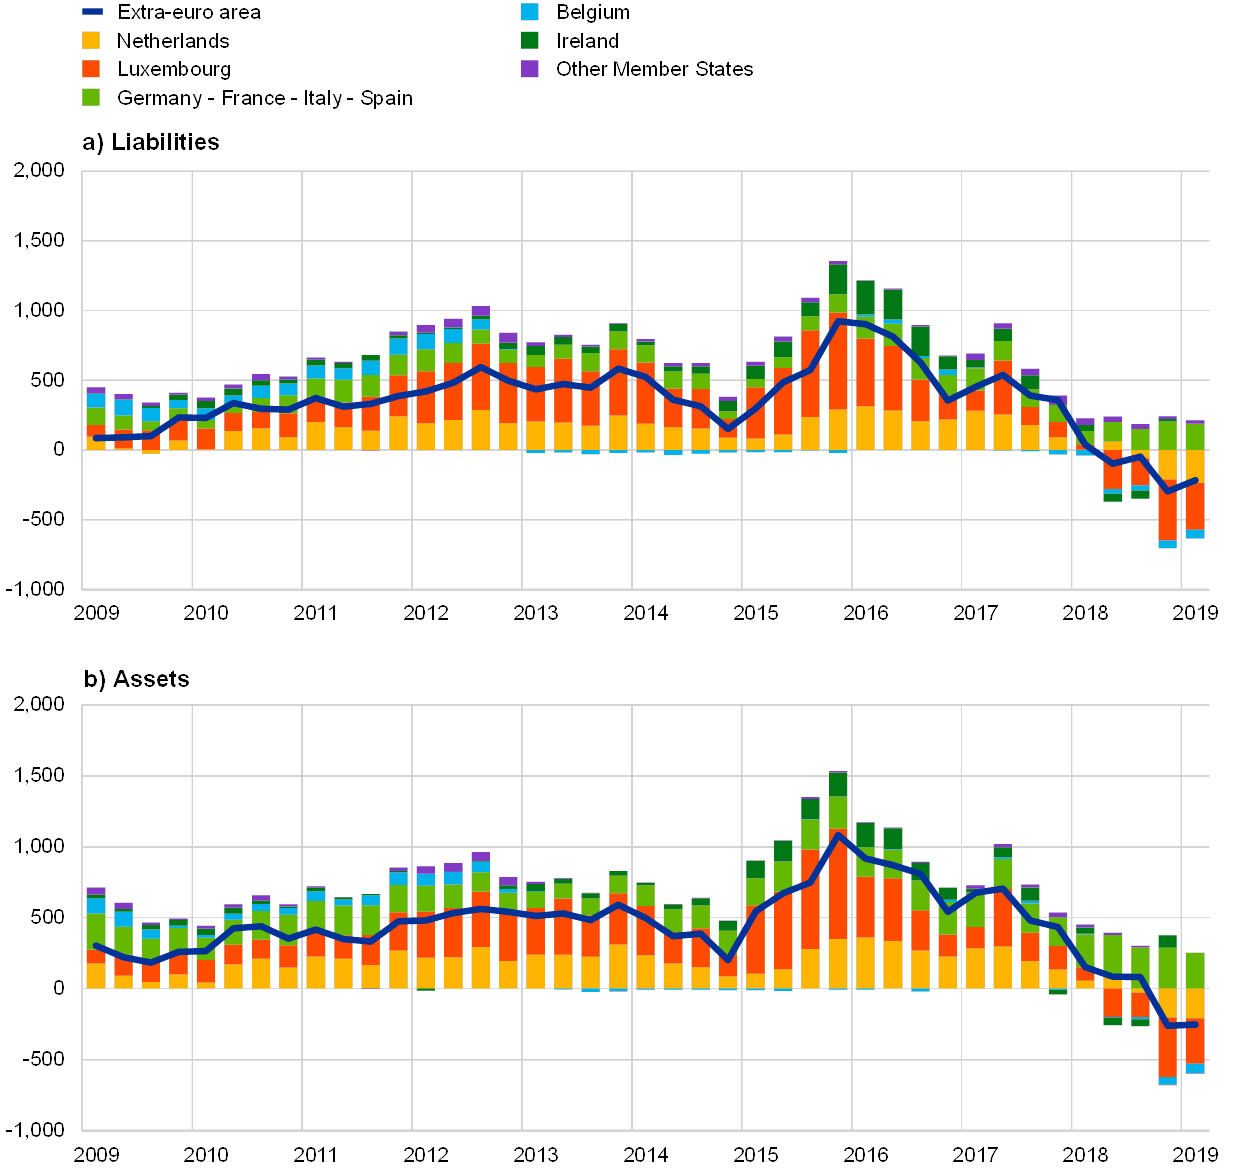
Sources: ECB and ECB staff calculations.
Notes: Foreign direct investment transactions of euro area Member States vis-à-vis intra- and extra-euro area countries. Other Member States refers to the other euro area Member States not depicted in the chart. The line “Extra-euro area” refers to total transactions vis-à-vis counterparties outside the euro area. The latest observations are for the first quarter of 2019 and for the fourth quarter of 2018 for Ireland.
The geographical breakdown suggests that the transactions of special purpose entities (SPEs)[5] set up by multinational enterprises may have played an important role in the retrenchment in gross FDI (see Chart C). SPEs do not typically conduct traditional FDI operations such as mergers and acquisitions or greenfield investments, and instead funnel capital flows. Therefore, mergers and acquisitions involving euro area countries tend to generate financial flows that pass through the economies hosting a large number of SPEs. In the euro area SPEs are prevalently located in Luxembourg, the Netherlands, Ireland and Belgium. As SPEs act as a vehicle, the countries in which they are located become transit economies for these types of operations and the final destination of foreign investments lies elsewhere. Transit FDI has two main effects on countries where the operations of SPEs result in a pass-through of capital: it tends to inflate gross flows and generate a very high degree of co-movement between asset and liability flows. The reversal episode seems to be closely tied to transit FDI for two reasons: (i) gross asset flows were also considerably affected and experienced a reversal (see panel (b) of Chart B)[6]; and (ii) the four largest euro area economies (Germany, France, Italy and Spain) – where inward FDI usually only finances real activity and the corporate tax regimes do not favour the creation of corporate structures such as SPEs – did not experience any marked decline in FDI flows, either in gross terms or in net terms (Chart B and Chart C).
Chart C
Euro area foreign direct investment transactions by resident SPEs and non-SPEs
(EUR billions, four-quarter moving sum)
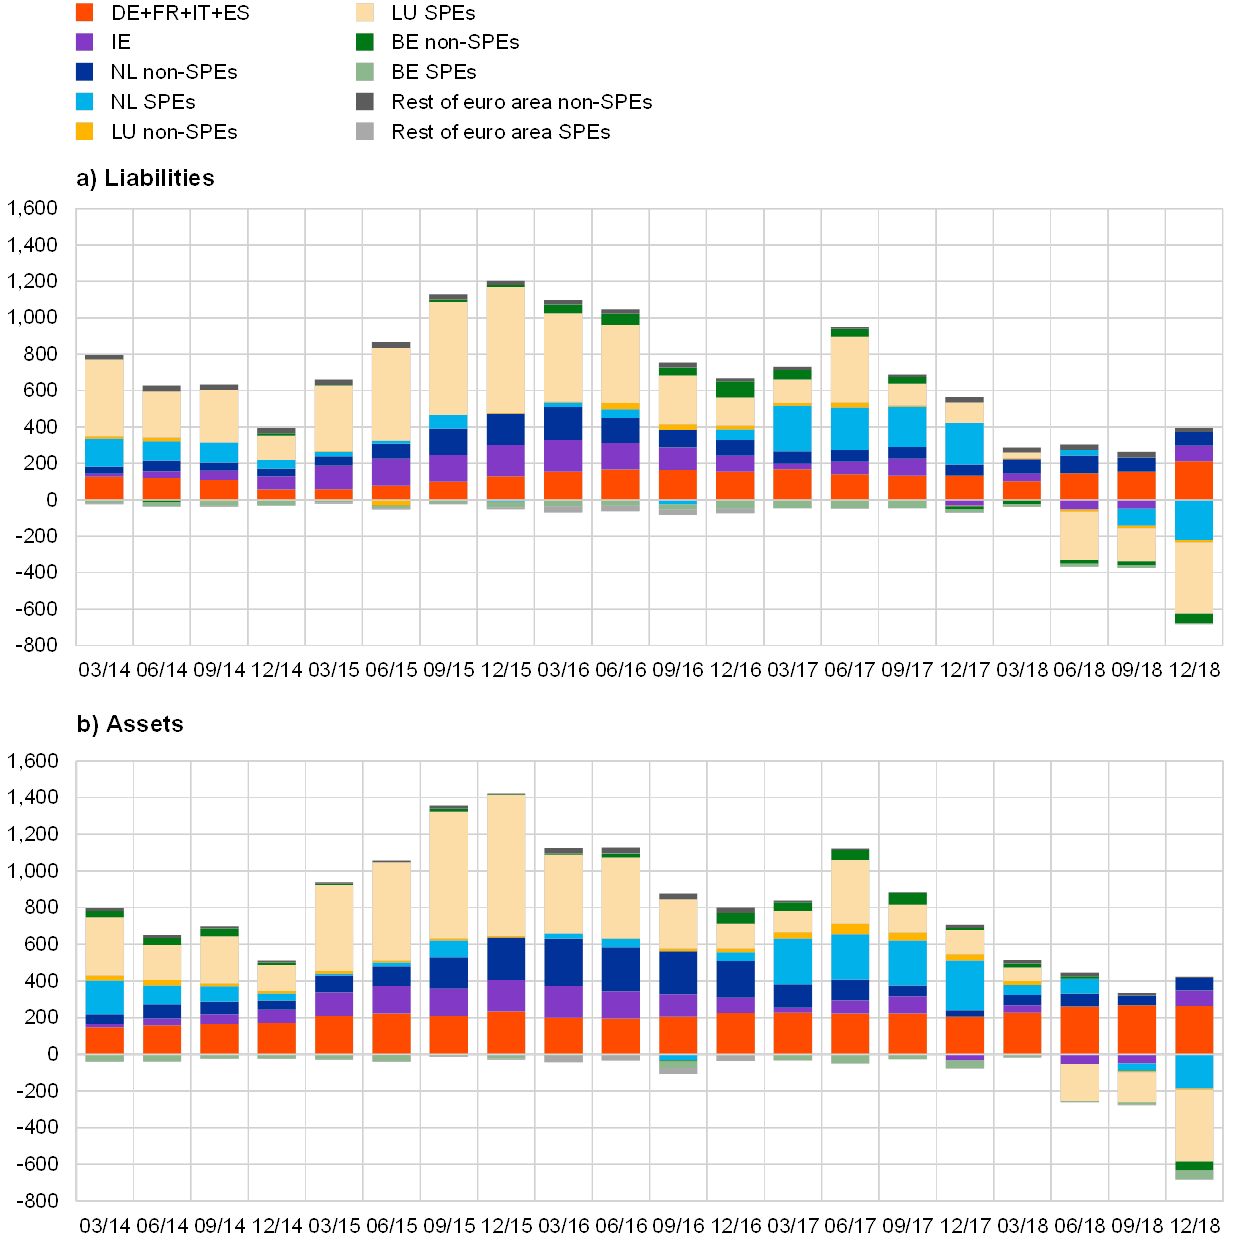
Sources: ECB and ECB staff calculations.
Notes: The chart shows the FDI transactions of resident special purpose entities (SPEs) and resident non-special purpose entities (non-SPEs) according to the asset/liability principle for countries where the breakdown between the two types of entities is available (namely the Netherlands, Luxembourg and Belgium). A breakdown is not available for Ireland, despite a large number of SPEs operating in the country. In Germany, France Italy and Spain, the FDI flows of SPEs are not separately reported given the limited activity of the relatively small number of entities operating in these countries. “Rest of euro area” includes all euro Member States except Belgium, Germany, Estonia, Ireland, Spain, France, Italy, Cyprus, Luxembourg, Malta, the Netherlands and Slovakia. The latest observation is for the fourth quarter of 2018.
The United States was the main driver of the reversal in gross FDI flows.[7] The decomposition of flows by main partner country shows that the United States accounted for the bulk of the reversal episode, especially on the liability side.[8] Inflows to the euro area from offshore centres and outflows from the euro area to offshore centres show a similar disinvestment pattern on both sides, with two main differences with respect to the United States. Disinvestments only started in the second part of 2018 and were larger on the asset side, which, for the euro area, resulted in net FDI inflows from offshore centres and net FDI outflows to the United States. A common rationale for these capital movements is that certain measures included in the US corporate tax reform[9] may have played an important role in driving gross flows to and from the euro area.[10] Liability and asset flows of offshore centres to/from the euro area have also been affected as they tend to reflect the activity of the intermediary entities resident in these countries, whose transactions offset part of the outflows from the United States.
The repatriation of foreign earnings by US multinationals mainly affected FDI flows to Europe, whereas developing economies (excluding offshore centres) have been largely unaffected (see Chart D).[11] There are several factors contributing to the asymmetric behaviour of US multinationals. First, Europe remains the main recipient of US funds. At the same time, mergers and acquisitions represent the largest share (about 70%) of total euro area gross FDI inflows and outflows but only a minor share of the gross FDI inflows and outflows of emerging economies (around 20-30% respectively). Greenfield investments are, however, prevalent in developing economies. The decomposition of investment by type of financial instrument shows that SPEs have primarily contributed to the flow reversal through a divestment in equity FDI in the euro area, while reinvested earnings were unaffected. Debt FDI was affected, albeit to a lesser extent as volumes of debt FDI gross flows in the countries concerned (Luxembourg, the Netherlands, Belgium and Ireland) are normally smaller than those of equity FDI gross flows. Therefore, the different composition of the FDI flows is likely to have limited the opportunities for US multinationals to carry out such operations to the same extent in emerging economies.
Chart D
Decomposition of euro area foreign direct investment flows by partner country: United States, offshore centres, BRIC countries and rest of the world
(EUR billions, four-quarter moving sum of transactions)
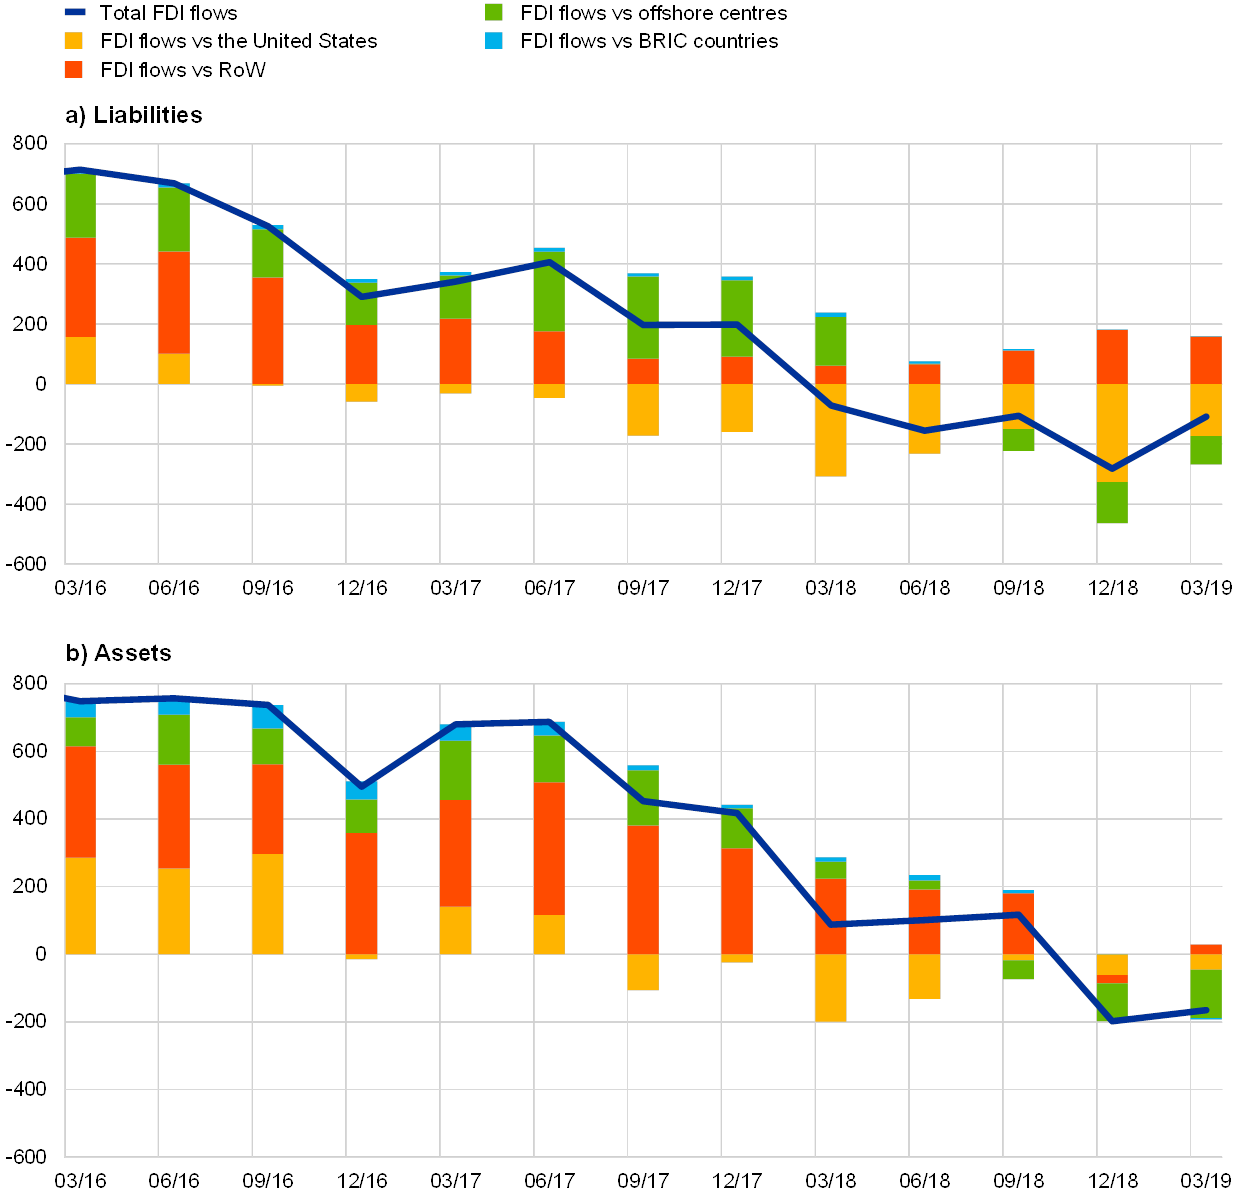
Sources: ECB and ECB staff calculations.
Notes: Rest of the world (RoW) includes all countries except the United States, the financial offshore countries and the BRIC group, which comprises Brazil, Russia, India and China. The latest observation is for the first quarter of 2019.
Reverse investments accounted for less than one-third of the overall FDI retrenchment. FDI flows can be classified according to the balance sheet criterion (i.e. assets vs liabilities) or the directional criterion (i.e. inward flows vs outward flows).[12] An important difference between the two reporting systems is that the asset-liability measure is adjusted by subtracting intragroup and intra-fellow reverse investment flows to obtain inward and outward FDI statistics.[13] The reverse investment measure is, therefore, the difference between the two classifications and can be calculated in the same way for the liability side and the asset side. A change in this measure can signal that US parent companies disinvested or repatriated profits through their affiliate-fellow enterprises resident in the euro area. However, it can also indicate that euro area parent companies recalled home profits held at their affiliate-fellow enterprises resident in the United States or disinvested in the country.[14] Bearing these definitions in mind, approximately one-third of the contraction in gross FDI liabilities in the euro area in 2018 was due to reverse investments.[15]
In conclusion, the episode of reversal of gross FDI flows in the euro area seems to have been primarily related to the activity of SPEs. When disentangling flows pertaining to SPEs from the flows of other resident companies,[16] it appears that SPEs are solely responsible for the aggregate contraction in euro area FDI flows on the liability side (Chart C). It seems that mergers and acquisitions and greenfield investments remained resilient in 2018, which suggests that these flows are unlikely to have had negative implications for real activity thus far. However, while the situation may normalise going forward, it is still too early to assess the possible effects of transit FDI on real activity in the euro area over the longer term.
- This box discusses evidence obtained from a four-quarter sum of foreign direct investment flows. It is common practice to assess sums or average developments as these smooth out some of the volatility of the high-frequency foreign direct investment data. Developments in quarterly data were also checked and the major findings still qualitatively hold.
- On an asset/liability basis, direct investment is classified according to whether the investment relates to an asset or a liability for the country compiling the statistics. For example, a country’s liabilities include foreign parents’ equity investments in affiliates resident in that country because those investments represent claims that foreigners have on assets in the reporting country. On the same basis, in the compilation of FDI statistics, parent companies resident in a euro area country and investing in debt issued by their affiliates resident outside of the euro area are assets for the euro area. See “Implementing the latest international standards for compiling foreign direct investment statistics: Asset/liability versus directional presentation”, OECD, December 2014.
- Extensive literature has shown that certain characteristics of the recipient country, such as size, productivity and economic growth dynamics, cultural and colonial ties, and distance and quality of institutions, are important determinants of net FDI. Similarly, another strand of the literature has shown that net FDI is relevant for the productivity and economic growth of emerging countries. On the other hand, a drying-up of gross capital flows, both in emerging countries and in developed economies, may precede the onset of a financial crisis. This was the case for the bursting of the “dot-com bubble” in 2001, the global financial crisis of 2008 and the European debt crisis in 2012.
- The analysis focuses on the liabilities/inward side as it triggered the reversal of flows, although the narrative would not change if the asset side were to be discussed.
- According to the International Monetary Fund (IMF) “a special purpose entity, resident in an economy, is a formally registered and/or incorporated legal entity recognized as an institutional unit, with no or little employment up to maximum of five employees, no or little physical presence, and no or little physical production in the host economy. They are directly or indirectly controlled by non-residents and established to obtain specific advantages provided by the host jurisdiction with an objective to (i) grant its owner(s) access to capital markets or sophisticated financial services; and/or (ii) isolate owner(s) from financial risks; and/or (iii) reduce regulatory and tax burden; and/or (iv) safeguard confidentiality of their transactions and owner(s). Special purpose entities transact almost entirely with non-residents and a large part of their financial balance sheet typically consists of cross-border claims and liabilities” (excerpt from the Final Report of the IMF Task Force on Special Purpose Entities, International Monetary Fund, October 2018). Recent literature on the role of SPEs includes Blanchard, O. and Acalin, J., “What does measured FDI actually measure?”, PIEE Policy Brief, 2016; Dellis, K., Sondermann, D. and Vaanstenkiste, I., “Determinants of FDI inflows in advanced economies: Does the quality of economic structures matter?”, Working Paper Series, No 2066, ECB, Frankfurt am Main, May 2017; Lane, P. and Milesi-Ferretti, G.M., “International Financial Integration in the Aftermath of the Global Financial Crisis”, IMF Working Paper 17/115, International Monetary Fund, 2017.
- The IMF makes a distinction between tax havens and countries with substantial real economic activity that also host a large number of foreign affiliates and SPEs. Such “conduit countries” offer a favourable tax and investment regime for foreign investment, making them a preferred hub for multinationals to base their foreign affiliates and redirect their profits from the economies with “heavier” taxation where the profits were originally generated. In the literature it has been argued that FDI in conduit countries that is related to the activity of SPEs should be considered as income subject to tax in the country where it was generated. For this reason, SPE flows are used to extend the offshore investment matrix and are included in the estimation of the tax base erosion. The base erosion is calculated based on FDI in countries with similar economic activity and on the share of SPEs relative to total FDI stocks. See Bolwijn R., Casella, B. and Rigo, D., “An FDI-driven approach to measuring the scale and economic impact of BEPS”, Transnational Corporations, Vol. 25, No 2, 2018, pp. 107-144.
- See “FDI in Figures”, OECD, April 2019, June 2019 and Emter, L., Kennedy, B. and McQuade, P., “US profit repatriations and Ireland’s Balance of Payments statistics”, Quarterly Bulletin, Central Bank of Ireland, April 2019.
- The Bureau of Economic Analysis (BEA) reported around USD 300 billion of repatriated earnings in the first quarter of 2018 and about USD 170 billion in the second quarter. See the box entitled “Effects of the 2017 Tax Cuts and Jobs Act on Components of the International Transactions Accounts” in US International Transactions Third Quarter 2018, Bureau of Economic Analysis, December 2018. According to the United Nations Conference on Trade and Development (UNCTAD), these amounts largely correspond to the contraction in Europe-US liabilities. See “Global foreign investment flows dip to lowest levels in a decade”, Global Investment Trends Monitor No 31, United Nations Conference on Trade and Development, January 2019.
- The US corporate tax reform, signed by President Donald Trump on 22 December 2017, creates incentives for the repatriation of deferred profits held by US multinationals abroad through the switch from a worldwide corporate tax system to a territorial tax system. Under the reform, repatriated profits of US multinationals from their foreign affiliated companies are in principle no longer taxable in the United States and are subject to a one-off mandatory repatriation tax. Moreover, the reform has improved the tax attractiveness of the United States relative to Europe (through a reduction in the statutory corporate tax rate and more favourable deduction rules for new investment) and introduced several new anti-base erosion measures. See the box entitled “The macroeconomic impact of the US tax reform”, Economic Bulletin, Issue 1, ECB, 2018.
- For an empirical analysis and potential effects of the recent US corporate tax reform, see De Simone, L., Piotroski, J.D. and Tomy, E.R., “Repatriation Taxes and Foreign Cash Holdings: The Impact of Anticipated Tax Reform”, Review of Financial Studies, November 2018.
- For a detailed discussion of gross inflows and outflows by main region, see “World Investment Report 2019”, United Nations Conference on Trade and Development, June 2019. Inward and outward gross flows expanded in Asia and in Africa, while the decline in transition economies and Latin America is linked to the economic conditions of the main economies in these regions.
- The asset-liability criterion reports whether investments relate to an asset or a liability for the reporting country, while the directional presentation organises the flows according to the direction of the investments for the reporting country (outward vs inward). FDI data based on the directional principle are only available on a quarterly basis starting from 2013.
- Reverse investments consist: (i) on the liability side, of equity in and lending to foreign parents by resident affiliates; and (ii) on the asset side, of equity in and lending to resident parents by foreign affiliates. Currently a broad measure of reverse investment is used, which also includes so-called “intra-fellow flows”, i.e. flows between enterprises that do not have a direct investment relationship themselves but that have a direct investor in common; such enterprises are called fellow enterprises.
- Transactions between fellow enterprises are now included in FDI statistics following the adoption by the IMF of the sixth edition of the balance of payments and international investment position manual (BPM6), as they likely result from the influence of the common direct investor.
- In Luxembourg, which accounts for the greatest part of the retrenchment, reverse investments are responsible for around 34% of the gross liabilities reversal at the end of 2018. In Belgium reverse investments are the sole cause of the reduction in liabilities. Conversely, disinvestments from the Netherlands and Ireland were driven purely by a drop in inward investment, with no significant evidence of intra-group or intra-fellow equity and lending transactions.
- The breakdown of FDI assets and liabilities for SPEs is not available for Ireland. It can be assumed, however, that the strong positive correlation (0.94) between SPE liability flows and inward FDI flows also holds in this country. This statistical regularity, which is obtained from a panel regression on Luxembourg, the Netherlands and Belgium, proves rather stable over time and when computed on a subset of countries. This provides a useful tool to obtain an approximate estimation of SPE flows for countries currently not reporting the breakdown, provided that statistics on inward and outward flows are available. The activity of other resident entities is only marginally related to reverse and inward investments. Finally, gross liability flows of other resident and special purpose entities and reverse and inward investments are unrelated.