


Fiscal policies to mitigate climate change in the euro area
Published as part of the ECB Economic Bulletin, Issue 6/2022.
1 Introduction
Mitigating climate change is a matter of urgency, which requires sustained and comprehensive policy efforts, including implementing fiscal measures. Under the European Green Deal, Member States committed to reducing EU greenhouse gas emissions by 55% – compared with 1990 levels – by 2030 and to reaching carbon neutrality by 2050, in line with the Paris Agreement.[1] Delivering on these commitments will require additional sustained and frontloaded policy efforts in many areas.[2]
Many of these climate change initiatives have a clear fiscal angle. These can be directly linked to fiscal policy, mainly through public spending or taxation, and these can also have an indirect influence on macroeconomic and fiscal outcomes. On the revenue side, the EU emissions trading system (ETS), national carbon taxes and other national environmental taxes, such as excise taxes on fossil fuels, are key climate policies in euro area countries that – directly or indirectly – put a price on carbon emissions. Economic theory suggests that carbon pricing should be a core element of any successful climate change policy. On the expenditure side, green public investment, climate-focused subsidies and transfers to the private sector as well as the withdrawal of environmentally harmful subsidies are among the measures intended to contribute to the green transition by stimulating the use of clean energy, fostering green innovation and improving energy efficiency. In addition, there is an interplay between these different fiscal policies to mitigate climate change and non-fiscal policies, such as regulations to increase energy efficiency.
This article provides an overview of existing, required and expected climate-related fiscal policy measures to accelerate the green transition in the euro area. The article examines the climate-related fiscal measures currently in place, which represent relatively small shares in government revenues and expenditures. The focus is on two potent fiscal instruments, namely carbon pricing and public green investment. Finally, the article discusses compensatory measures to ensure a more equitable green transition.[3]
2 Existing fiscal measures to mitigate climate change
At present, environmental taxes represent only a modest part of total public revenues. While most countries have higher energy taxes than the minimum mandated by the EU Energy Taxation Directive[4], this Directive has not been revised since 2003. Energy taxes in the euro area amounted to 4.8% of total public revenues in 2019 (Chart 1, panel a). Transport taxes generally target the most polluting vehicles through, for instance, higher registration or circulation fees.[5] Transport taxes represented on average around 1.2% of revenues in the euro area in 2019. Furthermore, most energy and transport taxes are not proportional to the greenhouse gas emissions generated.
Emissions trading schemes and carbon taxes explicitly target carbon emissions, although the limited sectoral coverage and initially low permit prices have resulted in limited public revenues. The EU ETS was launched in 2005, and in 2021 it covered 1.73 gigatonnes of CO2-equivalent greenhouse gas emissions from 31 jurisdictions, amounting to 3.2% of the global total.[6] Because of low auction prices for emission permits and the free allocation of permits during the first phases of its implementation, revenues were initially not significant (Chart 1, panel a). The surge in auction prices in 2021 and at the beginning of 2022 has increased revenues. However, the caveat remains that the EU ETS does not cover several carbon-intensive economic sectors, and a large share of emission permits has been given away freely rather than auctioned, to contain the risk of carbon leakage.[7] In addition to the EU ETS, some countries have explicit carbon taxes: Finland’s carbon tax, for example, has existed since 1990. But many of these national taxes tend to be relatively insignificant in terms of emissions coverage and price (Chart 1, panel b). In 2021, Germany introduced a national ETS for the transport and buildings sectors, which are not covered by the EU ETS.
Chart 1
The impact of climate policies in terms of government budget revenue
a) Environmental taxes and EU emissions trading system revenues in the euro area
(percentages of total public revenues)

b) Revenues from national carbon taxes and emissions trading schemes by country
(carbon tax rate in EUR per tonne of CO2 equivalent greenhouse gas emissions; emissions covered as percentages of total emissions)

Sources: Eurostat, World Bank and own calculations.
Notes: Chart 1, panel a shows environmental taxes in 2019 (before the coronavirus (COVID-19) crisis). “Minimum-maximum” represents the euro area country with the lowest and highest share of environmental tax revenues or emissions trading system (ETS) receipts over total revenues. “Average” represents the euro area average share. Chart 1, panel b shows the euro area countries with either an explicit national carbon tax or national emissions trading scheme. Germany’s national ETS was implemented in January 2021. In some countries, certain sectors are subject to both national carbon taxes and the EU ETS (the latter is not included in the chart).
Government investment towards clean energy, energy efficiency of buildings and public transport is limited. Only a quarter of total public investment can be identified as being climate-related (transport, energy and environmental investment), amounting to around 1% of euro area GDP. Transport investment and environmental protection represent the two largest areas of public investment (Chart 2, panel a).
Albeit declining, fossil fuel subsidies still play a role. These subsidies may take the form of tax credits for fossil fuel-producing companies or subsidies to reduce the cost of fossil fuels for the consumer. The IMF distinguishes between explicit and implicit subsidies (Chart 2, panel b). Explicit subsidies occur when there is a negative difference between the fuels’ supply cost and the retail price, when this underpricing is due to direct public support to producers. Implicit subsidies are broader, as they cover externalities related to fossil fuel use, such as climate change, urban pollution and traffic congestion. There are more implicit than explicit subsidies in all euro area countries except Estonia, which presents both the highest level of explicit subsidies and energy tax revenues in the euro area. Several countries continue to explicitly support the use of fossil fuels through fiscal policies, although this amounts to less than 2% of total expenditure.
Chart 2
Climate policies in terms of expenditure
a) Total public investment in the euro area
(percentages of total expenditure and of GDP)
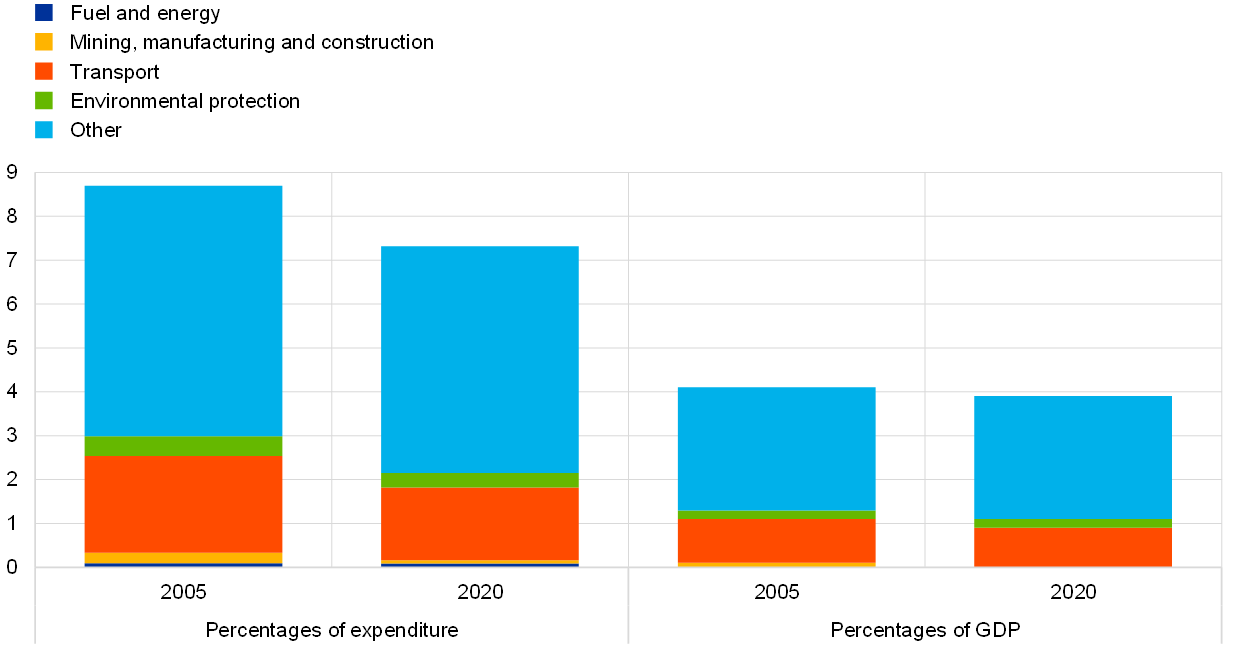
b) Subsidies for the use of fossil fuel
(percentages of total expenditure in 2019)

Sources: Chart 2, panel a: Eurostat (Data from the Classification of the functions of government – COFOG); Chart 2, panel b: Parry, I., Black, S., Vernon, N., “Still Not Getting Energy Prices Right: A Global and Country Update of Fossil Fuel Subsidies”, International Monetary Fund, September 2021, and own calculations.
Note: In Chart 2, panel a, investment includes total capital formation and investment grants.
Box 1
Policy responses to address high energy prices and ensure energy security
Russia’s war in Ukraine has led governments to take fiscal measures to address increased energy prices and has accelerated legislative activity relating to the green transition at the European level. Member States have implemented temporary fiscal measures that are predominantly aimed at helping households.[8] In May 2022 the REPowerEU plan was put forward to safeguard European energy security, which will support the EU’s climate change targets.[9]
Current national fiscal measures are either targeted to the most vulnerable households or broad-based, and have been taken on both the revenue and expenditure sides. On the revenue side, these are mostly related to cuts to value added tax and excise duties on energy, as well as cuts to other taxes or fees related to energy consumption. As it is difficult to target tax cuts to vulnerable households, the bulk of these measures are broad-based. On the expenditure side, some measures are linked to energy consumption in the form of fuel discounts or energy price caps subsidised by the state, or fuel or electricity vouchers which reduce the energy price for consumers. While fuel discounts are provided to all consumers, spending can be targeted in the form of rebates or vouchers to selected households. To avoid incentivising the increased consumption of fossil fuels, direct support on the spending side can also be given as lump-sum payments unrelated to individual energy consumption. Such income support can be targeted to different groups and be adjusted to the individual’s mobility needs. Finally, the state can provide subsidies to substitute energy-consuming activities, such as for the use of public transport.
Energy measures should remain temporary and incentivise energy saving while efficiently addressing the short-term challenges and protecting the most vulnerable households. Both horizontal tax cuts and untargeted transfers are less cost-efficient than spending measures which focus the benefit on the most vulnerable individuals. This is due to the fact that targeted spending measures reduce dead weight losses from subsidising consumers that do not need help. Cost-efficient targeting should account for social criteria and energy needs, as in the case of subsidising individual energy consumption. Finally, measures should incentivise energy saving and be temporary to be consistent with decarbonisation targets. Tax cuts (or exemptions from excise taxes on fossil fuel) and spending to subsidise the use of fossil fuels and carbon-intensive products are problematic, also as they do not incentivise efficient energy use and investment in energy saving. Subsidies should preferably be in the form of lump-sum income support or be linked to individual energy replacements, such as a commuter allowance. Subsidies for public transport or green investments can have a particularly positive impact on energy substitution, but these are difficult to target to vulnerable households.
REPowerEU includes important initiatives to accelerate the green transition. It foresees boosting the roll-out of renewable energies, with the 2030 target for the share of renewables increasing from 40% under the Fit for 55 package to 45%. Actions to reach this higher target include simplifying the permitting procedures for renewable energy projects and frontloading investment to install solar panels on buildings. Moreover, the European Commission proposes to raise the 2030 energy efficiency target from 9% under the Fit for 55 package to 13% and has proposed concrete measures to reach this, such as an accelerated roll-out of high-efficiency heating systems.
This drive for energy independence is likely to change the timeline of carbon emission reduction. Shifting away from Russian fossil fuels will probably involve some of the existing coal capacities in the euro area being used for longer than previously foreseen. This, together with the envisaged sale of additional emission allowances from the market stability reserve – worth €20 billion in total, spread equally over four years – will likely mean that REPowerEU will be detrimental to emission reduction targets in the near term. But, if the proposed measures to promote energy efficiency and renewable energy are fully implemented and become increasingly effective, emissions could fall faster towards the end of the decade.
Improved permitting procedures for renewable energies could give an important boost to the share of clean energy in the total energy supply. Currently, slow and complex permit-granting processes are a key obstacle to the roll-out of renewables. The proposed acceleration of permitting procedures under REPowerEU will be essential for speeding up the energy transition. This includes introducing designated “go-to areas” in which permit-granting deadlines would be limited to a maximum of one year, instead of the current nine years for wind energy projects. This is even more important given that over the past decade the costs of renewable energy technologies have fallen by around 85% for solar panels and by over 50% for wind power, making those technologies a competitive alternative to fossil fuel.
3 Reducing the policy gap and fiscal consequences
To meet the goals of the Paris Agreement, euro area countries need to significantly accelerate their efforts to reduce greenhouse gas emissions. On average, the 2020 EU targets for emission reduction, renewable energy and energy consumption were met, with the economic impact of the coronavirus (COVID-19) pandemic playing a major part. However, considerable additional efforts will be needed to meet the more ambitious 2030 targets, which are the next milestones under the EU Green Deal.[10] Carbon pricing and green investment will have to play a key role to reduce the policy gap and accelerate the green transition.
The role of carbon pricing
Carbon pricing can be a very effective and efficient tool to mitigate climate change. Well-designed and sufficiently high carbon pricing should underpin a successful climate change policy. It provides a continuous incentive for reducing emissions – including through innovation in green technologies – while generating revenues that can be reinvested and used for social transfers. With carbon pricing, in contrast to regulation, companies can make a choice on the level and type of additional efforts they make to cut emissions, which ensures that emissions are cut in the most efficient way and that innovation is incentivised. These advantages of carbon pricing are magnified the larger and more uniform the carbon pricing is across the economy, since more economic agents will then determine their carbon emissions based on carbon pricing.
Effective carbon rates, which provide a useful indicator for the carbon pricing gap, vary widely in the euro area. Effective carbon rates are based on a concept by the OECD that reflects the price of carbon emissions resulting from three different sources: tradeable emission permit prices, carbon taxes and fuel excise taxes. They are calculated for six sectors, covering almost the entire economy.[11] As a consequence of the large heterogeneity in national tax rates and the partial coverage of the EU ETS (Section 2), effective carbon rates vary widely in and between economic sectors in euro area countries (Chart 3) and across countries. While the highest effective carbon rate in some sectors exceeds €300 per tonne of CO2, a large share of carbon emissions is priced at a very low level or not taxed at all. The euro area average effective carbon rate of €77 per tonne of CO2 is above rates in many other countries, but is well below the rate of €120 per tonne of CO2 that would be needed in 2030 to decarbonise by 2050, according to recent estimates.[12]
Chart 3
Effective carbon tax rates in the euro area in 2021

Sources: OECD and own calculations.
Notes: Effective carbon tax rates reflect the price on carbon emissions that results from three different sources, i.e. from tradeable emission permit prices, carbon taxes and fuel excise taxes, and are calculated based on the energy content of different fuel sources. They are calculated for six sectors: road transportation; off-road transportation (excluding international aviation and shipping); industry; agriculture and fisheries; residential and commercial services and electricity generation, based on tax rates on 1 April 2021 and the auction-weighted EU ETS price for 2021. The horizontal axis represents the cumulative total emissions (based on data from 2018, with an adjustment for the German emissions trading system introduced in 2021), divided into the six sectors for which the effective carbon tax is calculated.
Reaching net-zero emissions by 2050 effectively requires a higher level and broader coverage of carbon pricing. The European Commission has made a number of proposals to support this, primarily in the Fit for 55 package. These include extending the scope of the ETS, creating a separate ETS for the buildings and transport sectors, reducing the number of allowances and gradually phasing out the number of freely allocated emissions permits. The package also includes a proposal to revise the Energy Taxation Directive that aims to promote clean technologies and introduce higher levels of taxation for fossil fuels. If adopted, these proposals will likely increase the effective carbon rates and their coverage. On average, an increase of effective carbon rates by €10 per tonne of CO2 is estimated to reduce emissions by 7.3% in the long term.[13] However, this effectiveness also depends on the availability of green technologies and the timeline for tax increases. The short-term effects of a higher effective carbon rate on output and inflation depend on the speed of increase, which sectors see an increase in carbon pricing and how additional tax revenues are used (Box 2).
Box 2
Model-based analysis of the short-term impact of increasing the effective carbon tax on euro area output and inflation
This box presents a model-based analysis of the short-term impact of increasing effective carbon rates on euro area output and inflation in two scenarios.[14] The “gradual carbon pricing” scenario assumes a steady and linear increase of the average effective carbon rates to €120 per tonne of CO2 by 2030 in all sectors except road transportation, for which an increase to €200 per tonne of CO2 is assumed.[15] The “frontloaded carbon pricing” scenario assumes a steeper increase in effective carbon rates, which is equal across all sectors (around €18 per tonne of CO2 per year), reaching levels consistent with the net-zero target by 2024.
The macroeconomic implications of the increase in the effective carbon rates are considered through two transmission channels: taxation of household consumption and firms’ energy inputs. The macroeconomic implications are evaluated using the ECB’s New Multi-Country Model (NMCM), which is well-suited to analysing short-term developments around the three-year baseline projection horizon.[16] While the NMCM neither features an explicit role for the energy input into production nor the taxation of energy input, it is still possible to map the effective rate instrument onto two different channels. First, consumption taxation is modelled as a conventional value added tax shock directly affecting household consumer prices. The second channel, which represents carbon pricing for firms, is modelled as a shock on imported energy,[17] which indirectly feeds into final consumer prices. The mapping of the channels is based on the six sectors for which the effective carbon tax rates are calculated.[18]
The results point to limited but non-negligible macroeconomic effects from a gradual increase in effective carbon rates, and considerably stronger effects under the second scenario with a more frontloaded increase in carbon pricing. Because households already face relatively high implicit carbon taxes (mostly on road transport), the gradual carbon pricing scenario largely means additional input pricing costs for firms. The simulations imply a pass-through from producer costs and prices onto final consumer prices, which results in HICP inflation being around 0.15 percentage point higher per year (Chart A, panel b). The increased energy costs are transmitted towards HICP excluding energy inflation as well. The second scenario, however, shows more sizeable increases in HICP inflation of over 0.4 percentage point in 2022-23 and 0.3 percentage point in 2024.[19] This is partly owing to the input channel playing a stronger role compared with the first scenario, but also due to a stronger increase in the consumption taxation paid by households than in the first scenario. The more sizeable nominal impact in the second scenario, which triggers real income losses and therefore a decline in consumption, translates into a strong GDP decrease of 0.5% by 2024 without fiscal measures (Chart A, panel a).
Chart A
Impact of an increase in effective carbon taxes on the euro area economy
a) GDP level
(percentage point deviations from baseline level)
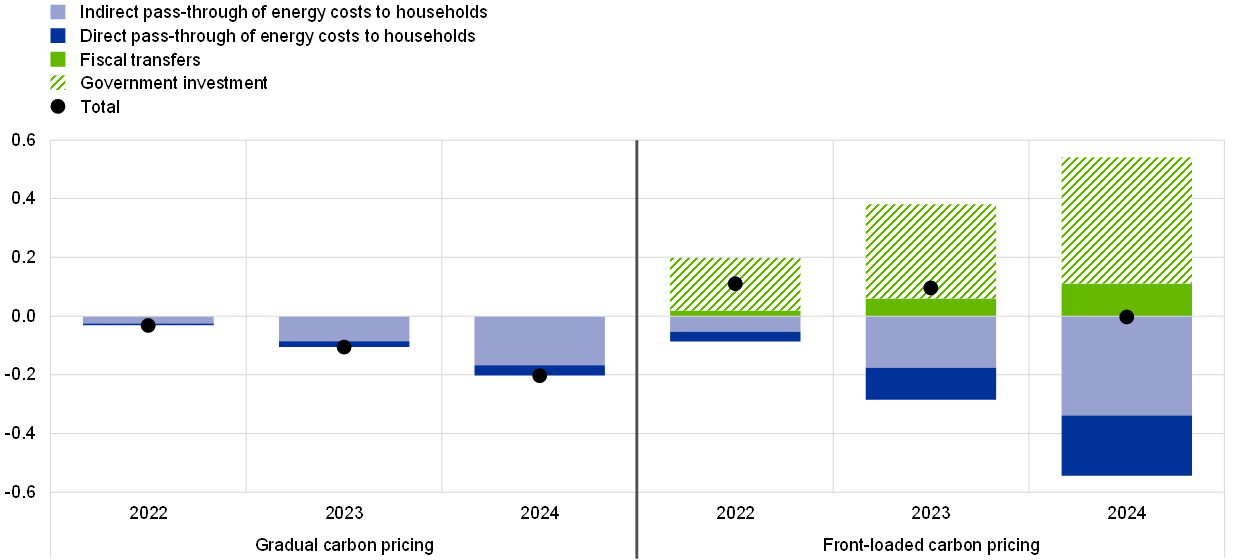
b) HICP inflation
(percentage point deviations from baseline growth rates)
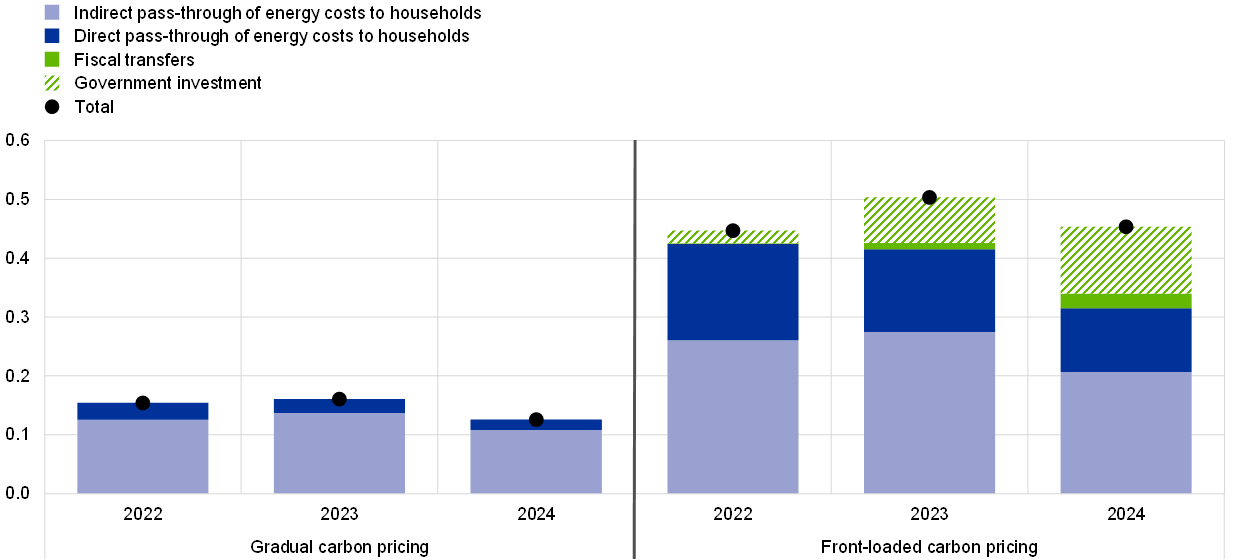
Sources: OECD and ECB calculations.
Notes: The simulations are based on the ECB’s New Multi-Country Model (NMCM). In the “frontloaded carbon pricing” scenario, the amount of transfers to households equals the revenues collected from taxes paid by consumers. The amount of government investment equals the revenues collected from the carbon taxes paid by firms. The simulations are conducted under exogenous monetary policy, without automatic fiscal stabilisers, and without additional trade spillovers.
Recycling the additional revenues could mitigate the output effects but would increase the inflationary impact of increasing effective carbon taxes. Instead of debt reduction, as simulated in the first scenario, governments could use the additional carbon tax revenues to reduce other taxes or to increase other expenditures. We simulate the recycling of fiscal revenues in the second scenario in the form of transfer payments back to the household sector and as government investment. This would counteract the negative impact on output but would amplify inflationary effects through additional demand (Chart A, panel a). If the tax revenues from higher effective carbon rates were used to lower other indirect taxes on goods and services, this would reduce the upward pressure on inflation and the downward pressure on output.
These results can be considered as an upper bound for the short-term impact on output and inflation of increasing effective carbon rates. The exercise relies on several assumptions. First, the exercise strongly simplifies the complexity of actual energy cost transmission through the production chain and to households, with possibly strong heterogeneity across countries and sectors.[20] Second, the exercise assumes that the policies are introduced during the relatively short period analysed here. However, there is currently uncertainty regarding the timing of the implementation of EU policy proposals to reach net zero by 2050 and the stringency of carbon prices. In particular, the “frontloaded carbon pricing” scenario is more ambitious than current policy proposals. Third, while the scenarios assume a decline in emissions that is in line with meeting EU targets, potential responses of economic agents to the increase in carbon prices are not explicitly modelled. Finally, this analysis does not consider the potential impact of global climate policies on energy commodity prices.
The role of public investment
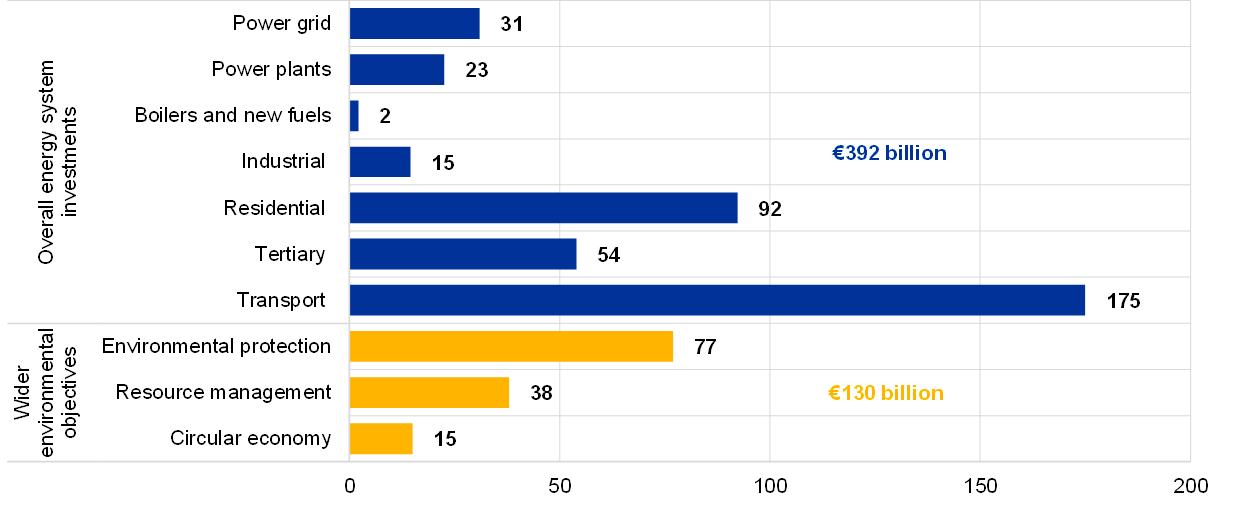
To support the transition to a low-carbon economy, substantial additional green investment will be needed. The European Commission estimated the additional public and private green investment needs in the EU at around €520 billion per year (around 3.7% of 2019 GDP) over the period 2021-30.[21] This includes annual additional investment in energy systems of around €390 billion, which corresponds to an increase of 57% compared with the average annual investment spending between 2011 and 2020 (Chart 4, panel a).[22] These estimates are based on the assumption of higher carbon pricing and a moderate increase in energy efficiency, renewable energy and green transport policies to reach the CO2 emission reduction target of 55% by 2030. The total investment needs also include €130 billion per year to meet wider environmental objectives such as environmental protection and resource management.
The largest energy investment gaps are found in the building and transport sectors. The European Commission identified most of the additional annual investment needs to foster energy efficiency in the transport sector (€175 billion) and in the residential buildings sectors (€92 billion) (Chart 4, panel a).[23] The additional investment needs identified in the renewable energy sector (power grid and plants) amount to €54 billion, while this will need to be scaled up further to account for the more ambitious renewable energy target under REPowerEU.[24]
Green investment needs differ across countries. Based on countries’ self-reported National Energy and Climate Plans (NECPs) for the period 2021-30, the annual investment gap ranges from 7% of GDP in Portugal to well below 1% of GDP in Finland (Chart 4, panel b). However, the investment needs set out in the NECPs would need to be scaled up to account for the more ambitious 55% emission reduction target by 2030, as they were made before the target was revised.
Chart 4
Green investment gap
a) Sectoral breakdown of energy system investment gap in the EU
(EUR billions, annually for the 2021-30 period)
b) Green investment needs by category in euro area countries
(percentages of GDP, annually for the 2021-30 period)

Sources: Chart 4, panel a: European Commission (2021a and 2021b); Chart 4, panel b: European Investment Bank and the 2019 euro area National Energy and Climate Plans (NECPs).
Notes: The additional investment needs for energy systems are projected compared to the 2011-20 average investment levels and for the wider environmental objectives compared to 2016 levels. REPowerEU investment plans are not included. Panel b is based on the 2019 National Energy and Climate Plans (NECPs).
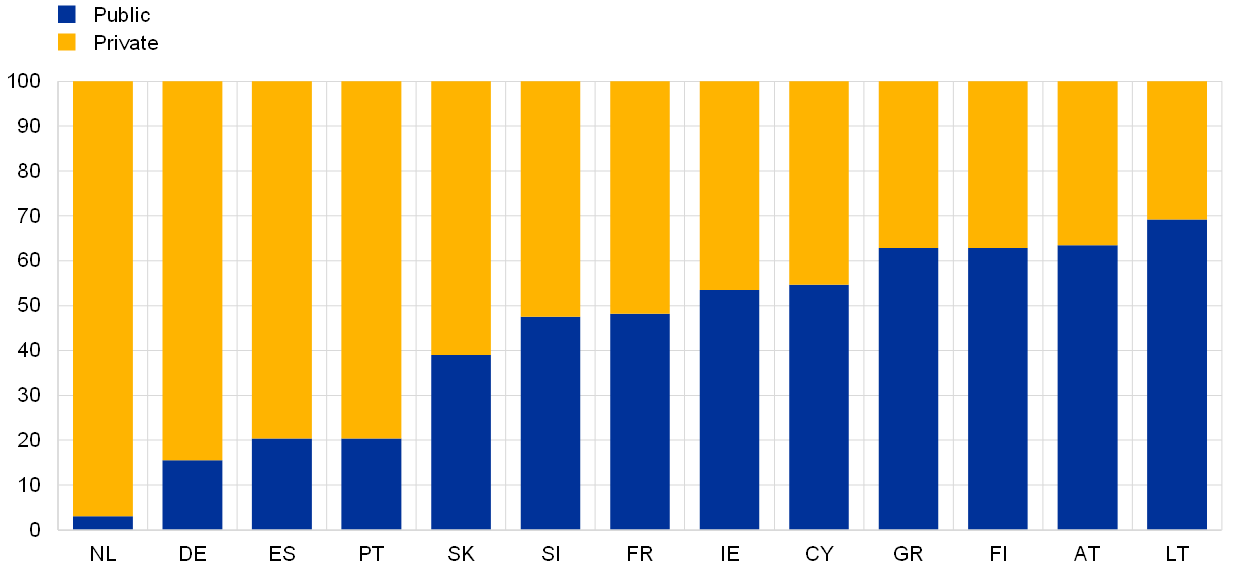
The public sector has a crucial role to play in supporting these investment needs. Although the largest share of the additional green investment will need to be provided by the private sector, the public sector will have to act as a catalyst for the transition. This could either be through direct public investment or through other means such as co-financing, private-public partnerships or state guarantees. Moreover, investing in research and development would facilitate innovation in clean technologies.[25] Based on the NECPs, the unweighted share of public green investment amounts to 45% of total additional green investment needs in the EU on average, but there are large discrepancies across countries (Chart 5).[26] Based on this share and if adjusted for the more ambitious 2030 target, between 1% and 1.8% of EU GDP would be required in annual additional green public expenditure in the period 2021-30. One proposal to incentivise governments to increase green investment spending is to implement a green golden rule (Box 3). Ways of mobilising additional private resources would involve advancing the EU’s sustainable finance framework and pushing for a green capital markets union.
Chart 5
Public and private sources of additional green investment needs
(percentages of total, averages for the 2021-30 period)
Source: European Investment Bank
Notes: The data are based on the euro area National Energy and Climate Plans (NECPs) from 2019 to reach the 40% emission reduction target by 2030. No data are available for the more ambitious 55% target. Data on the breakdown between public and private investment are not available for all euro area countries.
While NextGenerationEU (NGEU) will contribute to the financing of green investment needs, its share is limited in scope and duration. Green investment financed through NGEU will account for around 5% of the estimated total green investment required to meet the EU’s 2030 climate target.[27] Based on the recovery and resilience plans (RRPs), the total amount requested for climate measures is €159 billion for the euro area countries (i.e. 1.3% of euro area GDP in 2019 and slightly below 40% of the recovery and resilience facility funds requested so far).[28] There are large differences across Member States in GDP terms, ranging from more than 5% in Greece to less than 0.5% in Germany (Chart 6, panel a). As regards policy areas, on average around 75% of available resources will be devoted to sustainable mobility, energy efficiency and clean energy and networks (Chart 6, panel b).
Chart 6
Green elements of the recovery and resilience plans
a) Amount requested in the RRPs for climate measures per country
(percentages of GDP in 2019, period 2021-26)

b) Expenditure towards climate objectives in the RRPs per policy area and country
(percentages of total expenditure, period 2021-26)

Source: European Commission.
Notes: The recovery and resilience plans (RRPs) are shown for all euro area countries, except for the Netherlands, where it had not been endorsed by early August 2022. “Other climate measures” includes expenditures on, for example, research and development, transitioning to a circular economy and green skills and jobs.
Box 3
Can green golden rules help to close the green investment gap?
Proposals for green golden rules aim to stimulate green public investment in the EU while respecting fiscal sustainability.[29] Under a green golden rule, green public investment spending would be exempted from the fiscal rules under the Stability and Growth Pact (SGP).[30] This box reviews the main arguments for and against introducing green golden rules to foster green public investment.
Several arguments have been raised in favour of the proposal. First, excluding green investment expenditures from the SGP framework may incentivise countries to invest more in green projects. While climate change is a global phenomenon, green public investment spending is undertaken on the national level. Governments may have little incentive to internalise the negative externalities of climate change, which may result in underinvestment in green projects. This may be particularly pertinent for countries with limited fiscal space. Second, green golden rules may help to address a time inconsistency problem: the economic losses of inaction today will rise exponentially and may fully materialise only decades later, although their magnitude is uncertain.[31] Yet, incentives to frontload green public investment, if financed by taxing today’s voters for the benefit of those of tomorrow, risk receiving little electoral support.[32] Third, green public investment can stimulate green private investment, for example through network effects such as charging points for electric cars. It can therefore help to overcome the financing gaps for green innovation.[33] Fourth, green investment could ultimately facilitate fiscal sustainability if it contributes to higher growth in the medium to long term and reduce the economic losses resulting from climate change.[34]
However, several factors speak against using golden rules for green public investment. First, identifying green investment projects relies on an effective green taxonomy. This would be crucial to limit the risk that governments declare current spending as green investment (“greenwashing”). Second, it is difficult to determine the optimal level of green public investment, which depends on the interplay between private investment and other fiscal instruments, such as carbon pricing or green subsidies. Green golden rules may even limit incentives for policymakers to foster carbon pricing. Third, green golden rules may reduce incentives for governments to make efforts to reprioritise spending within the available budgetary space, including the need to cut spending that is environmentally harmful.[35] This then may pose risks to debt sustainability. Fourth, a green golden rule would make the SGP framework more complex, as exceptions from the fiscal rules would need to be specified.
On balance, green golden rules would need to be carefully designed. While they may stimulate additional green investment, they may pose challenges for fiscal sustainability.[36] The rules are unlikely to be implemented quickly and a number of conditions would need to be met for them to be successful.[37] First, green public investment will need to be accurately identified and quantified. Besides better green budgeting, it also requires a common and precise definition of investment categories (e.g. house insulation, charging points for electric cars) to be acknowledged up to a certain limit under the fiscal rules. Second, green golden rules should go hand-in-hand with cutting environmentally harmful subsidies. Third, to incentivise the frontloading of green public investment while maintaining fiscal sustainability, green golden rules should be time-limited. Finally, independent experts should assess the design and application of green golden rules to limit the risk of greenwashing.
4 Distributional aspects of carbon pricing
When designing climate policies it is important to also consider their distributional effects.[38] While carbon pricing policies are widely seen as being environmentally effective and economically efficient, their distributional implications are not straightforward.[39] In fact, different channels are at play, with direct and indirect distributional consequences. Carbon pricing affects households through higher purchase costs of carbon-intensive products. This has direct distributional effects depending on the extent to which households’ consumption baskets and their marginal propensity to consume differ across income groups.[40] Low-income households will be disproportionally affected in case of a regressive carbon tax, as they tend to dedicate a larger share of their disposable income to carbon-intensive products.[41] At the same time, higher-income groups tend to have a larger carbon footprint per capita than low-income groups. This is often labelled “carbon inequality” and concerns in particular consumption related to transport and housing (Chart 7).[42]
Chart 7
Carbon footprint in the EU by income group
(tonnes of CO2 per capita, 2019)

Sources: Ivanova and Wood (2020), op. cit. and own calculations
Notes: Data are shown for income quintiles in the EU countries, with “1” being the lowest and “5” the highest income group. The sequence of the consumption items is based on the carbon footprint of the lowest income group.
The overall distributional impact of carbon pricing also depends on indirect effects. The effects on employment and economic wealth (via labour income, transfers or savings) vary by income group. Low-income groups may experience a stronger fall in their income as they tend to work in sectors that are more affected by changes in demand. One study finds that indirect effects account for 80% of the regressive impact of a carbon tax.[43] Other studies, however, point to indirect effects having a progressive impact in Europe.[44]
Introducing carbon tax rebates for vulnerable groups can mitigate the regressive impact, while being budget-neutral. Redistributing carbon revenues can mitigate the regressive impact without compromising on emission reductions. There are several ways of rebating carbon revenues, each with different effects. Research analysing the welfare effects in the United States of lump-sum rebates as well as cuts in payroll taxes, personal income taxes and corporate income taxes shows that recycling via lump-sum can be very progressive for low-income households.[45] Others argue that using carbon revenues for public investment may be preferable to lump-sum redistribution, as it has a more positive impact on economic efficiency.[46] Overall, compensatory measures ought to be efficient, well targeted and temporary to limit distortions.
Compensatory measures may ensure broader public support towards climate change policies. Such public support may help to decarbonise the economy indirectly. To further support public acceptance of carbon pricing, the European Commission proposed a Social Climate Fund that aims for a socially just transition.[47] In addition, accompanying structural policies may be supportive to manage the short-term adjustment costs related to the green transition.
5 Concluding remarks
Additional policy measures are needed in the euro area to mitigate the impact of climate change. Climate change will have lasting and serious environmental and economic consequences for the whole world. The long-term global social, economic and fiscal costs of a delayed transition are likely to exceed the potential short-term costs of efficient and effective climate change policies today by a large degree. To be effective in mitigating climate change, all regions, including Europe, will need to make progress in the green transition.
Euro area countries have set ambitious Paris-aligned climate targets within the framework of the EU Green Deal. Many of the measures needed to achieve this goal will involve a fiscal approach. Adopting an efficient and effective mix of climate-related fiscal policies will be necessary to ensure energy security and accelerate the green transition. Moreover, the current geopolitical situation has demonstrated how important it is for Europe to reduce its dependence on fossil fuel.
The choice of the climate policy mix determines the impact on public finances. This impact depends firstly on what kind of fiscal and other climate policies are chosen. In this regard, carbon pricing and public or private green investment, regulation and permission processes for private investment in renewable energies are particularly important.
Within fiscal policies, the balance between revenue and expenditure policy is pertinent. Carbon pricing is a very effective and efficient way to reduce carbon emissions while also providing additional revenues that can be used for public debt reduction, targeted compensatory social measures or alternative expenditure, including supporting the green transition. Expenditure-based policies – such as green public investment, subsidies for private investment and green research and development – increase countries’ deficits, at least in the short term, unless this is covered by additional revenues or by offsetting expenditure cuts, including to environmentally harmful subsidies. Given the magnitude of the climate crisis, the limited scope of current green technologies and the distributional impact of carbon pricing, a mix of revenue and expenditure policies will be needed.
Successful mitigation policies affect tax bases. The more successful carbon pricing is in reducing carbon emissions, the more the carbon tax base will shrink over time. Therefore, temporarily higher carbon or environmental tax-related revenues should not be earmarked for permanent spending measures. Similarly, expenditure policies such as investment programmes or green subsidies should be frontloaded and match the time needed to speed up the green transition, rather than be open-ended.
European Commission, The European Green Deal, Communication and Annex, December 2019.
The European Commission has submitted a set of proposals to bring the respective EU policies up to par for reducing net greenhouse gas emissions by at least 55% by 2030, compared with 1990 levels, in the Fit for 55 package. See European Commission, ‘Fit for 55’: delivering the EU's 2030 Climate Target on the way to climate neutrality, July 2021.
Measures to adapt to the impact of climate change, which also have a strong fiscal angle, fall outside the scope of this article.
Council Directive 2003/96/EC of 27 October 2003 restructuring the Community framework for the taxation of energy products and electricity (OJ L 283, 31.10.2003), p. 51.
European Commission, Directorate-General for Mobility and Transport, El Beyrouty, K., Gatto, M., Essen, H. et al., Transport taxes and charges in Europe: an overview study of economic internalisation measures applied in Europe, European Commission, 2019.
See the box entitled “EU emissions allowance prices in the context of the ECB’s climate change action plan”, Economic Bulletin, Issue 6, ECB, 2021. The jurisdictions participating in the EU ETS are the EU countries, Iceland, Liechtenstein, Norway and the United Kingdom.
Carbon leakage refers to the displacement of business to jurisdictions with laxer emissions constraints to avoid costs. This phenomenon reduces the impact of climate policies on global emissions.
See the box entitled “Euro area fiscal policy response to the war in Ukraine and its macroeconomic impact”, Economic Bulletin, Issue 5, ECB, 2022.
See REPowerEU plan, Communication and Annexes, European Commission, May 2022.
Trends and projections in Europe 2021, European Environment Agency, October 2021.
These sectors comprise industry; electricity; agriculture and fisheries; residential and commercial services; off-road transportation and road transportation.
See OECD, Taxing Energy Use 2022, forthcoming. In earlier studies, the OECD considered €30 per tonne of CO2 as the historic low-end benchmark and €60 per tonne of CO2 as the low-end estimate for carbon costs in 2030. The IMF has advocated for a carbon price floor of USD 75 per tonne of CO2 for advanced economies. See IMF Fiscal Monitor, IMF, April 2022.
D’Arcangelo, F., Pisu, M., Raj, A. and Van Dender, K., “Estimating the CO2 emission and revenue effects of carbon pricing: new evidence from a large cross-country dataset”, OECD Economics Department Working Paper Series, forthcoming.
This exercise gauges inflationary pressures which abstracts from endogenous monetary policy responses by the central bank.
See Section 3.1. and footnote 12. A higher tax floor is considered for the road sector, as the effective carbon rate is already above €120 per tonne of CO2 and because some of the EU policy proposals imply further increases.
Dieppe, A., González Pandiella, A., Hall, S. and Willman, A., “Limited information minimal state variable learning in a medium-scale multi-country model”, Economic Modelling, Vol. 33, Issue C, 2013.
The carbon price in this sense can be thought of as a tax on the value of fossil resources, where the euro area is assumed to be fully reliant on imports. In the model, fossil resources trigger a pricing effect alone: higher import prices then lead to a loss of households’ purchasing power and therefore a decrease in the consumption of goods.
The industry, agriculture and fisheries and off-road transportation sectors are considered relevant for firms’ taxation, and the road transportation sector is linked to household consumption. The tax increase from residential and commercial services and electricity production is split between households and firms, based on their relative energy consumption in these sectors, with households accounting for 75% of emissions from residential and commercial services, and 25% of emissions from electricity production.
These figures do not include the impact of fiscal measures such as fiscal transfers or government investment.
Cross-country differences in the pass-through depend on differing shares of primary energy sources, the importance of different industries across regions and the legal and contractual frameworks around pricing in the electricity market.
See The EU economy after COVID-19: implications for economic governance, European Commission, October 2021 and Impact assessment for the revision of the Renewable Energy Directive, European Commission, July 2021.
These estimates may underestimate the investment needs, as they do not include further investment in adaptation (for example, due to a higher frequency of extreme weather events). Also, they do not include the investment needs for decreasing dependence on fossil fuels as part of REPowerEU.
See European Commission (2021b), op. cit.
For more details on REPowerEU, see Box 1.
See Aghion, P., Boneva, L., Breckenfelder, J., Laeven, L., Olovsson, C., Popov, A., and Rancoita, E., “Financial markets and green innovation”, Working Paper Series, ECB, July 2022.
The GDP-weighted share of public green investment amounts to around 25%. This is similar to the estimates for additional public green investment of between 0.5% and 1% of EU GDP, which assume that only 28% of green investment will be supplied by the public sector, in Darvas, Z. and Wolff, G., “A green fiscal pact: climate investment in times of budget consolidation”, Policy Contribution, Vol. 18, Bruegel, 2021.
It is assumed that the amount is distributed linearly over the course of the six-year programme (2021-26).
This is well above the required 37% of the total allocation to support the climate objectives.
See for example Claeys,G., Tagliapietra, S., and Zachmann, G., “How to make the European Green Deal work”, Policy Contribution, Vol. 13, 2019 and Darvas, Z. and Wolff, G., op. cit.
The SGP does not include a golden rule, as the practical drawbacks of having a general exception of public investment from the fiscal rules were considered greater than its benefits. For a discussion of implementing a golden rule, see Balassone, F. and Franco, D., Public Investment, the Stability Pact and the ‘Golden Rule’, Fiscal Studies, Vol. 21, No 2, 2000.
See Intergovernmental Panel on Climate Change, Impacts, adaptation and vulnerability, February 2022.
The welfare gains from debt-financed green investment are modelled in Kotlikoff, L., Kubler, F., Polbin, A., Sachs, J., and Scheidegger, S., “Making carbon taxation a generational win win”, National Bureau of Economic Research Working Paper, No 25760, 2019.
See Aghion, E. et al., op. cit., in which it is argued that the green transition depends on green innovation, venture capital and government support.
Studies that compare green versus conventional investments find comparable fiscal multipliers (see Batini, N., Melina, G., di Serio, M. and Fragetta, M., "Building Back Better: How Big Are Green Spending Multipliers?”, IMF Working Papers, Vol. 87, 2021). To the extent that green investment replaces rather than expands the existing capital stock, the long-term effect on output would be less significant. The green transition may also have a dampening impact on economic growth in the case of substantial stranded assets. See Pisani-Ferry, J., “Climate policy is macroeconomic policy, and the implications will be significant”, Policy Brief, No 21-20, August 2021.
According to the European Commission, fossil fuel subsidies in the EU amounted to 0.4% of GDP in 2019. See the Annex to the Report from the Commission to the European Parliament, the Council, the European Economic and Social Committee and the Committee of the Regions - 2021 report on the State of the Energy Union - Contribution to the European Green Deal and the Union’s recovery, European Commission, October 2021.
Green golden rules are seen as equivalent to the proposal of a central green investment fund providing loans to finance green investment. See Darvas, Z., “A European climate fund or a green golden rule: not as different as they seem”, Bruegel Blog, February 2022.
For a discussion about the legal feasibility of green golden rules, see Corti, F., Alcidi, C., Gros, D., Liscai, A. and Shamsfakhr, F., “A qualified treatment for green and social investments within a revised EU fiscal framework”, CEPS Research Report, No 2022-02, May 2022.
Climate change also has distributional effects. Climate vulnerability was found to affect income distribution in developing countries seven times more strongly than in advanced economies, as the former tend to have weaker capacities for adapting to the consequences of climate change. See Cevik, S. and Jalles, J., “For Whom the Bell Tolls: Climate Change and Inequality”, IMF Working Paper, Vol. 103, May 2022.
This relates to the concept of a “triple dividend”, in which climate-related policies should not only be effective in reducing carbon emissions and be efficient for the economy, but their impact should be equitable across income groups.
For a discussion on the distributional effects of higher energy prices, see Battistini, N., Di Nino, V., Dossche, M. and Kolndrekaj, A., “Energy prices and private consumption: what are the channels?”, Economic Bulletin, Issue 3, ECB, 2022.
See Andersson, J. and Atkinson, G., “The distributional effects of a carbon tax: The role of income inequality", Centre for Climate Change Economics and Policy Working Paper, No 378, September 2020, in which it is found, for example, that the carbon tax on transport fuel introduced in Sweden in 1991 is regressive when measured against annual income. The regressive impact is stronger in rural areas compared to urban areas.
See Ivanova, D. and Wood, R., “The unequal distribution of household carbon footprints in Europe and its link to sustainability”, Global Sustainability, Vol. 3, Cambridge, 2020.
See Känzig, D., “The unequal economic consequences of carbon pricing”, London Business School, January 2022.
See, for example, Landis, F., Fredriksson, G. and Rausch, S., “Between- and within-country distributional impacts from harmonizing carbon prices in the EU”, Energy Economics, Vol. 103, 2021.
See, for example, the discussion in Goulder, L., Hafstead, M., Kim, G. and Long, X., “Impacts of a carbon tax across US household income groups: What are the equity-efficiency trade-offs?”, Journal of Public Economics, Vol. 175, July 2019 and in Rausch, S., Metcalf, G., and Reilly, J., “Distributional impacts of carbon pricing: a general equilibrium approach with micro-data for households”, NBER Working Paper, No 17087, May 2011.
See Vona, F., “Managing the Distributional Effects of Environmental and Climate Policies: The Narrow Path for a Triple Dividend”, OECD Environmental Working Paper, No 188, December 2021.
The EU Social Climate Fund, as part of the proposed Fit for 55 package, aims to support vulnerable households directly through temporary income support and indirectly through measures and investment that help to strengthen energy efficiency and decarbonisation in the building and transport sectors. The Fund will be financed by 25% of the ETS revenues stemming from the proposed ETS for the buildings and transport sectors over the period 2026-32, with an estimated total amount of €72 billion.