
This biennial report provides a quality review of the national balance of payments (b.o.p.), international investment position (i.i.p.) and international reserves template of the Eurosystem (international reserves), as well as the associated euro area aggregates.[1] The report fulfils the formal requirement for the Executive Board of the European Central Bank (ECB) to inform its Governing Council of the quality of these statistics, as set out in Article 6(1) of Guideline ECB/2011/23 (hereinafter the “ECB Guideline on external statistics”).[2] Furthermore, the report provides information supporting the macroeconomic imbalance procedure (MIP) data quality assurance process, as laid down in the “Memorandum of Understanding between Eurostat and the European Central Bank/Directorate General Statistics on the quality assurance of statistics underlying the Macroeconomic Imbalance Procedure” (“the MoU”).
The main principles and elements guiding the production of ECB statistics are set out in the ECB Statistics Quality Framework (SQF)[3] and quality assurance procedures, which are published on the ECB’s website. This report therefore provides a quality analysis of the statistical output covering the elements of: (i) methodological soundness; (ii) timeliness; (iii) reliability and stability; (iv) internal consistency (completeness and validation, and net errors and omissions); (v) external consistency/coherence with other comparable statistical domains (euro area accounts, foreign trade in goods statistics, monetary financial institutions (MFIs) balance sheet items, money market funds, investment fund and securities holdings statistics) and (vi) asymmetries (intra-euro area and bilateral asymmetries).
The descriptive and quantitative indicators used throughout this report are based on quarterly and monthly data transmitted up to 22 October 2021. The last reference period included in the analysis is the second quarter of 2021/June 2021. Supporting tables/charts are included in Annex 1, while details of how the indicators are computed can be found in Annex 2.
Given the specific MIP requirements and the responsibilities entrusted to the ECB under the MoU, Box 1 presents some indicators relating to the fitness for purpose of the data for all EU countries. The box draws on annual data up to 2020 and revisions up to 2019 and focuses on the following quality dimensions: (i) data availability; (ii) revisions; (iii) errors and omissions; and (iv) external consistency with sector accounts.
Statistical developments between 2019 and 2021
In compiling their statistics, the euro area countries followed the sixth edition of the International Monetary Fund’s (IMF’s) Balance of Payments and International Investment Position Manual (BPM6) and the respective ECB data guidance and requirements.
In terms of the ECB requirements, in March/April 2021 the first quarterly data transmission of the new time series under the amended ECB Guideline on external statistics[4] was successfully accomplished within the deadline set, thus meeting a key milestone in the medium-term strategy on external statistics. The amended Guideline addressed many of the most pressing user needs in terms of sector, instrument, currency and geographic details, as well as increasing the national publishable subset. The first release of new details of euro area aggregates, as well as newly available series of the national publishable subset, is planned for 2022. In parallel, a roadmap for the provision of harmonised back data under the amended ECB Guideline on external statistics has been developed. It lays out a path for compiling euro area aggregates for the main series starting from the Q1 2013 reference period, to be provided by September 2024, at the latest. Ahead of this deadline, Italy, Latvia, Luxembourg, Portugal, Slovenia and Finland have already provided the full set of harmonised back data requested by the roadmap, starting from Q1 2013.
In addition, efforts are ongoing to improve the monthly b.o.p. statistics given the increasing frequency with which ECB decision-making bodies need to take decisions that call for data with higher frequency. A survey on the sources and methods used for the compilation of national monthly b.o.p. contributions to the euro area aggregates revealed areas with scope for improvement as well as best practices for the compilation of specific b.o.p. items and statistical methods. The ECB is organizing seminars to exchange experiences and plans to share the information on best practices with countries to support them in implementing similar approaches with a view to overcoming their existing deficiencies.
Efforts continued within the ESCB to improve the collection of special-purpose entities (SPEs) statistics with the aim of including the transmission of separate series for SPEs in the new amendment to the ECB Guideline on external statistics, in 2022. Data collection for SPEs is expected to begin in March 2023 with reference data for Q4 2022, and preliminary back data from Q1 2020 onwards, to be provided by September 2023 at the latest.
Within the European System of Central Banks (ESCB), the Working Group on External Statistics (WG ES) and the Working Group on Financial Accounts and Government Finance Statistics (WG FGS), along with other sub-structures of the Statistics Committee (STC), are working closely together on the following common issues:
- eliminating the remaining inconsistencies between the national b.o.p/i.i.p. and the rest-of-the-world account and supporting the review of the System of National Accounts (SNA)/BPM by participating in the preparation and/or discussion on the Guidance Notes (GN);
- addressing the main challenges for the collection and compilation of data on unlisted equity (comprising unlisted shares and other equity) with the joint Virtual Group on Unlisted Equity;
- proceeding with follow-up work on the recommendations of the Task Force on Financial Derivatives (TF FD), in particular through the development of national action plans based on a common template.
Improvements to data quality have been made by some countries in capturing the activities of SPEs (Cyprus, Luxembourg and the Netherlands). Data quality has also improved in Italy for the recording of households’ foreign asset holdings, with the data coverage now extending back to 2013. Ireland has improved the compilation of data for financial derivatives for financial corporations from Q2 2019 onwards, while most of the EU countries plan to make improvements in the compilation of financial derivates data in 2022. Germany has implemented the residual method to compile positions of equities under portfolio investment liabilities, updating the current method based on accumulated b.o.p. transactions dating back to 2005. Conversely, these data quality improvements mostly explain the revisions in those countries.
Notwithstanding, there is still room for further improvement in the various quality dimensions analysed in this report. In terms of methodological soundness, Malta still faces certain challenges to improve the general quality of data and reach an acceptable rate of coverage for SPEs. Luxembourg needs to continue its work to close the gap as regards resident captive financial institutions, and Cyprus and the Netherlands to improve the geographical allocation of counterparties. With regard to services, particularly financial services, several countries still do not record service margins on buying and selling financial assets. Furthermore, national compilers should in general continue their efforts to improve the coverage of assets held abroad by resident households.
In terms of the functional classification, a number of countries are not yet able to classify as direct investment (the appropriate functional category) transactions and related positions in debt securities between companies engaged in a direct investment relationship. Furthermore, Greece, Spain, Luxembourg, and the Netherlands continue to record trade credits between companies in a direct investment relationship under other investment instead of under direct investment.
With regard to timeliness, only a few instances of non-compliance occurred more than once. Countries that have failed to comply should put in place contingency measures to ensure that such situations are not repeated. For completeness, Malta should take the necessary steps to provide good quality breakdowns in line with the amended ECB Guideline on external statistics and full details of the reconciliation of stock and flows. France should provide information on single major events on a continuous basis to increase both transparency and the analytical value of the data for policy use.
Concerning internal consistency, a large majority of countries provide the ECB with fully consistent data. However, Belgium and Malta still have work to do to improve reconciliation between quarterly positions and flows, and Ireland and the Netherlands need to improve the consistency of monthly and quarterly data.
With regard to consistency/coherence with other datasets, b.o.p./i.i.p. data are in line with other datasets overall, thus ensuring comparability across statistical domains. However, it is of utmost importance that all countries follow the agreed steps to ensure full consistency vis-à-vis balance sheet items (BSI) statistics and sectoral accounts. In terms of other datasets, the ECB encourages b.o.p./i.i.p. colleagues to interact with their counterparts to structurally reduce discrepancies and/or to reconcile and document differences between datasets where there are objective methodological differences.
Table 1 below provides a list of notable issues affecting certain euro area countries as well as the scope for improvement, based on the analysis set out in the following chapters.
Table 1
Notable issues and scope for improvement (for euro area countries)


Table notes:
1) In accordance with the BPM6 standards, margins on buying and selling financial assets should be included in the service account. However, due to the complexity of including this item in the accounts, the WG ES, in cooperation with other international organisations, has investigated approaches to defining best practices by providing specific guidance to enhance the estimation of this financial service. The outcome did not reach a sufficiently clear conclusion and the methodological work now continues as part of the BPM6 update. Latvia made a research of this issue in relation to the GNI transversal reservation and concluded that the service margins are negligible, and it is not reasonable to develop any procedure.
2) The implementation of the full accrual principle in the portfolio investment liability might take further time, owing to the complexity of the issue.
3) Germany assesses that intra-group financing via debt securities is a phenomenon almost non-existing.
4) France assumes intra-group financing via debt securities to be close to non-existent. Changing this assumption would be costly for an overall negligible impact on the overall balance of payment.
5) Latvia has improved the estimation models by integrating SHS data and by using BIS mirror data and mirror data on real estate.
6) This also applies to the Central Bank of Malta, in terms of completeness and validation checks. Malta has started to report these data, but further efforts are required to achieve a complete and validated dataset.
Statistical issues affecting MIP indicators
The ECB, in collaboration with Eurostat, has continued to monitor specific quality aspects of the statistical outputs, as required under the MoU. In fact, some of the quality dimensions addressed in the report are also relevant for assessing the quality of data for MIP purposes (e.g. methodological issues A1 to A11, E1, F1, and J1 in Table 1). Some recommendations, such as those related to the functional classification (e.g. A5.1 to A5.2) or to the reconciliation of stocks and flows ( A8), do not affect computation of the main MIP indicators, but do play a role in the calculation and analysis of auxiliary indicators. However, the particularities of the annual data and of the MIP process, as well as the scope of the ECB’s responsibilities under the MoU on the MIP (for those EU27 Member States that have designated their respective national central bank (NCB) to produce the b.o.p./i.i.p. datasets), create special analytical needs. In particular, longer time series (up to 15 years) are necessary for an accurate construction and analysis of the main MIP scoreboard indicators. As of this year, while all necessary data are available for the calculation of the main indicators, the calculation of one auxiliary indicator (the net international investment position excluding non-defaultable instruments - NENDI - which uses equity securities stocks ) is affected by limited data/lack of good data for Malta and Romania.
In general, most of the countries comply with the validation rules, although with some exceptions (Belgium, Croatia, and Malta). There were only a few cases in which the impact of revisions has led to the MIP indicators moving outside the threshold window (Ireland, Slovenia, and Romania), and fewer countries have national errors and omissions exceeding 2% of gross domestic product (GDP). Improvements are also noticeable in the comparison between b.o.p./i.i.p. statistics and sectoral accounts.
For more information on the assessment of data quality for MIP purposes, please see the MIP box at the end of the main body of the report.
1 Introduction
This biennial report provides a quality review of statistics on the balance of payments (b.o.p., the international investment position (i.i.p. and international reserves template of the Eurosystem (international reserves).[5] It fulfils the formal requirement of the ECB Executive Board to inform the Governing Council of the quality of these statistics, as set out in Article 6(1) of the ECB Guideline on external statistics.[6] Furthermore, the report provides information supporting the MIP data quality assurance process, as laid down in the MoU. The report follows the recommendations adopted by the Committee on Monetary, Financial and Balance of Payments Statistics (CMFB) in this domain.The focus of the report is on national data for the euro area countries and euro area aggregates. The data for EU Member States (EU27) are commented on in the MIP box at the end of the report and are also available in the annexed tables[7].
Scope of data coverage and structure of the report
This report analyses a number of aspects by which data quality can be measured. These include: (i) a review of methodological issues where national compilers diverge from statistical standards or need to enhance statistical procedures; (ii) an assessment of compliance by NCBs with their obligations to transmit data to the ECB, in terms of timeliness and coverage; (iii) the reliability of the statistical data; (iv) the internal consistency of the statistics, particularly as regards consistency over time, across frequencies, and between accounts (net errors and omissions); (v) external consistency/coherence, i.e. consistency vis-à-vis other statistical domains/datasets, namely foreign trade statistics, euro area sector accounts, MFI balance sheet statistics (including money market funds), investment fund statistics and securities holdings statistics; and (vi) asymmetries at the level of the intra-euro area aggregates and bilateral asymmetries between euro area countries.
The analysis covers quarterly and monthly data. Section 3 (timeliness and punctuality), Section 4 (data and metadata availability) and Section 6.1 (validation/integrity rules) focus on two years of observations (July 2019/Q3 2019 to June 2021/Q2 2021) given that it covers the period since the Quality Report 2019. Section 5 (accuracy and reliability) analyses the impact of three years of revisions (April 2018/Q2 2018 to March 2021/Q1 2021), and the remainder of the sections focus on three years of data (Q3 2018 to Q2 2021).
The last data vintage used throughout the report is the one available at 22 October 2021 (in line with the MIP cut-off date for the 2021 exercise) and the country coverage is mostly the euro area, although the annexed tables provide information on the quality of the data for the EU27.
Given the specificities of the MIP process, some indicators on the “fitness for purpose” of the data are presented for all EU Member States in a box at the end of the report. The need for this box arises from the fact that annual data display different properties compared with monthly and quarterly data, as well as from the need to assess the quality of data from non-euro area EU countries. The box draws on annual data up to 2020 and focuses on: (i) data availability, (ii) revisions; (iii) errors and omissions; and (iv) external consistency with sector accounts, i.e. MIP-relevant data quality dimensions. All indicators presented in the MIP box relate to national GDP to facilitate analysis of the actual MIP scoreboard indicators.
2 Methodological soundness and statistical procedures
Methodological soundness means that the concepts and definitions used to compile b.o.p./i.i.p. statistics are broadly in line with the principles and guidelines outlined in the BPM6 and take into consideration the agreements of the STC (and respective sub-structures) on the compilation of euro area aggregates.
One of the key elements of compiling consistent data is to adhere to the agreed standards and to transparently describe deviations. A document providing a detailed description of the data sources and compilation methods used by all the Member States is available on the ECB’s website.[8] The assessment included in this section is based on this ECB document, as well as on the regular ECB contacts with national compilers on general data quality issues.[9]
2.1 Residency
The residency of institutional units should be defined in conformity with the BPM6, particularly as regards whether they have a predominant centre of economic interest in the country concerned. SPEs are deemed to be resident in the economy in which they are incorporated.
Most countries correctly apply the residency concept. In the euro area, several countries host a large population of SPEs and therefore face certain challenges in achieving full coverage, and sometimes even in defining the residency of a certain entity.
The current compilation of SPE data in Malta is based on administrative sources that are hampered by many limitations (e.g. annual frequency with at least 3 years of delay, very limited information to identify the functional category, the financial instrument, and the geography of the counterpart). The 2018 revisions in the geographical allocation of positions for Malta introduced a series break in Q1 2016 that has not yet been solved. The geographical allocation of assets and liabilities was proxied to the geography of the agency that set up the SPE. Since 2019, Malta has been preparing a survey on SPEs to improve the coverage, timeliness and data quality in line with the established implementation plan, but better data have not yet been reported. In addition, the lack of information on SPEs prevents Malta from complying with the ECB/2011/23 Guideline that specifies that 85% of the portfolio investment should be collected on a security-by-security (s-b-s) basis.
In September 2021, the regular annual SPEs update of Cyprus improved the geographical allocation for selected counterparties from 2017 onwards, and mainly in respect of foreign direct investment (FDI) equity. However, some limitations still apply to the geographical details of debt instruments in FDI and other investment transactions and positions. These changes are reflected in the improvement in the bilateral asymmetry indicators for direct investment positions (see Annex Table A.1.14.3).
From September 2020, the Banque centrale du Luxembourg (BCL) improved its coverage of Luxembourg captive financial institutions by taking onboard entities with balance sheets between €300million and €500 million (and more). In addition, since 2018 the total assets of captive financial institutions domiciled in Luxembourg have decreased. Consequently, the integration of the aforementioned entities has made it possible to maintain a coverage rate of around 90%. Conscious of the importance of the gap, the BCL is still working on further processes to enhance the coverage rate for resident captive financial institutions.
The Netherlands has also gradually improved SPE coverage since 2015, with almost complete coverage currently for annual figures, but quality issues remaining for initial quarterly figures due to the grossing-up methods used. FDI between fellow enterprises for debt instruments is now covered, but only from 2019. However, the geographical allocation and the stock/flow reconciliation still require improvement. Finally, the link between the new quarterly data and the monthly estimates needs further attention to safeguard the quality of the more frequent data.
2.2 Functional classification
Most countries classify b.o.p. and i.i.p. data by function, in conformity with the BPM6 methodology. However, there is still room for improvement.
The new FDI breakdown by debt instrument, required since March 2021 under the amending ECB Guideline on external statistics[10], has made it very clear that just a few countries are able to classify direct investment transactions and related positions in debt securities between companies engaged in a direct investment relationship. Austria, Belgium, Cyprus, Estonia, Finland, Italy, Portugal, and Slovakia are reporting figures other than zero, although they are quite small and the stocks are stable over time. This may indicate that this instrument is not used for financing companies in a direct investment relation and/or that the collection systems are not prepared for it. This deviation may create internal inconsistencies at euro area level, owing particularly to the residual approach used to calculate euro area portfolio investment liabilities. Compilers should therefore assess the relevance of the issue and implement a plan to address it.
Similarly, trade credits and advances between companies engaged in a direct investment relationship are included in other investment by Spain, Greece, Luxembourg and the Netherlands. Germany classifies all transactions and positions in loans/deposits as other investment if at least one of the counterparts under a direct investment relation is an MFI.[11]
Malta includes most SPEs’ securities assets under portfolio investment given that no information is available on the relationship with the debtor. The proper identification of those assets should be a priority as a substantial amount of equity stocks might be currently misclassified on the assets side of portfolio investment.
Transactions and positions between fellow enterprises are not fully recorded under FDI. In particular, Germany, Austria, Slovenia and Slovakia do not include transactions and positions in equity.[12] Moreover, Belgium, Estonia[13], Greece, Slovenia, Slovakia[14] and Finland do not identify reverse direct investment in equity[15] [16] [17] [18] [19].
2.3 Coverage
Greece has started to exclude financial intermediation services indirectly measured (FISIM) from income in b.o.p. data as of Q1 2021, classifying those flows as services. Similarly, in a lot of countries, service margins on buying and selling financial assets are not recorded nor is compilation of this item sufficiently sound. Given the complexity of this issue, the WG ES, in collaboration with other international organisations, has investigated approaches to defining best practices by providing specific guidance to enhance estimation of this financial service. The outcome did not reach a conclusion and the methodological work will now continue in the context of the BPM6 update.
According to public metadata[20], Luxembourg does not currently estimate employee stock options.
In 2018, the WG ES, in cooperation with the WG FA, mandated a task force to issue recommendations on data sources, data collection, and compilation methods for financial derivates. In December 2020, the STC approved the development of national action plans to address those recommendations in terms of data coverage, statistical recording, ensuring stock/flow consistency, recording of post-trading activities and the use of data derived from business accounting. Non-structural adjustments (review of the data collection and compilation practices without a major structural impact) should be implemented in the short term (by September 2022). Structural adjustments, such as changes in main data sources, could be implemented as part of the next benchmark revision (2024).
The work done so far in the field of financial derivatives compilation has started to be visible in the quality of data reported to the ECB. Since October 2020, Irish financial derivatives data have been more plausible for investment funds given that changes in stocks are now reported as price revaluation, as has been the case for transactions since Q2 2019. Luxembourg is also reporting more consistent stock and flows data for financial corporations other than MFIs, however the reporting of financial derivatives for MFIs still has room for improvement. Germany must start reporting transactions in financial derivatives for the government sector, which are currently reported with zeros although the positions are non-negligible. In addition, France does not record any transactions and positions in financial derivatives by the government sector. In general, there is scope for increasing the quality of financial derivatives data, and this should be achievable with the implementation of the national plans.
In April 2015, the STC approved a new treatment for recording transactions and positions in euro currency in b.o.p./i.i.p. statistics. Most euro area countries – with the exception of Malta – have been following the guidance in a timely and accurate manner, at least from the January 2014 reference period. In the last two years, Ireland (from the Q3 2019 reference period) and Finland[21] (from the Q1 2013 reference period) have started to report accurate monthly and quarterly intra-Eurosystem technical liabilities/claims, as well as a reliable estimation of euro currency holdings abroad. Malta[22] has started to report monthly and quarterly intra-Eurosystem technical liabilities, although not in a stable and accurate way, and the data still show various issues with recording euro currency holdings abroad (stocks and flows).
Since March 2021, the reporting of a more granular sector breakdown has made it possible i) to identify the activity of insurance corporations and pension funds resident in Europe, as well as ii) to more effectively assess the coverage of cross-border insurance, pension schemes and standardised guarantee schemes (F6) assets in the other sectors of the economy. France[23] does not cover the assets of insurance, pension schemes and standardised guarantee schemes for any sector in the economy. Finland[24] and Ireland did not report insurance, pension schemes and standardised guarantee schemes assets before the Q1 2016 and Q2 2018 reference periods for insurance corporations and pension funds respectively and, in general, they do not report assets for any other sector. Greece only reports the stocks (assets and liabilities) of insurance corporations and pension funds. Estonia, Lithuania, and Luxembourg cover stocks and flows (assets and liabilities) solely for insurance corporations and pension funds[25]. Malta does not cover either assets or liabilities of this instrument for any sector of the economy.
Furthermore, Malta still does not report a proper and consistent breakdown of equity (into listed and unlisted shares, other equity, and investment fund shares).
In general, most countries have difficulties in producing an accurate estimation of cross-border transactions and positions for the non-financial sector (particularly households). This under-coverage is believed to be particularly relevant for assets held outside the euro area, including those held with foreign custodians. Most euro area countries use mirror data from: (i) the locational banking statistics of the BIS and MFI balance sheet statistics from other euro area countries, to cover deposits and loans vis-à-vis non-resident banks; and (ii) so-called third-party holdings collected in securities holdings statistics to improve estimates for securities when the foreign custodian is in the euro area. Those countries that do not use any source to enhance their estimations of household assets are continually encouraged to integrate available mirror data (reported by other NCBs) provided for their country and incorporate this information into their national data when appropriate.
From March 2021, assets held by households and non-profit institutions serving households (NPISHs) are separately reported for the b.o.p. and i.i.p., and this will therefore ensure better assessment of the coverage. Ireland is the only country that does not report any portfolio holding by households and NPISHs, while Finland and the Netherlands do not consider securities held by households with custodians outside the country. Additionally, Germany is so far not collecting information on securities held (positions) in custody abroad by non-bank corporations, however the assets held in euro area custodians are covered via the SHS data for third-party holdings since March 2020 and the assets of insurance corporations held abroad have been incorporated into the German i.i.p. since December 2021[26]. Many countries also have difficulties in accounting for real-estate holdings, in particular those located abroad that are held by resident households. Based on the reporting figures, France does not include any estimation of stocks and transactions for households’ cross-border real estate. To complement the available information, the WG ES started to collect bilateral EU data in 2019 to be used as mirror data by compilers to cover resident holdings in other EU countries.
Finally, national compilers should, in general, improve measurement of reinvested earnings on FDI. They should implement, insofar as possible, the recommendations of the Task Force on FDI (TF FDI), which are based on closer control of the data they are collecting from reporting agents, whether through dedicated surveys or from business accounting data. In general, the valuation of unlisted shares and other equity should also be improved and be carried out in a harmonised and consistent way if the counterpart is a resident of the euro area. Stock/flow reconciliation should also be carefully assessed at the geographical breakdown level. To this end, a joint WG ES and WG FA group on unlisted shares and other equity was established in January 2020 and will release its recommendations by June 2022.
2.4 Other methodological issues
A lack of consistent details in Malta’s i.i.p. data prevent the ECB from validating the figures reported for net external debt before Q2 2021. Only the Maltese total net external debt total is available, but without detail by sector, instrument, and original maturity.
Germany estimates accrued interest for debt securities under portfolio investment income on an s-b-s basis, but no equivalent entry is imputed in the underlying instrument in the financial account. France started to report parallel accrual in the income account and in the financial account from June 2021.
For Ireland, price and exchange-rate-revaluation flows for other and portfolio investments have improved in terms of plausibility and consistency between sectors and instruments. However, in some cases, other volume changes (owing to changes in methodology or coverage) are reported with exchange-rate and/or price revaluations, thus impacting the reliability of its stock/flow reconciliation.
For the Netherlands, the intra/extra-euro area breakdown of the i.i.p. is not plausible given that the other volume changes are usually large and with an opposite sign, cancelling out in the grand total RoW (W1). This occurs for all the components, sectors, and instruments of the i.i.p. and becomes very relevant for direct investment liabilities.
In Finland, from 2008 to 2012, resident banks classified some of the liabilities as loans. Belgium has revised the data of resident banks and all loan liabilities have been reclassified as deposits.
Ireland has started to value monthly reserve assets at month-end market prices (including exchange-rate changes) and therefore to report revaluation changes on a monthly basis in accordance with the ECB Guideline on external statistics.
In the case of Ireland, the monthly estimate for goods (according to the community concept) does not display the expected seasonal pattern and often shows negative values for exports and imports following the community concept for periods from 2015 to 2017.
The quality of the monthly Irish and Dutch data has a negative impact on the general quality of the monthly euro area aggregates. They usually show either consistency problems with the reported quarterly data or an unreliable distribution of the quarterly transactions.
France systematically reports zero monthly transactions in assets issued by money market fund (MMF) shares in their first estimates (intra and extra-euro area). Finland also reports zero, but only for extra-euro area holdings and will fix this misreporting in subsequent quarterly transmissions. The Netherlands has started to report this monthly data in a timely manner.
3 Timeliness and punctuality
The ECB Guideline on external statistics establishes, in Article 3, the requirements for the (transmission) timeliness/punctuality of the data. Infringements of those requirements are recorded as non-compliance cases[27].
In the period July 2019 to June 2021, most of the countries made data available in accordance with the agreed timetable. Non-compliance cases were recorded more than once for De Nederlandsche Bank (due to certain technical problems). Central Bank of Ireland and Central Bank of Malta registered isolated ad hoc instance of non-compliance due to one-off delays.
- Data publication was not affected by the non-compliance cases and was carried out in line with the advance release calendar (as published on the ECB’s website).
4 Data and metadata availability
4.1 Completeness
From 1 March 2021, new mandatory series were requested in the ECB Guideline on external statistics for the production of b.o.p. and i.i.p. statistics to be provided with the Q4 2020 quarterly data transmission.
The new requirements address many of the most pressing user needs in terms of sector, instrument, currency, and geographic details, and are aimed at enhancing, in a timely manner, analysis and understanding of the impact of the external sector on monetary aggregates, trade developments, external imbalances and shifts in globalisation patterns. It also further improves the consistency between the quarterly b.o.p./i.i.p. statistics and national (including sector) accounts, for example, the quality of who-to-whom presentation and sectoral breakdowns of domestic and cross-border financial instruments.
Most of the countries adapted their transmissions to take account of the new requirements in a timely manner and, by the cut-off date of this report, transmitted all the new mandatory series for the Q2 2021 reference period. The Central Bank of Malta failed to comply with the completeness requirement, for example, by transmitting quarterly data under the old requirements and by not sending full details for the reconciliation of stocks and flows (namely the so-called other flows). In September 2021, the new details were transmitted by the Central Bank of Malta but were of a very poor quality.
The ECB Guideline on external statistics requires that the “data shall be accompanied by readily available information on single major events and on reasons for revisions, when the magnitude of the change to data caused by such single major events or revisions is significant […]”. National compilers are therefore required to make regular and consistent use of the metadata template in all production cycles. Instances of information on single major events not being reported (or being absent) are also treated as non-compliance cases.
In general, for the review period (July 2019/Q3 2019 to June 2021/Q2 2021), the metadata transmitted by national compilers has been of sufficiently high quality to make it possible to produce the euro area aggregates and to explain major developments in the aggregates. However, Banque de France has recurrently failed to comply with this requirement, and the central banks of Ireland, Finland, and Malta occasionally.
The ECB welcomes further efforts to improve the accuracy and level of detail in the metadata transmitted to the ECB, and also encourages euro area national compilers to exchange information with other euro area NCBs under the existing arrangements, for instance in the context of FDI Network and during the Asymmetry Resolution Meetings (ARMs), to further improve the data quality of the b.o.p./i.i.p.
4.2 Accessibility and clarity
Accessibility refers to the conditions under which users can obtain, use, and interpret data, ultimately reflecting how straightforward it is to access the data and the extent to which confidentiality constraints hamper analytical work.
In line with the ECB legal framework on data confidentiality,[28] all national data must be transmitted with a flag indicating their respective levels of confidentiality. The ECB encourages national compilers to make as much data available as possible to final users (i.e. by marking observations as “free for publication”) and to ensure that statistical confidentiality flags are used appropriately.
Table 2 below summarises the percentage of observations marked as “free for publication” as publishable subsets for the data requested under the ECB Guideline on external statistics.[29] The percentages are calculated for the quarterly b.o.p. and i.i.p. for the Q3 2019 to Q2 2021 reference period. Table A.1.1.1 in the Annex shows the same indicator for “all (mandatory[30]) items” transmitted under the ECB Guideline on external statistics.
Table 2
Average percentage of observations marked as “free for publication” per dataset (main items) for the Q3 2019 to Q2 2021 period

Source: ECB.
Note: The percentages are calculated based on the number of observations, without considering the relative importance (magnitude) of the data.
Most of the euro area countries released more than 99% of the publishable dataset to the general public. Among them, Belgium, France, Slovenia and Slovakia released 100% of this dataset, while only Luxembourg released less than 90% of the main items of the quarterly b.o.p. Luxembourg and Malta alone released less than 90% of the main items of the i.i.p.
Full monthly b.o.p. datasets were flagged as “non-publishable” or “confidential” by Ireland, Cyprus and Austria (generally on the basis of national dissemination policies), while, compared with the last report, the Netherlands[31] released 98% of the monthly b.o.p. data to the public (see Table A.1.1).
Concerning the full extent of quarterly data transmitted to the ECB (of which the publishable subset is only a small subset), significantly more quarterly b.o.p and i.i.p data were released by Spain for the public and small improvements were also made by Malta. Fifteen euro area countries made more than 90% of the quarterly b.o.p. data required available to final users and fifteen euro area countries have also done so for the quarterly i.i.p. data (see Table A.1.1).
Clarity refers to the “information environment” of the data, i.e. whether the data are accompanied by relevant and pertinent metadata, illustrations (such as charts), information on their quality, potential limitations as to their use and background information (sources and methods).
The ECB publishes the b.o.p. (monthly and quarterly) and i.i.p. (quarterly, including revaluations and other changes in volume) for the euro area as a single economic area. Twelve monthly press releases and four quarterly statistical releases outlining the latest data and relevant economic developments are published through wire services and on the ECB’s website. Furthermore, dissemination dates for all these press releases are announced at the beginning of each calendar year in the ECB’s Statistical Calendars.
The concepts and definitions used in the euro area b.o.p. and i.i.p. statistics are in line with international statistical standards. The “B.o.p. and i.i.p. book”, available on the ECB website, aims at providing users with an overview of the main features of the b.o.p. and i.i.p. methodological framework and of the data sources and compilation methods used by the ECB (for the euro area) and by each EU Member State.
The data can be accessed through the ECB’s Statistical Data Warehouse or in the External Transactions and Positions section of the Statistics Bulletin. Since November 2021, the euro area balance of payments and international investment position key indicators have also been accessible through a new data visualisation Dashboard. Furthermore, the ECB has a Statistical Information Request facility to help external users of statistics access and analyse the data.
A subset of the statistics produced under the ECB Guideline on external statistics can be accessed through the Euro area statistics website. The aim of this dedicated website is to facilitate the understanding, use and comparison of euro area and national statistics by presenting the data in a user-friendly manner. This website also makes it possible to download or share data easily by embedding the graphics into other websites, emails or social media.
Table A.1.1.2 in the Annex presents a summary of national practices for data and metadata accessibility. Similar to the ECB, all euro area countries provide technical facilities for downloading data in different formats (in Excel tables, CSV files, PDF documents or through interactive statistical databases). Furthermore, the majority of the euro area countries have statistical and/or economic bulletins providing a visual representation of the data in the form of charts, graphs and/or tables. Most euro area countries publish regular press release updates on their websites on a monthly and/or quarterly basis. Last but not least, all countries present extensive information about their institutional environment and statistical processes in the “B.o.p. and i.i.p. book” as well as on their national websites.
5 Accuracy and reliability (including stability)
This section reviews the stability of the data in terms of revisions to the “first assessment” or “first vintage”. In general, revisions are necessary to improve the accuracy of the data, given that first assessments may be based on incomplete, late or erroneous responses by reporting agents. However, major recurrent (biased) revisions may indicate low quality of data sources and/or methods that need to be addressed. Conversely, minimal or no revisions does not necessarily mean that the first assessment was of a high quality; it may simply indicate a national preference for not revising the data.
In this report, quarterly revisions (for the euro area countries and for the euro area aggregate) and monthly revisions (for the euro area aggregate only) are assessed using indicators based on a comparison between first and “last”/most recent assessment. Different indicators are applied depending on the features of the time series in question. Two basic types of indicators are used:[32]
- Relative size indicators measure the difference between the first and last assessments, either in relation to the underlying series when strictly positive (the symmetric mean absolute percentage error (SMAPE)) or otherwise in relation to a reference series (e.g. GDP or the underlying outstanding amounts for b.o.p. financial transactions; the mean absolute comparative error (MACE)). In the case of non-strictly positive (net/balance) time series, revisions cannot be properly related to the series value itself because the observations may have different signs and, more importantly, the value of the series may be close to zero. Therefore, for net/balance series the indicator used is the net relative revisions (NRR). The NRR puts the absolute revisions in relation to the average underlying gross flows for current account items and the average positions of assets and liabilities for financial account transactions and positions. Owing to the different denominators employed, the SMAPE, MACE and NRR are not directly comparable;
- Directional stability/reliability indicators measure how frequently first assessments are revised in the same direction (the upward revisions ratio and the directional reliability indicator).[33]
All charts depict the indicators calculated for a revision window of three years (Q2 2018 to Q1 2021 for national and euro area aggregates – quarterly series – and April 2018 to March 2021 for euro area aggregates – monthly series).
In general, the revisions recorded in the Q2 2018 to Q1 2021 period were not fundamentally different from those recorded in the equivalent period analysed in the previous quality report. While increasing the accuracy, these revisions have not fundamentally altered the analytical interpretation of the first assessments.
5.1 Current account
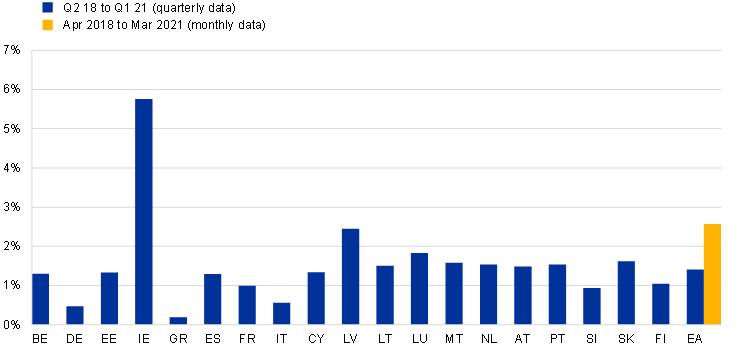
In general, revisions to the euro area current account credits and debits were comparable for monthly and quarterly data, as can be seen in Chart 1 below. The euro area aggregate recorded revisions comparable to the euro area country median (1% for the quarterly current account credits and debits), with the monthly data recording slightly higher revisions.
Cyprus[34] and Luxembourg had the highest revisions among euro area countries for current account credits and debits. Both countries generally revised their quarterly current account figures upwards, but with high directional reliability indicators.
In terms of current account sub-items, in particular for monthly data, most countries displayed higher revisions in the case of primary income.
Chart 1
Revisions to current account credits and debits
(symmetric mean absolute percentage error – SMAPE)

Source: ECB.
Concerning revisions to the quarterly current account balance (see Chart 2 below), the euro area aggregate recorded comparable revisions to the median of the euro area countries (1%). Monthly revisions were slightly higher than quarterly revisions as assessed by the NRR indicator.
For the current account balance, the most sizeable revisions were recorded by Ireland.
Chart 2
Revisions to the current account balance
(net relative revisions – NRR)
Source: ECB.
Detailed information on SMAPE, upward revisions and directional reliability indicators is available in Tables A.1.2.1 to A.1.6.2 in the Annex.
5.2 Financial account transactions
For the quarterly euro area aggregate, recorded revisions amounted to 0.2% of the underlying positions for total transactions in financial assets and liabilities, which is slightly lower than the median of euro area countries. Revisions to monthly euro area aggregates were considerably higher, as can be seen in Chart 3 below. Monthly revisions to euro area direct and other investments were the highest, at approximately 1% for both assets and liabilities, followed by revisions to portfolio investment.
All euro area countries recorded revisions of less than 1% of the underlying positions for quarterly financial transactions. The highest revisions were recorded by Cyprus[35] and Lithuania.
Chart 3
Revisions to the financial account
(mean absolute comparative error – MACE)

Source: ECB.
Concerning revisions to net quarterly financial transactions, the euro area aggregate recorded NRR comparable with the median of euro area countries (0.1%), while revisions to the monthly series were substantially higher (across all functional categories).
In terms of net financial account transactions for euro area countries, Latvia and Finland recorded the highest level of revisions among euro area countries (see Chart 4 below).
Chart 4
Revisions to net financial account transactions
(net relative revisions - NRR)

Source: ECB.
Detailed information on MACE, upward revisions and directional reliability indicators is available in Tables A.1.2.1 to A.1.6.2 in the Annex.
5.3 International investment position
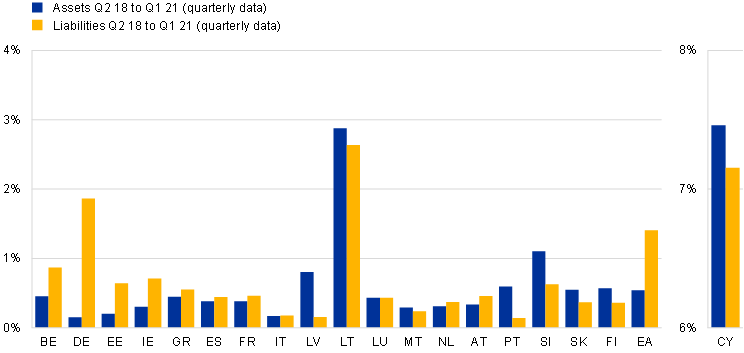
Revisions to the quarterly i.i.p. (financial account positions) for the euro area aggregate (as measured by SMAPE) were less than 0.5% for assets and less than 2% for liabilities, both figures being higher than the median for euro area countries (see Charts 5 and 6.).
At country level, revisions for assets and liabilities were generally comparable (except for Germany). Cyprus and Lithuania recorded the highest revisions in the euro area (see Chart 5). In most cases, both countries revised upwards their first assessments of the total i.i.p. (for both assets and liabilities)[36]. However, the degree of directional reliability was very high for Lithuania and slightly lower for Cyprus.
Chart 5
Revisions to the international investment position
(symmetric mean absolute percentage error -SMAPE)
Source: ECB.
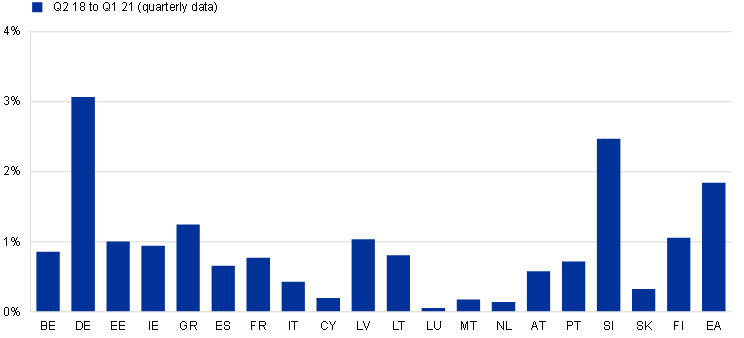
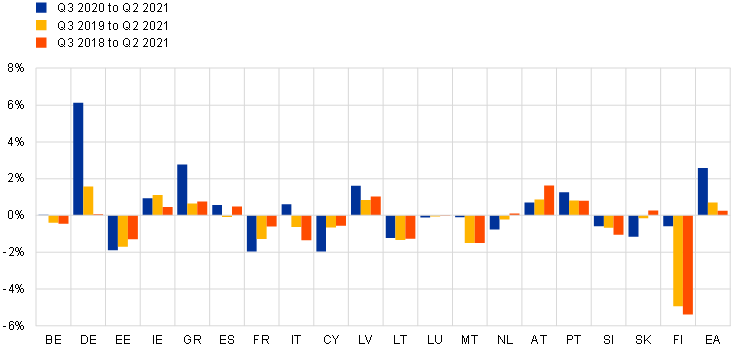
The euro area aggregate registered revisions in the net i.i.p. of 1.8% of the underlying average positions during the period under review (higher than the median level of revisions for euro area countries). Slightly higher revisions (between 1.3% and 5.3%) were recorded in net positions for the various functional categories (direct, portfolio and other investment). At the level of individual countries, the highest NRR for net i.i.p. was recorded in Germany (see Chart 6).
Chart 6
Revisions to the net international investment position
(net relative revisions - NRR)
Source: ECB.
Detailed information on SMAPE, NRR, upward revisions, and directional reliability indicators is available in Tables A.1.2.1 to A.1.6.2 in the Annex.
6 Internal consistency
This section comprises two parts, assessing the reported national b.o.p. and i.i.p. data for internal coherence and consistency respectively. This comprises consistency over time (i.e. potential breaks in series), consistency across different frequencies (monthly and quarterly data) and an assessment of the arithmetic and accounting identities (including net errors and omissions).
6.1 Validation/integrity rules
This section reviews the extent to which the national datasets transmitted were complete and met all basic accounting validation rules. These include the linear constraints that apply to the b.o.p., i.i.p. and international reserves template statements, namely whether credits/assets minus debits/liabilities match the respective net flows/positions for each item, and whether sub-items add up to the respective items/totals, etc. Furthermore, it is strongly encouraged that datasets for different frequencies (i.e. monthly and quarterly) or data recorded in different datasets (e.g. reserve assets transmitted in the i.i.p. statement and in the reserve assets template) are always kept consistent.
Compliance with the validation rules is summarised based on the average share of satisfied validations indicator (see the section “Methodological documentation for quality indicators” for more details). The quarterly data had more validation issues than monthly data, but in both cases the failed validations were adjusted by the ECB and therefore did not impair the overall quality of the euro area aggregates.
The integrity results are fundamentally in line with the previous report ’s assessment. Among the countries with recurrent validation issues, Belgium had stock/flow reconciliation problems visible in FDI, arising from the difficulties of linking the annual stock survey data with the more frequent transactions information (expected to be solved with the introduction of a new IT application that is currently in development and expected by the end of 2023). France recorded minor persisting issues (namely few negative stocks in equity between fellow enterprises, or vis-à-vis unallocated geographical areas resulting from the adjustment on net errors and omissions, and negative estimates of insurance services transactions, which should be corrected in September 2022). Furthermore, mainly due to reporting mistakes, Malta recorded inconsistencies in the intra/extra-EU geographical breakdown of the quarterly i.i.p., incorrect instruments classification in stocks and reconciliation issues caused by the incomplete or implausible reporting of “other flows”. Finally, Malta and Ireland failed the balancing rule (i.e. current account + capital account – financial account + n.e.o =0) for Q2 2021 quarterly data and for the corresponding monthly b.o.p. data.
Values for the validation indicators are available in Tables A.1.7.1 to A.1.7.3 in the Annex. The calculations are based exclusively on the new requirements introduced in March 2021 by the amended ECB Guideline on external statistics.
Consistency between datasets is very important to ensure the overall quality of the b.o.p. As a result, average time consistency (ATC) and average relative explained changes (AREC) can be used as indicators to summarise consistency problems between frequencies and between positions and flows respectively.
In terms of time consistency, most countries exhibit full consistency between monthly and quarterly data, with only a few exceptions. Ireland continues to display, for most of the analysed b.o.p. series, a level of time consistency below the euro area median, with extra-euro area secondary income and services showing consistent monthly and quarterly values in around 83% of cases (see Table A.1.7.4 in the Annex for more details).[37]
In terms of average reconciled amounts for main items, all countries achieved full reconciliation between positions and flows, with the exception of Malta, which did not provide complete information on other flows (see Table A.1.7.6 in the Annex for more details).
6.2 Net errors and omissions
Net errors and omissions (n.e.o.) (the difference between net lending/borrowing as compiled from the current account plus the capital account and the financial account) provide an indication of the internal consistency of the b.o.p. In fact, the principle of double-entry bookkeeping means that the sum of all credit and debit transactions should be equal to zero in the b.o.p. statement (i.e. that n.e.o. are zero). Normal random imbalances commonly result from imperfections in source data and compilation practices. However, if these imbalances are large and/or persistent, they indicate problems in sources and/or methods.
With regard to b.o.p. compilation practices, it is not uncommon for statistical modelling and/or expert judgements to be applied with the intention of imposing certain properties on net errors and omissions. This means using statistical techniques to account for a lack of source data coverage or uncertainty about certain pre-identified items. Such mechanisms are typically incorporated into the compilation system and are applicable during each data production round. At euro area level, a correction mechanism that minimises net errors and omissions is also in place. The assumption behind the adjustment is that certain items in portfolio investment and other investment categories are not appropriately captured in the compilation of national data.
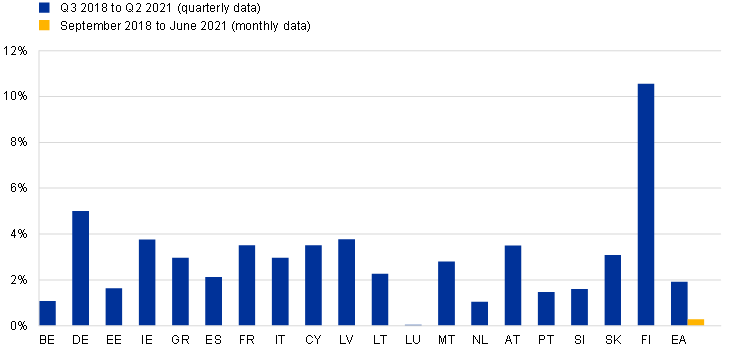
The average relative error for the current account provides a measure of the magnitude of net errors and omissions for average gross current account flows. Chart 7 below provides a graphical representation of the situation in euro area countries and the euro area aggregate (Chart A.1.7.1 in the Annex shows the average absolute n.e.o. in relation to the i.i.p.).
Overall, the current results are in line with those presented in the previous quality report.
Due to the correction mechanism in place, the euro area aggregate did not exhibit a high n.e.o. compared with individual euro area countries. The average absolute n.e.o. relative to average gross current account flows for the euro area aggregate was less than 0.5% for monthly data and less than 2% for quarterly data.
Quarterly n.e.o. for euro area countries generally exceeded 2% of the average current account gross flows. Over the period under review (Q3 2018 to Q2 2021), Finland displayed the highest average n.e.o. as a percentage of average current account gross flows, at around 10%. Germany registered the second highest n.e.o. in the euro area of approximately 5%. Countries are encouraged to continuously monitor the size of their n.e.o. and the underlying causes and to address structural problems as soon as possible.
Chart 7
Relative net errors and omissions[38]
(average absolute net errors and omissions relative to average gross current account flows; percentage)
Source: ECB.
The persistence of the sign of net errors and omissions is also relevant as a quality measure, given that it helps to identify biases in the accounts. Chart 8 below shows the cumulative n.e.o. in relation to current account gross flows.
Chart 8
Bias in net errors and omissions
(cumulative net errors and omissions relative to average gross current account flows; percentage)
Source: ECB.
Neither the euro area aggregate nor the vast majority of euro area countries display a clear statistical bias in their net errors and omissions. However, the positive trend of the German n.e.o. in the last year should be carefully monitored.
7 External consistency/coherence
External consistency is defined as the coherence of b.o.p. and i.i.p. data with other related statistical domains. In this report, the external consistency/coherence of the b.o.p. and i.i.p. is assessed against foreign trade statistics, euro area (sector) accounts, MFI balance sheet statistics (including money market funds), investment fund statistics, and securities holdings statistics.
7.1 Coherence with foreign trade statistics
International trade in goods statistics (ITGS) are typically the main data source used to compile the b.o.p. goods account in all euro area countries. However, when comparing the two datasets important conceptual differences should be taken into account. Differences in concepts and definitions are linked primarily to the fact that the b.o.p. follows the so-called change-of-economic-ownership principle, whereas ITGS record physical cross-border movements of goods.[39]
Given the methodological differences between the two datasets, a direct comparison would not convey an accurate picture. Instead, a directional reliability indicator is used to assess whether b.o.p. and ITGS data exhibit consistent developments and can hence be used as complementary analytical data sources. Furthermore, several countries publish reconciliation tables between the two datasets, which are available on the websites of their respective NCB or NSI.
Table A.1.8.1 in the Annex shows the individual national directional reliability indicators for the Q3 2018 to Q2 2021 period for the counterpart areas RoW and extra-euro area. The results are comparable with those presented in last year’s quality report.
For the euro area aggregate, there was full directional reliability for both imports and exports. Three euro area countries displayed full directional reliability for both exports and imports for the two counterpart areas analysed. A limited number of countries, including Malta,[40] showed a lower degree of directional reliability.[41] On average, data for exports/credits were as directionally reliable as data for imports/debits.
It should be noted that full directional reliability is not necessarily a sign of quality and that inconsistencies in the developments of the two datasets may be explained by the economic structure of the external trade in goods account of the respective country.
7.2 Consistency with euro area sector accounts
Euro area b.o.p. and i.i.p. data constitute one of the so-called building blocks of the euro area accounts (EAA) and are widely used at national level for the compilation of the RoW financial and non-financial accounts as part of the system of national accounts.
The methodological differences between the b.o.p./i.i.p. and the RoW account (national accounts) were removed with the introduction of the BPM6 and European System of Accounts (ESA) 2010, albeit some challenges still remain when it comes to interpretation.[42] The regular monitoring of differences between the two statistical domains reveals that some discrepancies still persist in many countries, negatively affecting the combined use of the two datasets and their reliability.[43] In this regard, the ESCB has worked over the last few years to remove inconsistencies between the two statistical domains, and most countries already compile the two sets of statistics in a consistent manner. However, for a few countries large discrepancies are still observed, with a substantial impact on euro area and EU aggregates. Such issues are being tackled within the MIP quality assurance framework.[44]
7.2.1 Current account
Chart 9[45] shows the differences between the b.o.p. and the RoW current accounts. As an indicative benchmark, relative differences should ideally be no higher than 0.5% of the underlying average b.o.p. and RoW values, as agreed by the STC.[46]
For the euro area aggregate, the differences were not significant and were broadly unchanged relative to the previous report, with a high level of consistency between the two datasets. At country level, although a general improvement was observed as compared with the previous report, notable differences (above 4%) were observed for Greece (credits), France (credits), Luxembourg (debits), and Malta (credits). These differences were mostly triggered by sizeable discrepancies for services (France, Luxembourg, and Malta) and primary income (Greece and France). In addition, the differences above the threshold observed for Belgium (debits),[47] Germany (debits), Estonia, Portugal (credits) and Slovenia (debits) did not affect the consistency between the two datasets.
Chart 9
Current account discrepancies between the b.o.p. and RoW account
(average absolute and relative difference (as a percentage of the respective quarterly b.o.p. and RoW items) for the Q3 2018 to Q2 2021 period (b.o.p. vs EAA))

Source: ECB.
Further details of this comparison are available in Tables A.1.9.1 to A.1.9.4 in the Annex.
7.2.2 Financial transactions
Chart 10 shows the differences between the b.o.p. and the RoW account for financial transactions. In this case, discrepancies may be accounted for by time of recording differences, as well as by the reconciliation of national sectoral accounts. Both “vertical” reconciliation (a correction for net errors and omissions) and “horizontal” reconciliation (asset/liability equality across sectors) may entail larger adjustments to the financial transactions in the RoW account. Nonetheless, as an indicative benchmark, the relative differences should ideally not exceed 0.3% of the average value of the underlying positions.
Since the release of b.o.p. data and EAA on 29 October 2020, consistency between the two datasets for financial transactions at euro area level has been achieved thanks to the alignment of data sources and the introduction of a common balancing mechanism for periods from Q1 2013 onwards. Work on achieving consistency for positions and other changes is expected to be completed by autumn 2023.
For the euro area aggregate the differences were eliminated by the common balancing mechanism approach mentioned above. At country level, an overall improvement was observed, but differences above 0.3% were still recorded for Germany (liabilities), Greece (assets), Malta, Slovenia (liabilities), and Slovakia (assets). Greece recorded the highest relative discrepancies (assets), while the largest absolute differences were observed in Germany (liabilities). The differences above the threshold observed for Slovenia and Slovakia did not affect the high correlation observed between the two datasets, although they did have an impact in the case of Malta.
Chart 10
Financial account transactions’ discrepancies between the b.o.p. and RoW account
(average absolute and relative difference (as a percentage of the respective quarterly b.o.p. and RoW stocks of financial assets/liabilities) for the Q3 2018 to Q2 2021 period (b.o.p. vs EAA))

Source: ECB.
7.2.3 Financial positions
Chart 11 below presents the differences between the i.i.p. and the RoW account for financial assets and liabilities (balance sheets/positions). As expected, the differences between the two datasets are larger for positions than they are for transactions. Relative differences should, as an indicative benchmark, be less than 0.5% of the average financial assets/liabilities totals in the i.i.p. and sectoral accounts.
The euro area recorded discrepancies of 3% for both assets and liabilities, somewhat smaller than in the previous quality report. These discrepancies arose mostly from differences between the compilation and reconciliation processes for the euro area i.i.p. and the RoW. At country level, differences worsened notably on the asset side while they improved on the liabilities side. The highest discrepancies were recorded for France (assets) and Malta, with values exceeding 7%. In addition, differences above the threshold were observed for Germany (assets), Ireland, Greece, Portugal, Slovenia (liabilities) and Slovakia – although this did not affect the high correlation observed between the two datasets.
A detailed analysis at the instrument level reveals sizeable differences for equity instruments that are mostly triggered by different valuation practices (e.g. in the case of France, for unlisted equity instruments)[48]. Other reasons behind the significant differences also affecting the remaining instrument types include discrepancies in vintages, data sources and estimation methods.
Chart 11
Financial account position discrepancies between the i.i.p. and RoW account
(average absolute and relative difference (as a percentage of the respective quarterly i.i.p. and RoW stocks of financial assets/liabilities) for the Q3 2018 to Q2 2021 period (i.i.p.vs EAA))
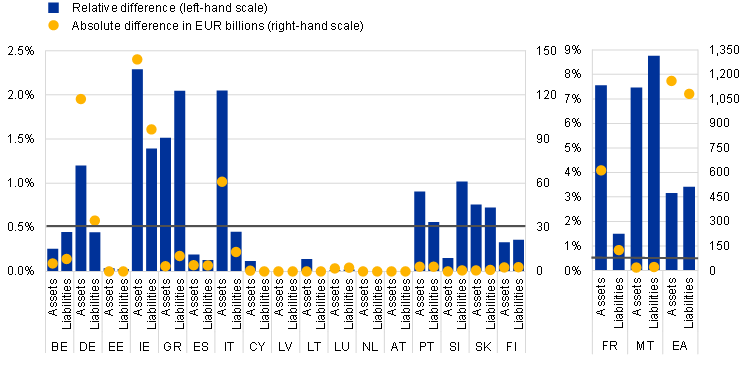
Source: ECB.
7.3 Coherence with MFI balance sheet data
Data on cross-border transactions and positions of the euro area MFI sector are collected and recorded in the b.o.p./i.i.p. and under the MFI balance sheet statistics (BSI).
Consistency between b.o.p. data for the MFI sector and transactions in external assets and liabilities derived from the BSI statistics of euro area MFIs is essential for the construction of the “monetary presentation of the balance of payments”, and its use for monetary policy purposes. Furthermore, this consistency is also paramount for the compilers of EAA, who use both datasets as “building blocks”. On these grounds, the ECB assesses the consistency between the two datasets in every regular production cycle, taking into account details by geography and instrument. Persistent discrepancies between the two datasets are generally explained by compilation and methodological differences (see below).
The average monthly discrepancies between the two datasets for the euro area aggregate transactions (between July 2018 and June 2021) have increased in relative and in absolute terms as compared with the previous quality report. In absolute terms the differences were around 10 billion for both loans and deposits and securities. For quarterly transactions, the comparability between the two datasets improved slightly, in comparison with the previous quality report, for securities assets. Concerning the transactions in loans and deposits, consistency has been assured by ECB since Q1 2013 given that the data are adjusted to be fully consistent with BSI transactions as part of the process for improving the consistency with the EAA statistics.
For positions, discrepancies of around €60 billion, i.e. more than 17% of the average i.i.p. and BSI positions, were recorded for euro area equity assets and are mostly explained by French data. Furthermore, consistency in loans and deposits is almost constant, remaining at the level for Q1 2013, due to the adjustments mentioned above. Changes in the level of consistency are solely due to the other flows.
For the euro area countries, monthly transactions were generally consistent across datasets, with a few exceptions in equity assets for Ireland (21%) and Luxembourg (5%) that may partially be explained by the exchange rate revaluations included as transactions in BSI. Comparability issues in absolute terms were observed for France, with discrepancies for debt securities assets exceeding 10 billion and also discrepancies for loans and deposits.
In terms of positions, Luxembourg, Austria, France, and Slovenia recorded discrepancies exceeding 25% of average positions for equity securities, but the French discrepancy of over €88 billion was the driver of the euro area discrepancy. In the case of loans and deposits, the largest relative discrepancies were found for Estonia[49] and Spain (9% and 3% respectively on the asset side) and France (3% on the liabilities side). However, the French discrepancy of over €55 billion was the driver of the euro area discrepancy.
The main reasons for these inconsistencies include: (i) differences in the classification of instruments (e.g. the b.o.p./i.i.p. may classify an instrument as a deposit, whereas it is classified as “remaining assets and liabilities” in BSI statistics); (ii) differences in the treatment of short selling of securities in certain countries (off-balance sheet treatment instead of a reduction in assets); (iii) reliance on distinct data collection systems, namely s-b-s for the b.o.p. and monthly aggregated sources for BSI, which leads, in particular, to differences in valuation criteria (i.e. the b.o.p./i.i.p. are calculated at transaction/market prices, while BSI transactions are derived from positions reported at fair, cost or nominal value, depending on accounting practices).
Further details of these comparisons are available in Charts A.1.10.1 to A.1.10.6 in the Annex.
Eurosystem
Most of the discrepancies in the data for the Eurosystem aggregate are related to the inclusion in the b.o.p. of estimates for holdings of euro banknotes outside the euro area,[50] while in BSI statistics all holdings of euro banknotes are deemed to be in circulation in the euro area. For the rest, the consistency between the b.o.p. /i.i.p. and BSI statistics is generally good.
At country level, the treatment of intra-Eurosystem technical claims is also a source of discrepancies, given that these are included in the BSI under remaining assets and liabilities without geographical breakdown, and in the b.o.p./i.i.p under currency and deposits. Additionally, b.o.p. estimations for holdings of euro banknotes outside of the euro area are not included in the BSI statistics.
7.4 Coherence with money market fund statistics
Data on cross-border investments in euro area MMF shares are recorded within the portfolio investment account of the euro area b.o.p./i.i.p. Data on assets and liabilities of euro area MMFs are also collected under MFI balance sheet statistics (BSI).
At euro area level, the i.i.p. recurrently exceeded the BSI outstanding amounts of MMF shares issued by euro area residents and held by non-euro area residents. At country level, small discrepancies were recorded in the period under review for France, Luxembourg, and the Netherlands for transactions with non-residents (mostly those countries with relevant MMF activity).
The discrepancies between the two sets of statistics were related to the use of different compilation methods in the b.o.p./i.i.p. and MFI balance sheet statistics. While the “residual approach” is used to calculate the b.o.p. and i.i.p. portfolio investment liabilities, MMF liabilities are allocated geographically by respondents in BSI statistics. Although in the case of MMF shares there is, in principle, no significant trading in secondary markets, the intervention of intermediaries buying, holding and selling shares on behalf of their clients can make it difficult to identify the place of residence of the actual holders. In such cases, the first counterpart – the custodian or other intermediary – may be known, but the final investor often is not. Identifying the place of residence becomes increasingly complicated as the length of the chain of intermediaries increases; consequently, the residual approach of the b.o.p. and i.i.p. may be more accurate.
Further details of these comparisons are available in Charts A.1.11.1 and A.1.11.2 in the Annex.
7.5 Coherence with investment fund statistics
Details on cross-border investments in non-MMF investment fund (IF) shares are recorded in the b.o.p. and i.i.p. statistics within portfolio investment. Data on IF assets and liabilities are collected under the Regulation on Investment Funds[51] (IF dataset).
At euro area level, the i.i.p. consistently exceeds the IF dataset in terms of euro area investment funds shares liabilities. The average absolute discrepancy reached €161 billion for positions and €10 billion for transactions throughout the period under analysis (i.e. Q3 2018 to Q2 2021). The discrepancies at euro area level are partly explained by the use of the residual approach to calculate portfolio investment liabilities (see Section 7.4 above).
For positions, at country level, Malta (200%) has the highest relative inconsistencies for IF shares held by non-residents, although the absolute difference is a value close to €12 billion. In addition, while Luxembourg displays a relatively small discrepancy of 2%, the average absolute discrepancy stands at €79 billion. The two datasets are fairly consistent as regards transactions, with the largest average discrepancies affecting Luxembourg data (€9 billion).
Further details of these comparisons are available in Charts A.1.12.1 and A.1.12.2 in the Annex.
7.6 Coherence with securities holdings statistics
The ECB Guideline on external statistics specifies that portfolio investment collection systems of euro area countries must, insofar as possible, rely on s-b-s information (see Annex VI). In particular, it states that “the target coverage is defined as follows: stocks of securities reported to the national compiler on an aggregate basis, i.e. not using standard (international securities identification number (ISIN) or similar) codes, should not exceed 15% of the total portfolio investment stocks of assets or liabilities”. The b.o.p. and i.i.p. statistics and SHSS[52] are therefore expected to provide consistent results, mainly because national portfolio investment assets and SHSS should derive from the same s-b-s sources of information.[53]
This section compares the positions at market value of (i) debt securities, and (ii) listed shares and investment fund shares/units, as available in the SHSS dataset.[54] This analysis considers, on the SHSS side, cross-border holdings by residents of each euro area country as collected by the respective country as well as holdings by non-financial investors of each euro area country that are held in custody in other euro area countries (i.e. so-called third-party holdings).
7.6.1 Debt securities
Given the scope of compilation of portfolio investment on an s-b-s basis as indicated above, the focus should be on discrepancies that are above 15% of the respective position.
For the euro area aggregate, the level of discrepancies for debt securities was 6% of the underlying i.i.p., which signals a very good degree of consistency with SHSS. At the level of individual countries, there were again no cases of relative discrepancies above 15% owing to SHSS under-coverage.[55]
The (positive) b.o.p. and SHSS gap is explained mostly by financial corporations other than MFI holdings of long-term debt securities issued by non-euro area countries. The main reasons for the differences are the lack of comprehensive coverage of non-ISIN securities data in SHSS,[56] the different revision policies for SHSS and the i.i.p., and a significant part of this discrepancy is explained by the i.i.p.’s attempts to cover securities held with custodians outside the euro area.
Further details of this comparison are available in Chart A.1.13.1 in the Annex.
7.6.2 Listed shares and investment funds shares/units
For the euro area aggregate, the total discrepancy as a percentage of the underlying i.i.p. was 5%. At country level, discrepancies above the 15% threshold owing to SHSS under-coverage were recorded in Italy[57] and Portugal. In contrast, Germany[58] recorded lower figures for the i.i.p. than in SHSS amounts for investment funds shares held by German financial corporations other than MFIs. Finally, Malta continued to report zero holdings of listed shares and investment funds shares within its b.o.p. and i.i.p. statistics, meaning that indicators were not calculated for this country, despite relevant amounts being reported in the context of SHSS for these instruments.
To a large extent, the (positive) b.o.p. and SHS gap is explained by financial corporations other than MFI holdings of listed shares and investment funds shares issued by non-euro area countries. The caveats mentioned for debt securities also hold true when it comes to explaining this discrepancy.
Further details of this comparison are available in Chart A.1.13.2 in the Annex.
8 Asymmetries
Asymmetries are an inherent feature of all statistics for which “mirror” data are collected, i.e. for which two countries collect the same type of information in relation to each other. They occur when one country’s data do not correspond to the data for the same transaction reported by its partner country. However, for a variety of reasons, it is rarely the case that two data sources provide exactly the same results and this leads to the emergence of asymmetries.
Asymmetries can be observed at the level of the global economy (where total world assets should equal total world liabilities), at the level of geographical aggregates (where total intra-euro area assets should match total intra-euro area liabilities), and at the level of bilateral pairs (where flows and positions between pairs of countries should match perfectly).
8.1 Intra-euro area asymmetries
Charts 12 and 13 provide an overview of intra-euro area asymmetries in the current and capital accounts and the financial account respectively.
Chart 12
Intra-euro area current and capital account asymmetries
(EUR billions)

Source: ECB.
Current and capital account asymmetries (credits minus debits) were always positive over the period under review. The main contributors to the overall asymmetries show structural biases: consistently positive asymmetries in goods and services accounts, with negative contributions being made by the primary income account. The primary income, secondary income, and capital accounts only contributed to overall asymmetries in particular quarters.
Chart 13
Intra-euro area financial account asymmetries
(EUR billions)
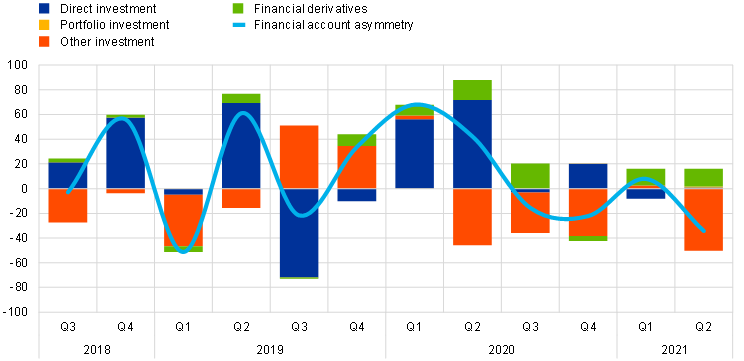
Source: ECB.
In the financial account, asymmetries were mainly recorded in direct and other investment. Portfolio investment and related income do not show asymmetries by construction, owing to the residual compilation approach at euro area level. Financial account asymmetries were fairly volatile in the period under review, with periods in which asymmetries in direct and other investment offset each other alternating with periods in which they both contributed in the same direction to the overall asymmetry.
8.2 Bilateral asymmetries
With the update of the ECB Guideline on external statistics, quarterly bilateral transactions, and positions between euro area countries are now transmitted to the ECB on a mandatory basis for several b.o.p. categories and instruments. Owing to longer times series (the data having previously been sent on a voluntary basis only), analysis of bilateral asymmetries between euro area countries is performed here only for direct investment. The analysis will be extended to other items as longer time series become available.
The internal country geographical quality indicator (ICGA) and external country geographical quality indicator (XCGQ) are measures that summarise the quality of the geographical breakdown. The ICGQ aims to assess the accuracy of individual countries’ geographical classification within the sample of countries for which bilateral data are available by aggregating absolute bilateral asymmetries. Meanwhile, the XCGQ aims to show how well a country’s reported intra-euro area aggregate matches its mirror data, calculating the difference between the intra-euro area figure reported by the country under consideration and the corresponding figure derived from counterpart data. More information on these indicators can be found in the section on “Methodological documentation for quality indicators”.
The results of the ICGQ indicator for FDI transactions were characterised by significant variability across countries and over time. Several countries consistently recorded high scores across the entire time period, indicating structural problems in matching counterparts’ transactions. Meanwhile, the majority of countries experienced high volatility in the measures over time, pointing to quarter-specific problems in capturing the geographical detail of transactions rather than structural issues.
The results for the XCGQ indicator were generally better than those recorded for the ICGQ, given that the XCGQ indicator is less about matching up individual country counterparts and merely measures how well the counterparts as a group match a country’s estimate for that group. Consequently, most of the countries performed relatively well across the entire time period. This finding is welcome from the point of view of the quality of overall euro area data. Nonetheless, several countries still recorded fairly poor results in several quarters.
For both quality measures, the results recorded for FDI positions were better than those observed for transaction data.
Overall, it appears that countries that are characterised by large numbers of SPEs and that are known to face challenges when it comes to capturing and measuring the activities of those institutions were found to have structural problems in matching the figures provided by their euro area counterparts.
Further information on summary indicators of bilateral asymmetries is available in Tables A.1.14.1 to A.1.14.4 in the Annex.[59]
MIP Box 1
Quality indicators for the b.o.p. and i.i.p. statistics underlying the MIP
The MIP scoreboard for the Alert Mechanism Report (AMR) consists of 14 headline indicators with thresholds (complemented by auxiliary indicators with no thresholds). The composition of the MIP indicators is subject to review and evolves over time in order to reflect the latest developments or increased data needs. Most of these indicators are composite, i.e. they make use of at least two data sources.
B.o.p. and i.i.p. data underpin the construction of the following three headline indicators:
- current account balance (percentage of GDP), three-year backward-moving average (up to 13 years of data required);
- net international investment position (percentage of GDP) (up to ten years of data required);
- export market share (percentage of world exports), five-year percentage change (up to 15 years of data required).
Additionally, b.o.p. and i.i.p. data are also used for five auxiliary indicators:
- current plus capital account balance (net lending/borrowing) (percentage of GDP) (ten years of data required);
- net international investment position excluding “non-defaultable” instruments[60] (NENDI) (percentage of GDP) (ten years of data required);
- FDI in the reporting economy, flows (percentage of GDP) (ten years of data required);
- FDI in the reporting economy, positions (percentage of GDP) (ten years of data required);
- export performance against advanced economies (percentage of OECD exports), five-year percentage change (15 years of data required).
Together, these indicators provide analytical evidence of possible vulnerabilities and risks that would require further investigation at country level.
The following sections assess the fitness for purpose of the b.o.p. and i.i.p. data used for the MIP, analysing the data vintage used in the 2021 Alert Mechanism Report.
Institutional set-up
B.o.p. and i.i.p. data are transmitted to the ECB, on the basis of ECB Guideline on external statistics, and to Eurostat, on the basis of Regulation (EC) No 184/2005. This quality report follows the basic principles laid down in the document “Public commitment on European statistics by the ESCB” and is a requirement under Article 6(1) of ECB Guideline on external statistics. This report is fully coordinated with the report produced by the European Commission (Eurostat) on the basis of Article 4(4) of Regulation (EC) No 184/2005. The quality assessment of the Eurostat report is conducted in accordance with the “European Statistics Code of Practice”.
The indicators used for the MIP are provided by Eurostat on the basis of statistics compiled in the Member States by either NSIs or NCBs. A MoU (and the related letters that were exchanged) was therefore signed in November 2016. Under this, the European Commission and the ECB mutually recognised the quality assurance frameworks in place for the European Statistical System (ESS) and the ESCB and established practical working arrangements for cooperation with regard to the quality assurance of the statistics underlying the MIP.
The MoU specifies that Eurostat and the ECB’s Directorate General Statistics (DG‑S) should regularly conduct assessments of the quality of national datasets. More specifically, it requires the ECB/DG‑S to run its quality procedures for the datasets reported by NCBs, and to provide Eurostat with quality-assured datasets and/or information on the quality of the data after the regular data transmission in September/October each year. The MoU also provides for visits by the ECB/DG‑S and Eurostat to NCBs and/or NSIs to facilitate assessment of the output quality of MIP-relevant data. As a result of those visits, the recommendations made for improving data quality are included in the relevant sections of this report.
To ensure full transparency as regards to the quality of MIP-related statistics, a three-level quality reporting system has been set up over the past years, with the support of the CMFB. That system consists of national self-assessment reports (Level 3), which, in turn, feed into the domain-specific quality reports (Level 2) – including this report – which are coordinated between ECB and Eurostat. Finally, a joint Eurostat/ECB summary report assessing the quality of all statistics underpinning the MIP (Level 1) is published each year on the CMFB’s website.
Data availability and confidentiality
The relevant ECB and European Parliament and Council legal acts do not impose backdata requirements, in compliance with the BPM6 statistical standard. Despite this, the majority of national compilers have provided the backdata for the current account and net international investment position that are required for calculation and analysis of the main indicators.
As regards the auxiliary indicators, a coverage limitation is still affecting calculation of the indicator added in 2018 (net international investment position excluding “non-defaultable” instruments – NENDI), which uses positions in equity securities. These details are not available or are not of good quality for Malta (given that it also includes investment funds shares) and Romania (available since 2005, but reliable only from 2012).
Sources and methods
The introduction of the BPM6 provided an opportunity for a large group of countries to move over to survey-based systems as an alternative to the traditional international transaction reporting (“settlement”) systems. B.o.p. and i.i.p. statistics are, by their very nature, based on a multitude of data sources, relying on micro datasets (e.g. the CSDB), macro datasets, direct reporting, and counterpart information, statistical surveys, and administrative datasets (e.g. for the general government sector).
While compilation of b.o.p. and i.i.p. data in EU Member States is deemed methodologically sound, there are challenges when it comes to measuring some components and complying with all EU recommendations and/or BPM6 standards. One of the challenges that still remains is the measurement of some components of FDI. In particular, (i) in the coverage of transactions between fellows and reverse investment in equities, (ii) the direct investment income generated by indirect (non-immediate) direct investment relations, and (iii) the valuation of unlisted shares and other equity, which may affect the accuracy and comparability of some details.
In addition, the impact of the economic globalisation on macroeconomic statistics increases the difficulties faced by countries in collecting accurate and consistent data from multinational enterprises. The tools put in place to facilitate the exchange of information between countries (FDI network and the Asymmetry Resolution Meetings (ARMs) are proving to be efficient in improving the capture of those large operations and in fostering the sharing of (micro) data). On occasions, this improvement in accuracy is reflected in the revisions.
For more detailed information, see Table 1 in the executive summary and Section 2.
Accuracy and reliability
Since the last review period, few countries have implemented national accounts and b.o.p./i.i.p. benchmark revisions that have supported the alignment of national accounts (ESA 2010 data) with b.o.p./i.i.p. statistics (in 2020, Luxembourg, Romania, and Slovakia). These revisions and other regular revisions (i.e. in net position for Ireland, Germany, Belgium, and Hungary) have not significantly altered the analytical interpretation of the indicators, with a few exceptions: the current account indicator moved outside the threshold window in Ireland, Slovenia, and Romania.
Internal consistency
For the quarterly b.o.p., most countries fulfil all validation (accounting) rules. However, the reconciliation of positions and flows remain an outstanding issue for a few countries (Belgium only in FDI, the Netherlands), as well as the reporting of zero in some series (Croatia and Malta).
As regards series breaks, the following issues were identified:[61]
Germany: Major breaks are observed due to the reclassification of positions between fellow companies from other investment to direct investment in Q4 2012;
Croatia: Major breaks are observed in financial derivatives assets stocks in 2014, in direct investment assets stocks between Q4 2010 and Q1 2014 and in secondary income debit after Q2 2013;
The Netherlands: Major breaks are visible for several items between Q4 2014 and Q1 2015 due to the introduction of new data sources and an updated compilation system;
Luxembourg: Relevant series breaks in FDI positions are observed in Q4 2011 and Q4 2014 as a result of changes in the coverage of SPEs;
Slovakia: Portfolio investment equity (listed shares) exhibits breaks in 2010 and 2012 (assets and liabilities, respectively).
It should be noted, however, that countries are making continuous efforts to improve their data. Data transmissions submitted after the review period have already resulted in improved data quality.
National net errors and omissions are still above 2% of GDP in Ireland, Malta, Finland, Bulgaria, and Denmark (see Chart MIP A) and, with the exception of Malta and Bulgaria, it slightly increased in the last review period. Below this threshold, the net errors and omissions improved for Italy, Cyprus, and Slovakia, while it continued to worsen for Austria and Romania. In this regard, it is important to highlight that some euro area countries have formal correction mechanisms to address this problem, naturally leading to reduced levels of errors and omissions.
Chart MIP A
Average absolute net errors and omissions

(percentage of GDP)
Source: ECB.
External consistency
The methodological differences between the b.o.p./i.i.p. and the RoW account (national accounts) were removed with the introduction of the ESA 2010 and the BPM6. Further inconsistencies between the two statistical domains were, for the most part, removed toward the end of 2019 with the implementation of the CMFB medium-term work plan. In addition, Luxembourg recently made enormous progress with the consistency of non-financial flows, and Germany improved the consistency for positions on listed shares liabilities.
That notwithstanding, discrepancies above 0.5% of GDP are still recorded in both credits/debits for current accounts in four countries, i.e. France, Luxembourg, Malta, and Slovakia, and in debits in three more countries, i.e. Greece, Bulgaria, and Czech Republic. Nonetheless, with few exceptions (Malta and Luxemburg – only in debits), none of the discrepancies recorded were above 2% of GDP. For financial account positions, the discrepancies between the i.i.p. and the RoW account of over 10% of GDP occurs in three cases: Ireland, France (in assets only), and Malta.
The remaining discrepancies will be analysed in depth by ECB and Eurostat and the most relevant outstanding differences will be addressed.
MIP Table A
Annual absolute revisions – balance/net items for 2019
(percentage of GDP)
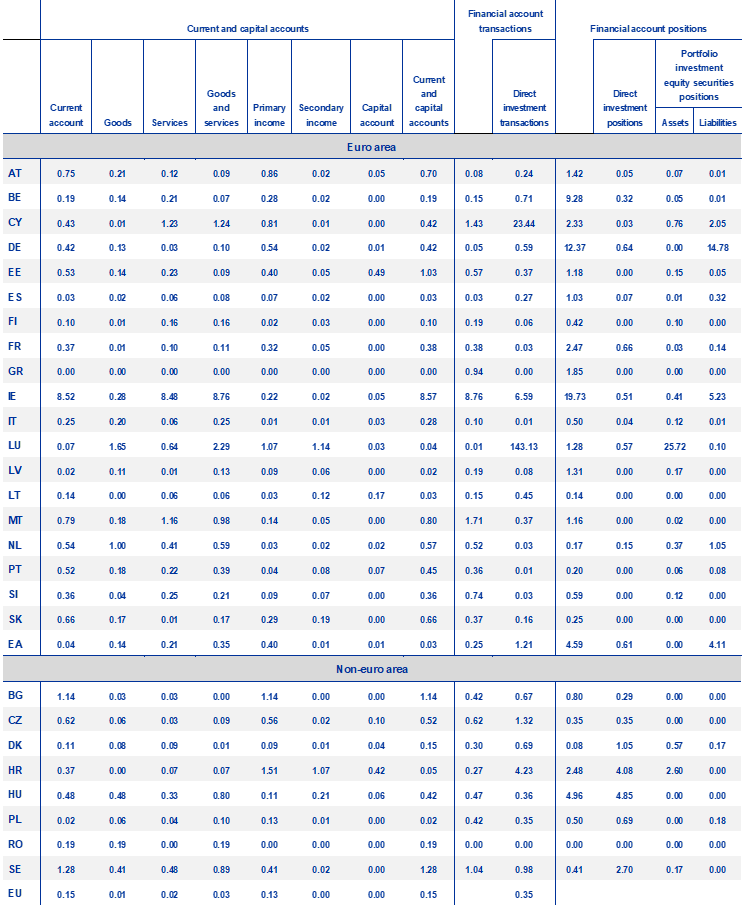
Source: ECB.
Note: All the indicators are compiled using neither seasonally adjusted nor calendar adjusted data.
Annexes
See more.
© European Central Bank, 2022
Postal address 60640 Frankfurt am Main, Germany
Telephone +49 69 1344 0
Website www.ecb.europa.eu
All rights reserved. Reproduction for educational and non-commercial purposes is permitted provided that the source is acknowledged.
For specific terminology please refer to the ECB glossary (available in English only).
PDF ISBN 978-92-899-4351-2, ISSN 1830-3439, doi:10.2866/096498, QB-AU-20-001-EN-N
HTML ISBN 978-92-899-4352-9, ISSN 1830-3439, doi:10.2866/990197, QB-AU-20-001-EN-Q
The principles underpinning this report can be found in Public commitment on European Statistics by the ESCB. The ECB Statistics Quality Framework and quality assurance procedures, published in April 2008, build on the ESCB public commitment with respect to its statistical function.
Recast of Guideline ECB/2004/15 of 16 July 2004, as amended by Guidelines ECB/2013/25 of 30 July 2013, ECB/2015/392 of 26 November 2015, ECB/2018/19 of 2 August 2018 and ECB/2020/52 of 14 October 2020.
The principles underpinning this report can be found in the document “Public commitment on European Statistics by the ESCB” on the ECB’s website. The ECB Statistics Quality Framework (SQF) and quality assurance procedures, published in April 2008, build on the ESCB public commitment on European statistics.
Recast of Guideline ECB/2004/15 of 16 July 2004 (as amended).
While Eurostat publishes a similar report assessing the quality of the same data, the calculation of the indicator sometimes yielded marginally different results owing to different vintages used. Both reports cover figures vis-à-vis the rest of the world. The ECB report additionally analyses figures vis-à-vis the extra-euro area, whereas the Eurostat report assesses figures vis-à-vis outside the EU.
In addition to regular contact during the euro area aggregates production cycles, the ECB and Eurostat also carry out country visits to better understand output quality and the respective contributing factors in the context of the MoU on MIP.
See paragraph 6.28 of BPM6.
Latvia has confirmed that the transactions and positions between fellow enterprises are covered, but mostly negligible (less than €1 million), and therefore reported as zero. In most cases, transactions and positions in equity between fellow enterprises are indeed negligible. However, the status of this information will be reassessed periodically.
Under Estonian national legislation, foreign subsidiaries are not allowed to invest in the equity of their Estonian parent companies. Consequently, reverse investment on the liability side is not possible. Estonia collects reverse investment on the asset side, but no such transactions have been reported yet; Estonia therefore reports zero values.
Slovakia confirmed that transactions and positions between fellow enterprises in equity and reverse direct investment in equity are negligible.
France has confirmed that reverse direct investment transaction/positions in equity are negligible based on a reassessment made in 2020 based on up-to-date data (i.e. 2018).
Cyprus has confirmed that reverse direct investment transaction/positions in equity are zero.
Lithuania and Austria have confirmed that reverse direct investment transaction/positions are negligible.
Germany has information/evidence of only one reverse-equity relationship and therefore does not include this sub-aggregate in official b.o.p. statistics.
Malta has confirmed that figures for reverse direct investment transaction/positions in equity are assessed negligible.
Cyprus will update the public metadata in order to reflect that employee stock options are non-zero. They are included under the total category “financial derivatives (other than reserves) and employee stock options”.
Finland reported estimations for exports of euro banknotes (central bank liabilities) assuming that the currency actually put in circulation by the central bank was equal to the banknotes held by residents. Therefore, the difference between the currency actually put into circulation and the legal issuance of currency based on the Banknote Allocation Key (i.e. the technical claims) is their best estimation of euro currency holdings abroad.
Malta has reported estimations of imports of euro banknotes (central bank assets) from the Q1 2018 to Q4 2020 reference period. However, the related (accumulated) stocks were reported simultaneously as assets and liabilities in 2018 and 2019.
France has reported assets on F6 stocks and flows for non-financial corporations up to Q4 2019.
In Finland, data for the asset side are not available prior to 2016, i.e. before the availability of Solvency II data.
Latvia has confirmed that transaction/positions between residents and non-residents are covered for all sectors of the economy but in most cases the amounts are negligible (less than € 1 million) and therefore reported to zero.
This increase in assets coverage for the German i.i.p. is not yet visible in the vintage assessed in the quality report.
Infringements in relation to b.o.p. and i.i.p. statistics and the international reserves template for Guideline ECB/2011/23, are also included in annual compliance reports prepared by the ECB Internal Compliance Coordination Group and are submitted to the Governing Council.
Council Regulation No 2533/98 concerning the collection of statistical information by the ECB outlines the ESCB statistical confidentiality regime. In addition, the so-called ECB Confidentiality Guideline of 22 December 1998 (ECB/1998/NP28) sets out the common rules and minimum standards for protecting the confidentiality of statistical information collected by the ECB with the assistance of the national central banks.
The publishable series included in Table 2 refers to Table 2A and Table 4A of Annex II to the ECB Guideline on external statistics, as amended by Guideline ECB/2015/39. The ECB Guideline on external statistics recommends that all items contained in the publishable subset should be marked as “free for publication”. The provision applies to data as of the Q1 2014 reference period.
According to the ECB Guideline on external statistics, valid before the Q4 2020 reference period.
In June 2022, NL intends to revise the flag on the monthly dataset as “non-publishable”, back from 2015”.
The indicators are explained in more detail in Annex 9.2.
In this report, directional stability/reliability indicators are only used to complement the analysis based on the relative size indicators.
Cyprus revisions can be mostly attributed to better/enhanced coverage of SPEs.
As already mentioned, revisions for Cyprus can be mostly attributed to better/enhanced coverage of SPEs.
This was possibly connected to improvements to data sources in the context of the benchmark revision.
After the cut-off date, the Netherlands transmitted revisions with severe time inconsistencies for the period covered in this report. Those inconsistencies are not reflected in the annex tables.
Ideally, the average absolute n.e.o. relative to current account gross flows should be computed using the first assessment (the first-time data are transmitted to the ECB). However, an insufficient number of first assessments for n.e.o. means that a proper calculation of this indicator is not possible for the time being. Future quality reports may address this issue.
A complete list of the conceptual differences between BPM6 and international merchandise trade statistics (IMTS) is provided in Annex F to “International Merchandise Trade Statistics: Concepts and Definitions 2010”.
In the case of Malta, yachts and aircraft are only deemed to be operationally leased and are therefore removed from goods for b.o.p. purposes.
B.o.p. goods sub-item general merchandise (G1), national concept, was used to calculate the directional reliability indicator.
The harmonised EU revisions policy also supports consistency between the two statistical domains. In addition, the ECB and Eurostat have jointly provided methodological advice to national compilers on selected topics.
Besides the non-identical interpretations given in the two manuals, the use of different data sources or different compilation methods also contribute to the outstanding differences.
For this purpose, all the visits include specific action points aimed at addressing the differences between both domains.
Some national contributions to RoW data were not shared with the ECB owing to data validation issues. This affects the comparability of detailed current account data for Bulgaria, Czech Republic and Romania.
Some countries have achieved the aforementioned consistency between the two statistical domains but still record differences between the b.o.p./i.i.p. and RoW data that are slightly above the thresholds agreed with the STC.
Improvements to quarterly data will be introduced in 2022 with the production of quarterly “supply and use tables”.
In the RoW dataset, an elaborate method is used to estimate market prices, while in i.i.p. statistics the own funds at book value methodology is consistently applied.
For Estonia, the main reason for the discrepancies is the recording of assets against EBA cleaning, i.e. whether to record them as loans-deposits or as other assets.
See ECB, “Estimation of euro area currency in circulation outside the euro area”, April 2017.
See Regulation ECB/2013/38 of the European Central Bank concerning statistics on the assets and liabilities of investment funds. Investment funds are defined as “other financial intermediaries except insurance corporations and pension funds” and exclude MMFs.
Securities holdings statistics (SHS) data are collected by the Eurosystem in accordance with Regulation ECB/2012/24 (as amended).
SHSS figures can be reported as portfolio investment, direct investment and not specified. When compared with i.i.p. both comprise portfolio investment holdings of debt securities and equity On the SHSS side, securities with the functional category “not specified” are also included as they represent around 20% of total euro area debt securities and equity positions, and are mainly attributable to Ireland and to lesser extent to Italy.
Unlisted shares and other equity both fall outside the scope of SHS statistics.
The discrepancy recorded by Cyprus reflects an over-coverage of SHSS amounts.
Non-ISIN debt securities holdings are reported to the securities holdings statistics database (SHSDB) by Belgium, Germany, Ireland, Greece, Latvia, Lithuania, the Netherlands, Slovenia, and Finland.
To a large extent, the gap for Italy reflects the grossing-up performed on the i.i.p. side to estimate households’ holdings of investment fund shares/units issued by other euro area countries.
Since December 2021, with the inclusion of Solvency II information in the i.i.p., the existing gap was reduced by half (i.e. from around €100 billion to €50 billion).
The following principles underlie this exercise and the results provided in the main text and associated annex tables:
- The analysis was performed on data for the Q3 2015 to Q2 2018 reporting period.
- The measures were calculated for each reporting period, with analysis only carried out for countries that met a coverage threshold of 80% (i.e. if more than 20% of the value allocated to the euro area aggregate was not geographically specified, the cell was supressed).
- The results are presented using a traffic light approach. Each cell is coloured using a continuous scale, ranging from green (value of 0) to red (value of 1).Instruments that cannot be subject to default: foreign direct investment equity and equity shares and inter-company cross-border FDI debt.
Transmission of data prior to 2013 is not required by the ECB Guideline on external statistics but provided on a best-efforts basis.
-
16 May 2022