

- SPEECH
Mind the step: calibrating monetary policy in a volatile environment
Keynote speech by Fabio Panetta, Member of the Executive Board of the ECB, at the ECB Money Market Conference
Frankfurt am Main, 3 November 2022
The euro area is facing a sequence of unprecedented supply shocks resulting from the pandemic and Russia’s aggression against Ukraine. These shocks have compounded each other and caused the current spike in inflation. Price pressures have broadened as firms have sought to pass higher costs on to consumers as the economy reopened.
As a result, the ECB has accelerated the adjustment of monetary policy to keep inflation expectations anchored at levels consistent with its target. Across the last three Governing Council meetings, we have increased our interest rates by 200 basis points. This is the fastest rate hike in the ECB’s history.
Looking ahead, the medium-term inflation outlook presents clear upside risks in a general context of extraordinary uncertainty about the future evolution of the European economy.
Today I will argue that, at present, the direction of monetary policy is clear. A further policy adjustment is warranted in order to keep inflation expectations anchored and stave off second-round effects. However, the calibration of our stance should not rely on a one-sided view of risks − especially as we continue normalising our monetary policy in a highly uncertain economic environment. And it should remain focused on medium-term inflationary developments.
We need to bring inflation back to our 2% target as soon as possible, but not sooner.
We might otherwise create unintended effects, achieving little reduction of inflation in the short term, but causing excessive market volatility and a protracted economic slowdown beyond what is necessary to stabilise inflation in the medium term.
Implementing the correct calibration of monetary policy will be challenging. We will need to carefully consider the resilience of our economy, the implications of global monetary spillovers, and emerging threats to financial stability.
Trade-offs in setting the appropriate monetary policy stance
In the current situation, the direction of our monetary policy is clear.
Inflation in the euro area is too high and will remain above our target for an extended period. Headline inflation reached 10.7% in October. Core inflation is around 5%.[1]
Monetary policy normalisation is necessary when repeated supply shocks drive inflation higher for longer.[2] It signals that the central bank will not tolerate a de-anchoring of inflation expectations, reducing the likelihood of such a de-anchoring occurring. And it guards against the risk that monetary policy could exacerbate inflationary pressures by stimulating demand.[3]
But while the direction of the adjustment is clear, its calibration is not and its end point depends on the evolving medium-term economic and inflation outlook.
The neutral interest rate provides limited guidance here. It is an asymptotic concept that describes the point when interest rates are neither accommodative nor contractionary in a situation where growth is around potential, inflation is not far from target and no transitory shocks are disrupting the inflation path. But that is not the world in which we find ourselves.
Moreover, the neutral rate is unobservable. As I have argued elsewhere,[4] estimates of the neutral rate are imprecise and widely dispersed. They are subject to considerable uncertainty in a post-pandemic world that has undergone structural change.[5]
Today, I find it more helpful to discuss the target-consistent terminal rate.
This is the level of the policy rate that − if reached at the end of a short normalisation phase and then held constant − stabilises inflation at target by the end of the policy-relevant horizon in the absence of new shocks. I prefer the concept of the target-consistent rate to that of the neutral rate because it emphasises that we can gear our policy to a clear state-contingent reference in order to bring inflation back to target within a clearly defined period.
Eurosystem staff regularly calculate estimates of the target-consistent terminal rate, which are an input into the preparation of our monetary policy meetings.[6] But let me stress that these estimates are conditional on the economic and inflation outlook. They need to be continually reassessed in the light of incoming information.
Specifically, we need to navigate a complex set of risks to medium-term inflation.
On the upside, we could face the emergence of what I have called “ugly” inflation.[7] This arises when above-target inflation de-anchors expectations, causing excessive wage and price-setting dynamics that eventually fuel further inflation increases (the second-round effects).
At present, this risk is mostly driven by high energy prices and their pass-through to prices of other items. Annual energy inflation is running at around 42%. Energy has been the main contributor to headline inflation for the past 18 months (Chart 1). Higher energy input costs have contributed to extraordinarily high food inflation. They have been a key driver of goods and services inflation (Chart 2). And by dragging down the trade balance and weighing on the economic outlook, they are contributing to the depreciation of the euro, further reinforcing inflationary pressures (Chart 3).
Chart 1
Contributions of components of euro area headline HICP inflation
(annual percentage changes and percentage points contributions)
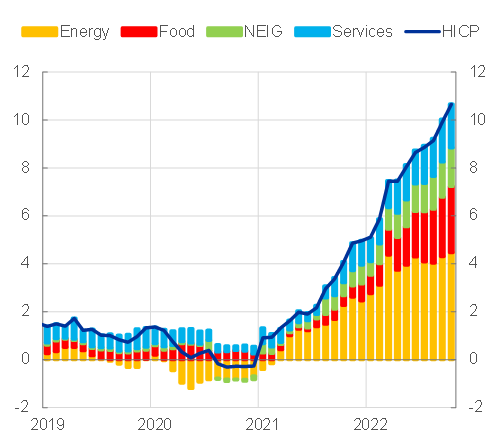
Sources: Eurostat and ECB calculations.
Notes: NEIG stands for “non-energy industrial goods”. The latest observation is for October 2022.
Chart 2
Contributions of energy-sensitive components to goods and services inflation in the euro area
(annual percentage changes and percentage point contributions)
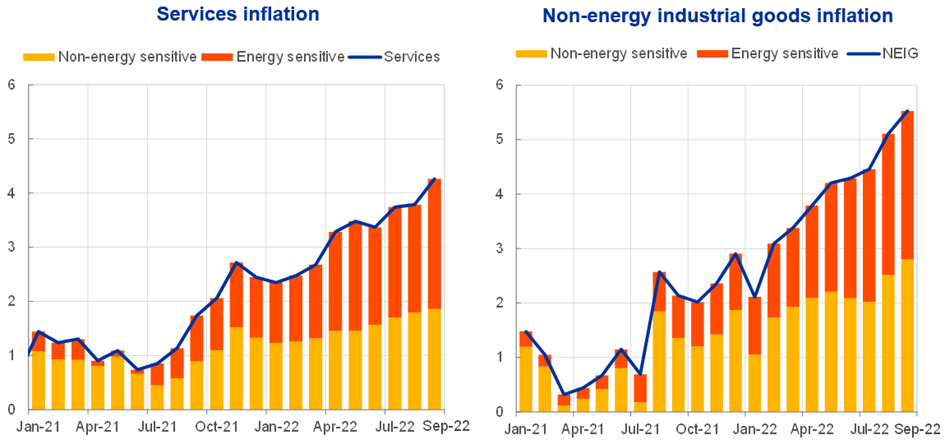
Sources: Eurostat and ECB staff calculations.
Notes: The term “energy-sensitive component” reflects items with a share of energy in direct costs above the average share of energy across services items (left-hand panel) and non-energy industrial goods (NEIG) items (right-hand panel). The latest observations are for September 2022.
Chart 3
Drivers of the euro-US dollar exchange rate
(cumulative changes since January 2022, percentage changes and percentage point contributions)
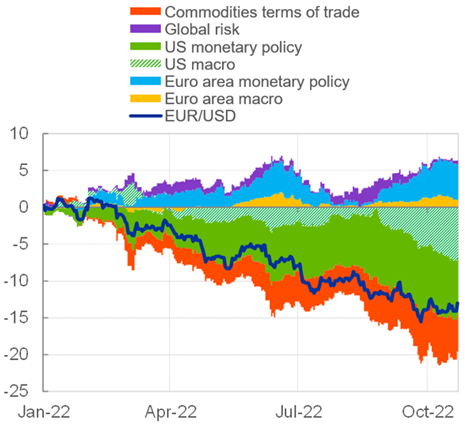
Sources: ECB and ECB calculations.
Notes: A decrease denotes a euro depreciation against the US dollar. The decomposition of exchange rate changes is based on an extended two-country Bayesian vector autoregression (BVAR) model including ten-year euro area overnight index swap rate, euro area stock price, EUR/USD, ten-year euro area overnight index swap-US Treasury spread, US stock prices and the relative Citi commodities terms-of-trade index in the euro area compared to the United States. An adverse euro area terms-of-trade shock is assumed to depreciate the euro against the dollar, reduce euro area equity prices, and increase euro area yields and yield spreads against the United States. Identification via sign and narrative restrictions, using daily data. The latest observation is for 24 October 2022.
So far, inflation expectations have remained anchored and the risk of an incipient wage-price spiral in the euro area has been contained. Nominal negotiated wage growth has ticked up recently but is still far from compensating for the drop in real incomes caused by higher inflation.[8] And the outlook for wage growth and unit labour costs remains consistent with our target overall.[9] But we need to remain extremely vigilant in view of prolonged high inflation, which increases the likelihood of a pass-through to wage growth[10], especially as labour markets are now tighter than before the pandemic.
But other forces may increasingly push in the opposite direction and contain the risk of second-round effects, as what I have dubbed “bad” inflation – the inflation resulting from supply shocks – compresses real incomes.
The reduction in real wages and purchasing power is weakening domestic demand, with several leading indicators already pointing to a likely contraction in economic activity, starting from the last quarter of this year. The euro area PMI composite output index fell in October to its lowest level since November 2020,[11] with forward-looking indicators of activity particularly weak.[12] Consumer confidence plummeted to historical lows.[13] And financial and credit indicators also point to significant downside risks to GDP growth (Chart 4).[14]
Chart 4
Downside risks to euro area real GDP growth
Lower tail of the distribution of real GDP growth forecasts for Q1 and Q3 2023 based on “GDP-at-risk” models
(quarter-on-quarter change in percentage points)
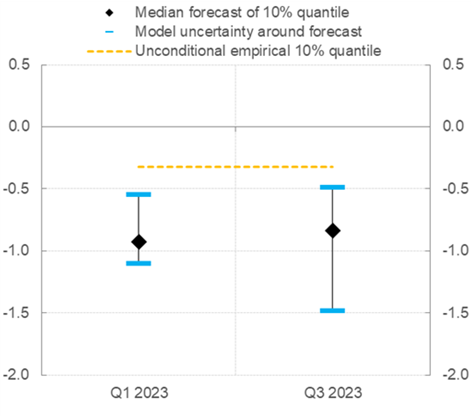
Source: ECB calculations.
Notes: For each horizon, the chart shows the median of estimates of the lower quantile (10th percentile) forecast across the suite of “GDP-at-risk” models maintained by ECB staff, as well as the interquartile range to account for model uncertainty. These estimates are predicated mainly on developments in financial conditions, credit, risk, and the macroeconomy. Forecasts are conditional on financial data up to mid-October 2022 and real economy indicators up to the end of September 2022.
These forces pushing on the downside might be reduced if supply bottlenecks continue to ease (Chart 5) and energy commodity and electricity prices continue to fall from their highs (Chart 6).[15] But this would then also improve the inflation outlook and reduce the likelihood of “ugly” inflation taking hold.
Chart 5
Easing of supply chain bottlenecks
PMI suppliers’ delivery times (left panel) and Global Supply Shortages Index (right panel)
(diffusion indices)
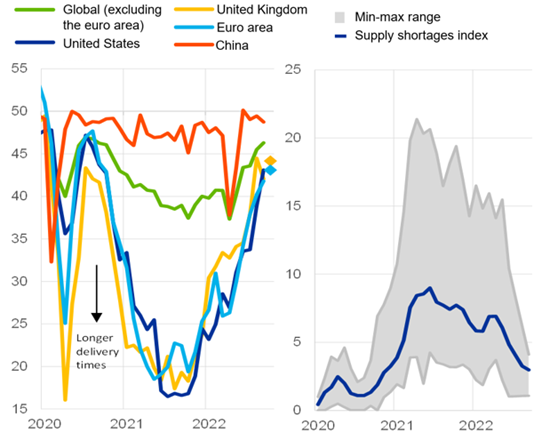
Sources: S&P Global, Markit and ECB staff calculations.
Notes: The Global Supply Shortages Index measures how many selected items have been in short supply against their long-run average for each month. The long-run average refers to value 1 of the index. The shaded minimum-maximum range refers to the 5th-95th percentile range across 20 items (e.g. chemicals, electrical items, packaging, steel and textiles). The latest observation are for September 2022 and October 2022 (Flash PMI estimates for the United Kingdom and the euro area).
Chart 6
Spot prices of oil, gas, coal and electricity
(EUR/MWh for gas and electricity (left-hand scale), USD/barrel for oil (right-hand scale))
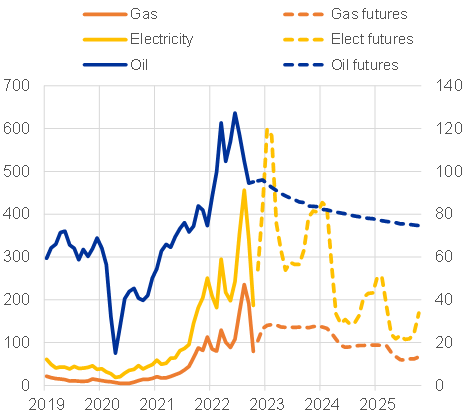
Sources: Refinitiv, HWWI, Energy Intelligence and ECB staff calculations.
Note: The latest observation is for October 2022.
To sum up, the implementation of monetary policy presents us with a difficult trade-off. On the one hand, our need to ensure that inflation expectations remain anchored speaks for targeting the upper part of the range of estimates of the target-consistent terminal rate. And this range would move higher if upside risks to medium-term inflation materialised.
But, on the other hand, in setting the monetary policy response we need to keep basing our decisions on the latest evidence and factor in downside risks to the economic outlook.
Policy normalisation, transmission lags and global spillovers
In recent months, the public debate has stressed the risks of doing too little to curb inflation, since this would require a more painful future adjustment. But this should not make us underappreciate the risk of doing too much.
First, we should bear in mind that it takes time before the full impact of our measures is felt in the economy.[16] Moreover, monetary policy is transmitted to different variables with different lags.
It immediately affects market expectations and financial market conditions through bond yields, equity prices and exchange rates. Since we started normalising monetary policy at the end of 2021, the one-year forward real rates have moved significantly higher across the entire term structure (Chart 7) and the one-year forward real rate one year ahead is now in positive territory. Likewise, nominal and real ten-year rates have increased by around 300 and 250 basis points respectively (Chart 8).
Chart 7
Change in euro area forward real interest rates
(percentage points)
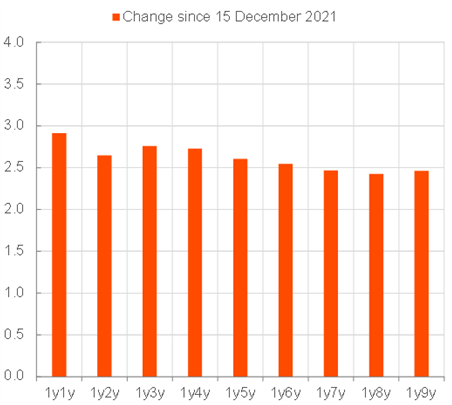
Sources: Bloomberg, Refinitiv and ECB calculations.
Notes: Real forward rates are calculated by subtracting the inflation-linked swap forward rates from the nominal overnight index swap forward rates for each maturity. The latest observation is for 20 October 2022.
Chart 8
Ten-year real, nominal and inflation-linked swap rates for the euro area
(percentages per annum)
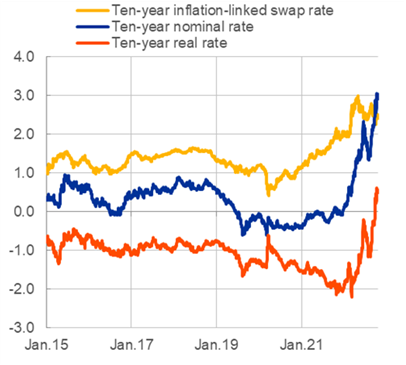
Sources: Refinitiv and ECB calculations.
Note: The latest observation is for 20 October 2022.
Crucially, however, it takes longer for our decisions to be transmitted to the real economy through changes in lending conditions and, subsequently, demand and prices. The debate should thus not be distorted by an excessive focus on short-run inflationary developments, which cannot be controlled by monetary policy. The full impact of our measures will likely reach the economy when activity and inflation are already on a declining path.[17] This implies that our tightening will need to end when inflation is still above our target.
Second, we need to factor in global monetary policy spillovers when defining the domestic stance.
With central banks across advanced economies adjusting their policies simultaneously (Chart 9), they could accentuate each other’s policy impacts if they do not sufficiently factor in the feedback loop they create.[18] ECB analysis finds that a tightening by the Federal Reserve System generates spillovers to euro area real activity and inflation that are comparable to its effects on the US economy.[19]
Chart 9
Financial conditions indices in advanced economies and emerging market economies
(standardised indices)
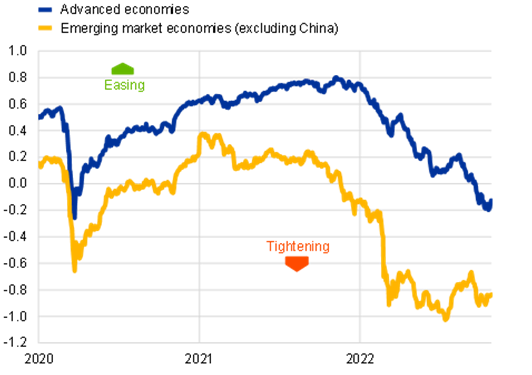
Sources: Refinitiv, Bloomberg and ECB staff calculations.
Notes: National financial conditions indices are aggregated using GDP purchasing power parity shares. The latest observations are for 6 October 2022.
It is sometimes argued that domestic inflation having a large global component should mean that domestic monetary policy needs to be tightened more forcefully to compensate for this weakened grip on prices. But if central banks across advanced economies are simultaneously tightening monetary policy – as is the case today – the opposite is true.[20]
If central banks do not fully factor in the effects of other central banks’ policies, the current phase of global adjustment may give way to a more severe slowdown than anticipated. In recent decades, episodes of highly synchronised global monetary policy tightening have been associated with subsequent global recessions (Chart 10).
Chart 10
Inflation surges, tightening synchronisation and global recessions
(percentages of countries)
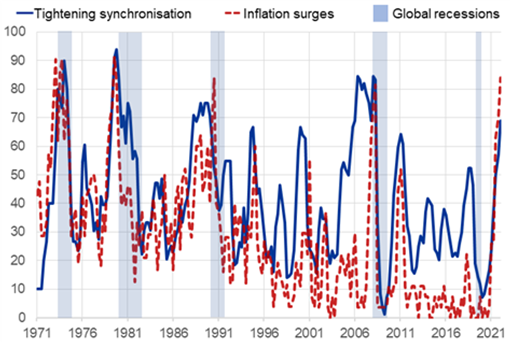
Sources: ECB calculations, BIS data and Haver Analytics.
Notes: The global “inflation surges” index (red dashed line) shows the share of countries which, at time t, are simultaneously experiencing: (1) year-on-year inflation that is higher than at time t-1; and (2) year-on-year inflation that is above a certain threshold. In this case, the threshold is given by the average of the year-on-year inflation in the post-Volcker period, from the first quarter of 1984 to the second quarter of 2022. The global “tightening synchronisation” index (blue solid line) is constructed using BIS data on the policy rates set by central banks and shows the share of countries which are tightening at time t. Global recessions are periods when: (1) annual growth of global GDP per capita is negative or close to zero; and (2) a high share of countries are in a technical recession. The latest observations are for the second quarter of 2022.
Such a scenario could have particularly negative implications for the euro area. Our economy is not only more vulnerable than others to the energy crisis, it is also more open than economies such as the United States, China and Japan, and thus more exposed to a global recession. And because it is less flexible than the US economy, reversing course may be more difficult if demand and production weaken too much.[21]
Avoiding unintended effects in a volatile market environment
Incorrectly calibrating our monetary policy could also have unintended effects for financial stability and the transmission of our monetary policy.
The highly uncertain outlook has increased the sensitivity of market rates to new developments and shifts in risk sentiment. In turn, higher rates are exacerbating risk aversion, exposing the vulnerabilities of certain highly leveraged segments – such as residential property markets[22] – and some types of non-bank financial intermediaries[23]. These segments are vulnerable to adverse loops, with falling prices and rising rates feeding into higher debt refinancing costs, especially as falling real incomes make those costs less affordable.
This market volatility is being compounded by global financial spillovers (Chart 11). These come mainly from the United States[24], but were also visible in the reaction of euro-denominated yields to the recent episode of market repricing in the United Kingdom.
Chart 11
Global component in yields
Correlation of sovereign bond yields in advanced economies, expectations components and term premia
(correlation coefficient)
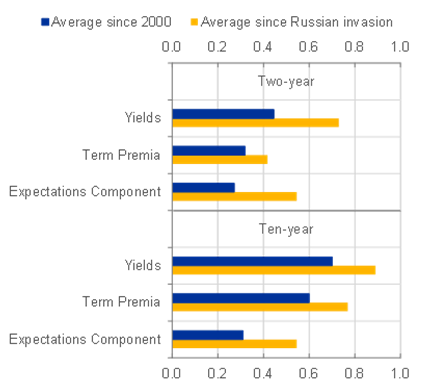
Sources: Datastream and Haver Analytics.
Notes: The sample consists of ten advanced economies (Australia, Canada, Denmark, euro area, Japan, New Zealand, Sweden, Switzerland, United Kingdom and United States). The bilateral correlation coefficients are averaged across these countries and time periods. The term premia and expectations components are the average of estimates from three models (dynamic Nelson-Siegel, rotated dynamic Nelson-Siegel and dynamic Svensson-Soderlind). The latest observations are for 21 October 2022 (daily data).
In the euro area, an additional source of volatility is the risk of financial fragmentation along national lines, which can impair the homogenous transmission of monetary policy throughout the euro area.
The current environment therefore requires us to be prudent in adjusting our monetary policy across all instruments. There are three key considerations here.
First, our decisions and communication on the pace of normalisation should avoid amplifying market volatility.
There is a case for frontloading our policy adjustment given the need to keep expectations anchored, especially in view of the very accommodative stance from which normalisation started. But such frontloading should remain commensurate to the benefits and risks it creates.
When it comes to managing inflation expectations, ECB staff analysis finds that the benefits of surprising markets with bigger-than-expected rate increases is limited in the euro area.[25] And if these bigger-than-expected increases are interpreted as signalling a higher terminal rate, rather than simply frontloading the normalisation, we could have a stronger impact on financing conditions – and ultimately on economic activity – than intended.
Additionally, a bigger-than-expected rate increase may heighten volatility and have a stronger impact in the current highly leveraged environment after a decade of very low rates and ample liquidity. So when calibrating our stance, we need to pay close attention to ensuring that we do not amplify the risk of a protracted recession or trigger market dislocation.[26]
Second, we must be clear about the sequencing of the normalisation process. We should avoid “cliff effects”, continually monitor the market response to our measures and consider the feedback between our different instruments.
Currently, our policy rate remains a suitable marginal instrument of normalisation. It is the instrument we know best. We have a comparatively limited understanding of the effects of reducing the size of our balance sheet.[27]
The size of our balance sheet will be significantly reduced as targeted longer-term refinancing operations (TLTROs) mature and banks likely make early repayments after the decision we took last week to adapt the TLTROs’ terms and conditions to the current monetary policy context.
We should take the necessary time to assess the impact of our rate hikes and of phasing out the TLTROs. As we normalise our monetary policy, we should expect bank lending conditions to tighten. What we need to avoid, though, is a sudden stop in the supply of credit to the broad economy.
We should ensure that TLTRO repayments have been absorbed before we stop fully reinvesting the principal payments from maturing securities purchased under our purchase programmes. And when considering how we would then reduce the size of our bond portfolios, a controlled reduction – whereby only redemptions above a cap are not rolled over – is preferable to active sales, which may unsettle markets in an already volatile financial environment.[28]
Third, we must ensure the smooth transmission of our stance as we normalise monetary policy.
Maintaining ample liquidity in the system will help ensure smooth money market functioning. This will allow us to continue tightly steering money markets through changes in our deposit facility rate.
But preserving smooth transmission also means being ready to intervene in a timely manner to counter unwarranted market dysfunctions, should they arise.
Our reinvestment flexibility under the pandemic emergency purchase programme – alongside the availability of the Transmission Protection Instrument, if required – protects the transmission of our monetary policy to all parts of the euro area, allowing us to set the appropriate stance. Recent months have shown that a credible ex ante commitment helps to establish a good market equilibrium, where higher yields do not drive spreads to higher levels that are disconnected from fundamentals.
We also need to stand ready to address collateral issues. Collateral scarcity has recently impaired the pass-through of our policy rates to repo rates.[29] The change in TLTRO III conditions should help alleviate tensions in the repo market[30], but we will continue to monitor the situation closely.
The importance of a consistent policy mix
As recently seen in other economies, an inconsistent policy mix can prove destabilising. So a successful normalisation process requires other policies to be consistent with monetary policy. For instance, well-designed energy and fiscal policies can make a key contribution to dampening short-term inflationary pressures, thereby helping to keep inflation expectations anchored[31] and reducing the amount of monetary tightening necessary.
To take a concrete example, the measures that have been taken to find alternatives to Russian gas, reduce gas demand and refill gas storage are likely playing an important role in bringing down gas prices. Likewise, joint initiatives at European level, common purchases and the redistribution of surplus energy sector profits can mitigate the impact of supply disruptions on energy prices. At the same time, energy policies should preserve price incentives and support energy efficiency.
Fiscal policies should aim to cushion the impact on the most exposed and fragile households and firms, while not hindering the necessary trend reduction of energy demand and adding to inflationary pressures. At the same time, they should protect economic potential and ensure that the energy shock does not permanently reduce productive capacity. Just as excessively high energy demand would risk keeping inflation high for longer, so would a slump in economic potential.
In response to the pandemic, Europeans acted together with consistent policies to protect productive capacity during the downturn.[32] To tackle the energy shock effectively, we can take inspiration from some of the EU pandemic-era instruments – such as SURE – to protect jobs and businesses that may be forced to temporarily reduce their activity. Common interventions at European level would preserve a level playing field, avoiding competitive distortions that would otherwise be detrimental to economic efficiency and the integrity of the Single Market.
Beyond targeted support in the short term, however, fiscal policy will need to focus on investment to reduce the European economy’s exposure to supply shocks, strengthen its strategic autonomy and support potential growth. Here we could take inspiration from the Next Generation EU (NGEU) instrument and move beyond reshuffling existing funds in the financing of Repower EU, matching additional investment and reform needs with adequate resources.[33]
But we should also ensure that we are implementing, in full, the agreed investments and reforms that are tied to NGEU. This will contribute to economic resilience and debt sustainability, which are crucial in view of the prevailing interest rates and growth outlook.
Conclusion
Let me conclude.
We find ourselves in an exceptionally volatile environment, with multiple and complex risks for the inflation outlook and the appropriate monetary policy response.
We are normalising our monetary policy to keep inflation expectations anchored and bring inflation back to 2% over the medium term.
But we cannot ignore the sizeable challenges that we are facing.
So we must calibrate our monetary policy carefully to ensure that inflation durably returns to our target, while also guiding market expectations and limiting excess volatility.
Our policy stance must remain evidence-based and adapt to changes in the medium-term inflation outlook, avoiding an excessive focus on short-run developments and fully taking into account the risks emanating from the domestic and global economic and financial environment.
This approach will allow us to successfully navigate the risks we face while avoiding the danger of tripping over unintended effects.
Let’s therefore mind the step in adjusting our monetary policy, so we can proceed steadily through the current shocks and bring the economy back to price stability and solid growth.
When excluding energy, food, alcohol and tobacco. Core inflation is calculated by excluding more volatile components from headline inflation.
Panetta, F. (2022), “Normalising monetary policy in non-normal times”, speech at a policy lecture hosted by the SAFE Policy Center at Goethe University and the Centre for Economic Policy Research, 25 May.
Lagarde, C. (2022), “Monetary policy in the euro area”, Karl Otto Pöhl Lecture organised by Frankfurter Gesellschaft für Handel, Industrie und Wissenschaft, 20 September.
Panetta, F. (2022), op.cit.
See Weber, A., Lemke, W. and Worms, A. (2008), “How useful is the concept of the natural rate for monetary policy?”, Cambridge Economic Journal, October, Vol. 32, No 1, January, pp. 49-63.
For instance, recent estimates by Banco de España staff suggest that the median value of the target-consistent terminal rate across a suite of macroeconomic models lies in a range between 2.25% and 2.5%. See Hernández de Cos, P. (2022), “Monetary policy in the euro area: where do we stand and where are we going?”, XXI Congreso de Directivos CEDE, Bilbao, 29 September.
Panetta, F. (2021), “Patient monetary policy amid a rocky recovery”, speech at Sciences Po, 24 November.
In the euro area, the pick-up of wage growth has been more moderate and gradual than in the United States. The annual growth rate of compensation per employee is still distorted by the impact of the government measures to prevent job losses during the pandemic. Negotiated wage growth, which is less affected by these measures, stood at 2.4% (including volatile one-off payments) in the second quarter of 2022.
To be consistent with the 2% inflation target under typical conditions, nominal wage growth should be equal to productivity growth plus 2%, which the September ECB staff projections expect to be the case in 2024.
Inflation can play a formal or an informal role in wage setting. For more than half of the private sector employees in the euro area, inflation does not play a formal role in wage setting – but is an important factor in wage negotiations especially if inflation is high. While indexation of wages to inflation applies only to around 3% of private sector employees in the euro area, inflation plays a formal role in wage setting for one fifth of euro area private sector employees. Countries in which only minimum wages are indexed to inflation account for another fifth of private sector employees. For details, see Koester, G. and Grapow, H. (2021), “The prevalence of private sector wage indexation in the euro area and its potential role for the impact of inflation on wages”, Economic Bulletin, Issue 7, ECB.
Excluding the pandemic lockdown months, this was the lowest level since April 2013. See S&P Global Flash Eurozone PMI (2022), “Eurozone economic contraction intensifies in October”, October.
The weakening is especially pronounced for indicators of new business and new orders.
The series starts in January 1985. See European Commission (2022), “Flash Consumer Confidence Indicator”, 21 October.
Downside risks are reflected in Chart 3 by depicting the lower tail (specifically the 10th percentile) of the distribution of quarterly real GDP growth forecasted for the first and third quarters of 2023 respectively. Notably, the current estimates are well below the unconditional estimate which reflects average tail risks over a long horizon. An analysis of the underlying drivers suggests that the intensification of the downside risks to real GDP growth can be traced back predominantly to heightened financial and geopolitical risk, a bleaker macroeconomic outlook, and some deterioration in credit and financial conditions.
Supply bottlenecks have started to ease in recent months and orders-to-inventory ratios have been falling rapidly. European gas prices have also fallen sharply in recent weeks.
Model-based analysis by ECB staff suggests that, on average, the impact on inflation of a 100 basis point policy rate shock builds up gradually over time to reach its peak impact during the second year following the initial shock. See Lane, P. (2022), “The transmission of monetary policy”, speech at the SUERF, CGEG|COLUMBIA|SIPA, EIB, SOCIÉTÉ GÉNÉRALE conference on “EU and US Perspectives: New Directions for Economic Policy”, 11 October.
ECB staff estimates that the downward impact on GDP growth coming from policy normalisation is on average 1 percentage point per year until 2024, while the downward impact on inflation increases gradually, reaching 1 percentage point in 2024. The estimated impact refers to the average across a set of models used by the ECB for policy simulations, including the NAWM-II model (Coenen, G., Karadi, P., Schmidt, S. and Warne, A. (2018), “The New Area-Wide Model II: an extended version of the ECB’s micro-founded model for forecasting and policy analysis with a financial sector“, Working Paper Series, No 2200, ECB, November (revised December 2019)), the ECB-BASE model (Angelini, E., Bokan, N., Kai, C., Ciccarelli, M. and Zimic, S. (2019), “Introducing ECB-BASE: The blueprint of the new ECB semi-structural model for the euro area”, Working Paper Series, No 2315, ECB, September), and the MMR model (Mazelis, F., Motto, R. and Ristiniemi, A. (2022), “Monetary policy strategies in a low interest rate environment for the euro area”, forthcoming).
Obstfeld, M. (2022), “Uncoordinated monetary policies risk a historic global slowdown”, Realtime Economics Blog, Peterson Institute for International Economics, 12 September.
Estimates are obtained based on a sample spanning 1991 to 2019, using high frequency-based US monetary policy shocks (sum of conventional, Odyssean forward guidance and quantitative easing) in monthly smooth local projections (see Jarociński, M. (2021), “Estimating the Fed's Unconventional Policy Shocks”, Working Paper Series, No 2585, ECB, August (revised June 2022)).
Obstfeld, M. (2022), op. cit.
Recent analyses show that the euro area lags notably behind the United States in terms of labour market efficiency (although levels for individual euro area countries vary, see Chart 1 in Sondermann, D. (2018), “Towards more resilient economies: The role of well-functioning economic structures”, Journal of Policy Modeling, Vol. 40, No 1, pp. 97-117). Productivity growth has also generally been lower in the euro area than in the United States for some time (see Chart 7 in Masuch, K. et al. (eds.) (2018), “Structural policies in the euro area”, Occasional Paper Series, No 210, ECB, June). These factors may limit the euro area’s relative capacity to bounce back from a recession.
ESRB (2022), “Warning of the European Systemic Risk Board”, 22 September.
Work stream on non-bank financial intermediation (2021), “Non-bank financial intermediation in the euro area: implications for monetary policy transmission and key vulnerabilities”, Occasional Paper Series, No 270, ECB, September (revised December 2021); Financial Stability Board (2021), “Global Monitoring Report on Non-Bank Financial Intermediation 2021”, December; European Systemic Risk Board (2022), “EU Non-bank Financial Intermediation Risk Monitor 2022”, July.
These financial spillovers work partly through the exchange rate. In particular, monetary policy tightening in the United States is seen as exporting inflation through the exchange rate and driving further tightening elsewhere. It is notable that this market reaction reflects the expectation that central banks are reacting to the short-term effects of exchange rates on inflation, since the empirical evidence suggests that these short-term effects are outweighed over time by the disinflationary spillovers of the Federal Reserve’s tightening.
ECB staff analysis, based on a sensitivity exercise of longer-term market-based measures of inflation compensation to larger versus smaller monetary policy shocks, suggests that, unlike in the United States, in the euro area larger monetary policy surprises do not significantly lower five-year forward five-year ahead inflation-linked swap (ILS) rates compared with smaller policy surprises.
Several episodes in the recent past – such as the “taper tantrum” of 2013, the developments in the US repo market in 2019 and the recent turmoil triggered in the UK bond market by liability-driven investors – have emphasised the importance of managing risks to market functioning.
As Olivier Blanchard recently observed in a tweet on 29 September, “When you have two instruments, and the effects of one are much better understood than those of the other, rely mainly on the instrument you know better. Focus on using interest rates, go slow on QT. There will be time to decrease your balance sheet.”
Panetta, F. (2022), op. cit.
Repurchase agreements, or repos, essentially function as a short-term secured loan in which cash is exchanged for a security (or collateral), under the agreement that the transaction is reversed at some point in the future. Repo markets are of critical importance for the smooth functioning of secondary sovereign bond markets and for providing short-term secured funding and investment opportunities for a wide range of market participants.
The change in the terms and conditions of TLTRO III makes early repayments of banks’ TLTRO borrowing more likely. These repayments will alleviate banks’ balance sheet constraints and release collateral that is currently pledged with the Eurosystem, which will increase the intermediation capacity of banks in repo markets and help to mitigate the current collateral shortage.
Respondents to the Consumer Expectations Survey who have become more positive in rating the adequacy of governmental measures in preserving their spending capacity have increased their inflation expectations by a smaller amount. Likewise, they have decreased their expectations of economic growth over the next 12 months by a smaller amount.
Panetta, F. (2022), “Europe’s shared destiny, economics and the law”, Lectio Magistralis on the occasion of the conferral of an honorary degree in Law by the University of Cassino and Southern Lazio, 6 April; Panetta, F. (2022), “Europe as a common shield: protecting the euro area economy from global shocks”, keynote speech at the European Parliament’s Innovation Day “The EU in the world created by the Ukraine war”, 1 July.
See footnote 28.
Evropská centrální banka
Generální ředitelství pro komunikaci
- Sonnemannstrasse 20
- 60314 Frankfurt am Main, Německo
- +49 69 1344 7455
- media@ecb.europa.eu
Reprodukce je povolena pouze s uvedením zdroje.
Kontakty pro média-
3 November 2022