
- Speech
The euro area outlook: some analytical considerations
Speech by Philip R. Lane, Member of the Executive Board of the ECB, at Bruegel
Brussels, 5 May 2022
Introduction
There are three main analytical challenges in assessing the economic and inflation outlook for the euro area. First, the pandemic remains a first-order driving force. Over the winter, pandemic restrictions still limited economic activity in the euro area. While these restrictions are currently being lifted and case numbers are declining, the current set of restrictions in China is contributing to a further wave of bottleneck pressures in global supply chains and limiting domestic demand in a major region of the world economy. At the same time, the re-opening of the European economy and the prospects for a more normal summer tourist season are set to provide significant momentum in the coming months, especially for services sectors and tourist-intensive countries.
Second, the significant jump in energy prices since the summer of 2021 represents a major macroeconomic shock. In particular, since oil and gas are primarily imported into the euro area, this constitutes a major adverse terms of trade shock, reducing the aggregate real income of the euro area. In addition to the adverse implications of lower real income for consumption and investment, a persistent increase in energy prices may reduce aggregate supply capacity by making it uneconomic to operate energy-intensive production technologies at full capacity in some industries. This concern applies especially to the tradables sector to the extent that there has also been an increase in the relative price of energy in Europe compared to other parts of the world. In terms of inflation dynamics, even if a rise in energy prices is ultimately a level effect, a protracted phase of temporarily-high inflation runs the risk of affecting medium-term inflation dynamics through a re-setting of inflation expectations.
Third, the Russian invasion of Ukraine is a watershed for Europe. The economic impact of the war is operating through several mechanisms including: the amplification of the energy shock; a new set of bottlenecks; and downward revisions in consumer and business confidence. Moreover, the war constitutes a significant source of uncertainty, which is acting as a further drag on economic activity.[1]
In what follows, I review some of the implications of these three forces for the economic outlook and the inflation outlook. I do not attempt to provide a comprehensive overview: rather, the aim is to highlight some of the factors relevant for understanding the current situation.
Economic developments
High energy costs, pandemic-related restrictions, global bottlenecks and, latterly, the initial impact of the war go some way towards explaining the subdued economic performance of the euro area in the last quarter of 2021 and the first quarter of 2022: the quarter-on-quarter growth rates were just 0.3 per cent and 0.2 per cent respectively.
Although the easing of pandemic-related restrictions in Europe will provide an important source of momentum in the coming months (especially for the services sector), the pandemic is still contributing to global bottlenecks, while the energy shock and the war will continue to exert an adverse impact on domestic activity.
Chart 1 shows different vintages of the IMF’s World Economic Outlook. Compared to the profile of a prolonged multi-year phase of output remaining far below the pre-pandemic level that was embedded in the October 2020 vintage, the development and rollout of vaccines (together with considerable policy support) enabled a much faster recovery, as captured in the October 2021 vintage. However, the impact of new pandemic waves, the energy shock and the war have all contributed to a substantial downward revision in the expected output path, as reflected in the latest April 2022 projections. During 2021, the faster-than-expected global recovery – in combination with the asymmetric and idiosyncratic nature of the impact of the pandemic across industries and regions – helps to explain the emergence of sectoral demand-supply mismatches (bottlenecks) and the jump in energy prices.
Chart 1
Euro area and world GDP
(index 2019=100)
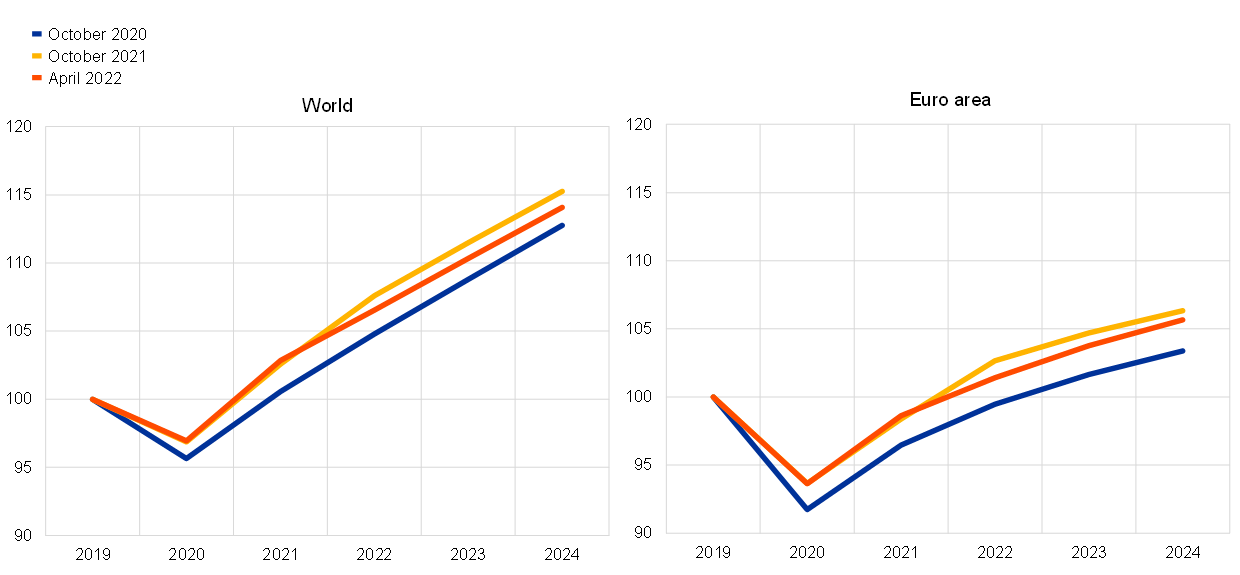
Sources: IMF World Economic Outlook and ECB calculations.
In relation to the composition of domestic demand, Chart 2 shows that consumption and investment remain below pre-pandemic levels, whereas government spending (the sum of public consumption and public investment) has been substantially above the pre-pandemic level since the second half of 2020. The still-subdued level of private expenditure in the euro area stands in contrast to the much stronger recovery in domestic demand in the United States.
Chart 2
Consumption, investment and government spending
(index: Q4 2019 = 100)

Sources: Eurostat, and ECB projections and calculations.
Note: The latest observations are for the first quarter of 2022.
Chart 3 shows a range of Purchasing Managers’ Index (PMI) confidence indicators. The left panel shows the assessment of the current situation in manufacturing and services. The re-opening of the economy is supporting the continuing improvement in the services sector. Although the manufacturing indicator edged down in March, it remained broadly stable in April, so that the overall profile has so far been resilient to the outbreak of the war. However, in the middle panel, we see that this resilience did not hold for export orders, which have declined more than total orders, since the war and the Covid wave in China are already affecting the external sector. The right panel shows the expectations component, which fell abruptly for manufacturing in particular but has remained in expansionary territory. This can be interpreted as an expectation of a slowdown in growth but not a recession.
Chart 3
PMI confidence indicators
(diffusion index: 50 = no change)
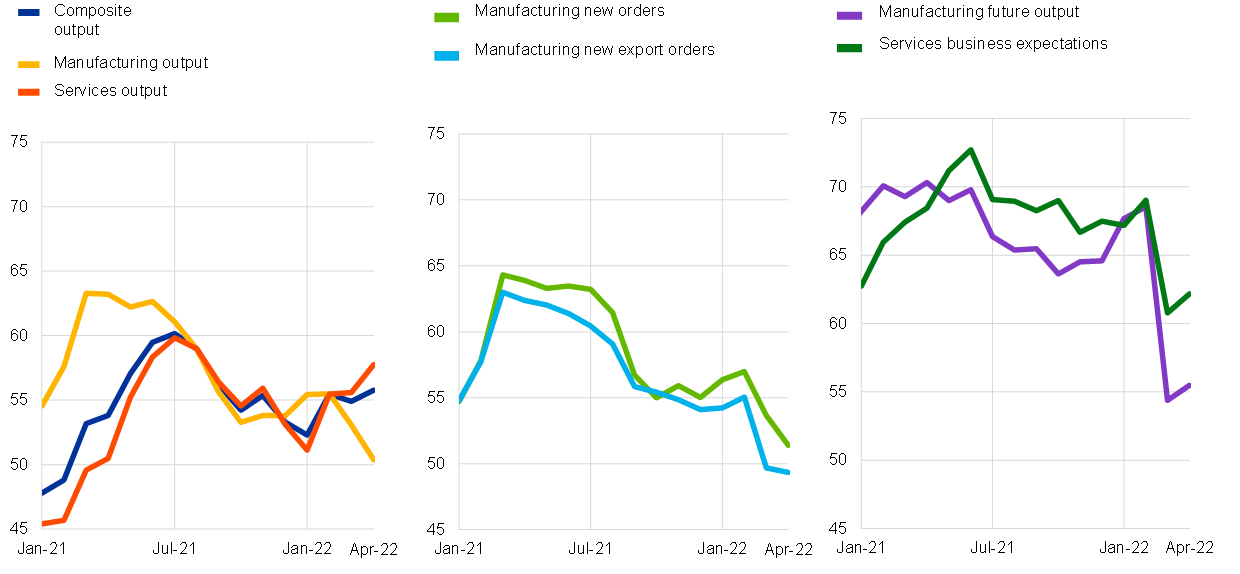
Source: Markit.
Note: The latest observations are for April 2022.
Turning to the labour market, Chart 4 reinforces the message of Chart 2: the recovery in the labour market has been asymmetric, with public sector employment above the pre-pandemic level, employment in industry and construction only now reaching the pre-pandemic level and employment in services still below the pre-pandemic level. As indicated in the right panel of Chart 4, the distance to the pre-pandemic level is larger for the intensive margin (hours worked per employee) than for the extensive margin (numbers employed). At an aggregate level, the ongoing reduction in the unemployment rate and the recovery in the labour force participation rate underline the overall improvement in the labour market.
Chart 4
Labour market: employment and hours worked by sector
(index: Q4 2019 = 100; left panel: persons employed; right panel: total hours worked)
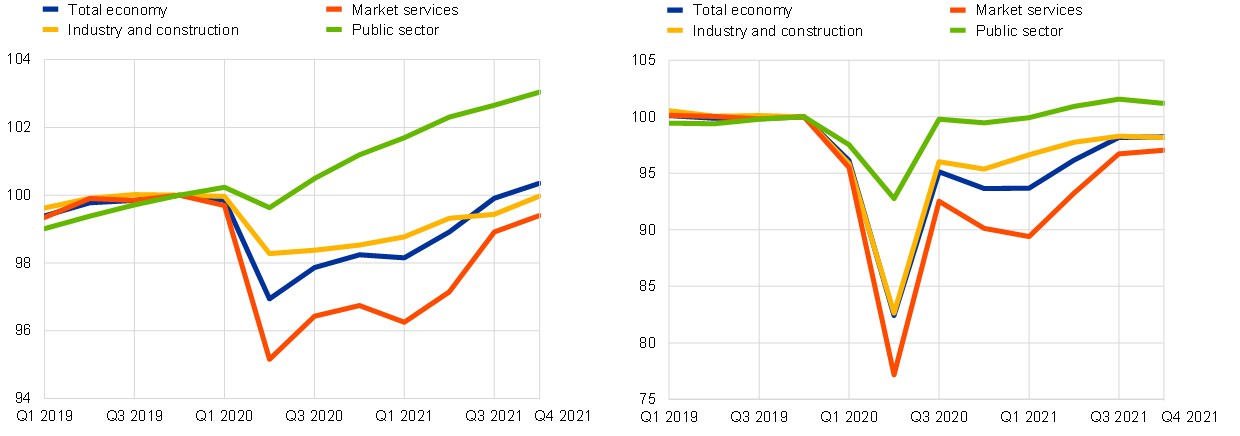
Source: Eurostat.
Note: The latest observations are for the fourth quarter of 2021.
At the same time, the downward revision in the expected output path as a result of the war and high energy prices will have implications for the future evolution of the labour market. In terms of the impact of the war on the labour market, Adrjan and Lydon (2022) highlight a striking pattern in online job postings: since late February, the growth rate of job postings — in the twenty-one European countries with an Indeed job site — has on average fallen eight percentage points relative to their immediate pre-war trend. Of course, this aggregate shift should be interpreted in the context of the significant positive trend in recent months and take into account the different dynamics across countries.[2]
Inflation
Chart 5 shows the change in the price level over the year from April 2021 to April 2022. Energy prices have increased by about 40 per cent. This increase in the relative price of energy is far higher than the individual spikes experienced in the 1970s. It is also four times larger than the energy price spikes previously observed over the last two decades since the creation of the euro (Chart 6). Chart 5 shows as well that the other main categories also have seen above-target inflation rates over the last year, especially the food category.
Chart 5
Energy, food, goods and services inflation
(annual percentage changes)

Sources: Eurostat and ECB calculations.
Note: The HICP – food series shown is HICP food including alcohol and tobacco. The latest observations are for April 2022 (flash).
Chart 6
Difference between HICP – energy and HICP excluding energy from 1991 to present
(percentage points)
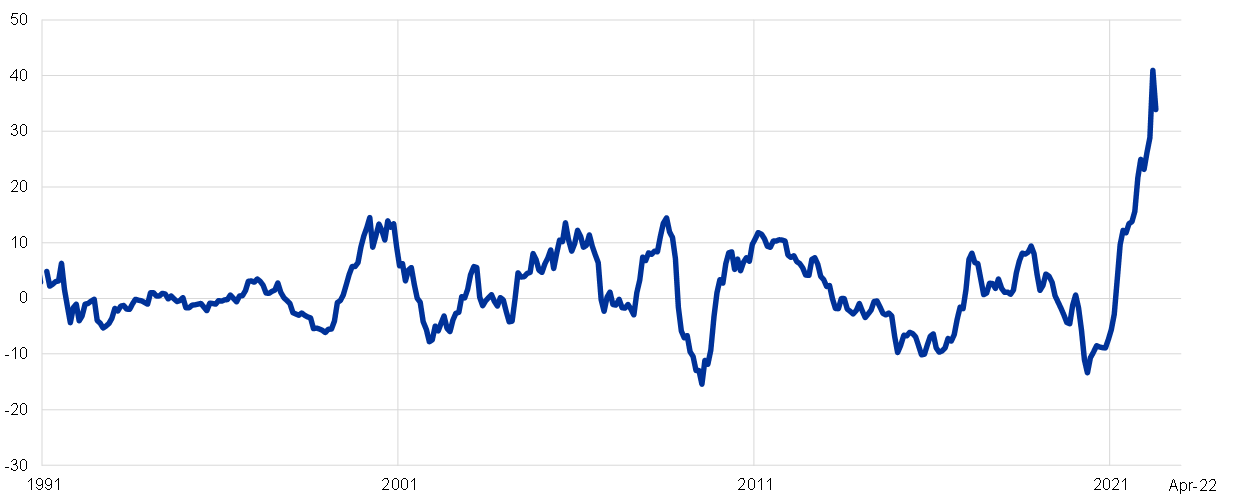
Sources: Eurostat and ECB calculations.
Note: The latest observations are for April 2022 (flash).
In understanding the factors driving price increases across sectors, it is important to bear in mind that the rise in energy prices puts upward pressure on costs across all sectors, given the importance of energy as a production input in the food, manufacturing, construction and services sectors.[3] Bottlenecks are also generating temporary upward pressure on costs, even if the eventual resolution of these bottlenecks should reverse these cost pressures in the future. In addition, the lifting of pandemic restrictions can be expected to generate temporary price pressures in re-opening sectors, in view of the recovery in demand for newly-unrestricted services and initial supply and labour market constraints in these sectors.
These themes are illustrated in Chart 7. The left panel suggests that about one percentage point in the current inflation rate for non-energy industrial goods can be attributed to the indirect impact of elevated energy costs and the contribution of bottlenecks. To the extent that the increase in energy costs is ultimately a level effect and bottlenecks eventually are resolved, this suggests that there is a temporary component in the current rate of goods inflation. The right panel shows that services inflation is currently most intense in the contact-intensive sectors that are currently re-opening, which also suggests that the completion of the re-opening process can alleviate services inflation.
Chart 7
Decomposition of inflation in non-energy industrial goods and services inflation
(annual percentage changes; percentage point contributions)

Sources: Eurostat, Narrow Inflation Projections Exercise and ECB calculations.
Notes: HICP non-energy industrial goods inflation is de-meaned by the model mean over the sample from July 2009 to February 2022. Services inflation is decomposed with non-constant weights. The latest observations are for April 2022 (flash).
Still, these adjustment processes (the absorption of higher energy costs across all sectors of the economy, the impact of bottlenecks and the post-pandemic re-establishment of those sectors most affected by the pandemic) may still have some distance to run, as is also suggested by indicators of rising costs in the earlier stages of production before goods and services reach consumers.
In addition, the process of adjustment in nominal wages adds a further dimension to near-inflation dynamics, both due to the overall recovery in the labour market and the adverse impact of unexpected inflation over recent months on real wages. Furthermore, even after the adjustment to these shocks has been completed, it is important to assess whether this phase of high inflation might permanently re-set inflation expectations and thereby also affect longer-term inflation dynamics.
Chart 8 shows developments in nominal wages, including the information embedded in an experimental forward-looking wage tracker developed by ECB staff. This forward-looking tracker is based on the information for wage trends in 2022 and 2023 embedded in already-finalised wage settlements. The overall tracker indicates only sideways movement in aggregate wage growth at around an annual two percent rate.[4] However, if we focus just on the wage agreements that have been concluded since the start of 2022, these indicate higher wage growth at around 3 per cent in 2022 and 2.5 per cent in 2023. The front-loaded nature of recent wage settlements (with 2022 increases larger than 2023 increases) suggests that wage-setters understand that there is a temporary component to the currently high inflation rate. In assessing wage developments, it is also relevant that, under typical conditions and allowing for labour productivity growth at about one per cent, nominal wage growth at three per cent is consistent with the two per cent inflation target. Although so far only a relatively small number of wage contracts have been renegotiated since inflation started to increase strongly in the second half of 2021, the outcomes from the latest wage settlements might provide a helpful guide to the likely outcomes of upcoming negotiations and contribute to a more accurate assessment of realised progress in underlying inflation.[5],[6],[7]
Chart 8
Forward looking euro area wage tracker
(annual percentage changes; percentage share)
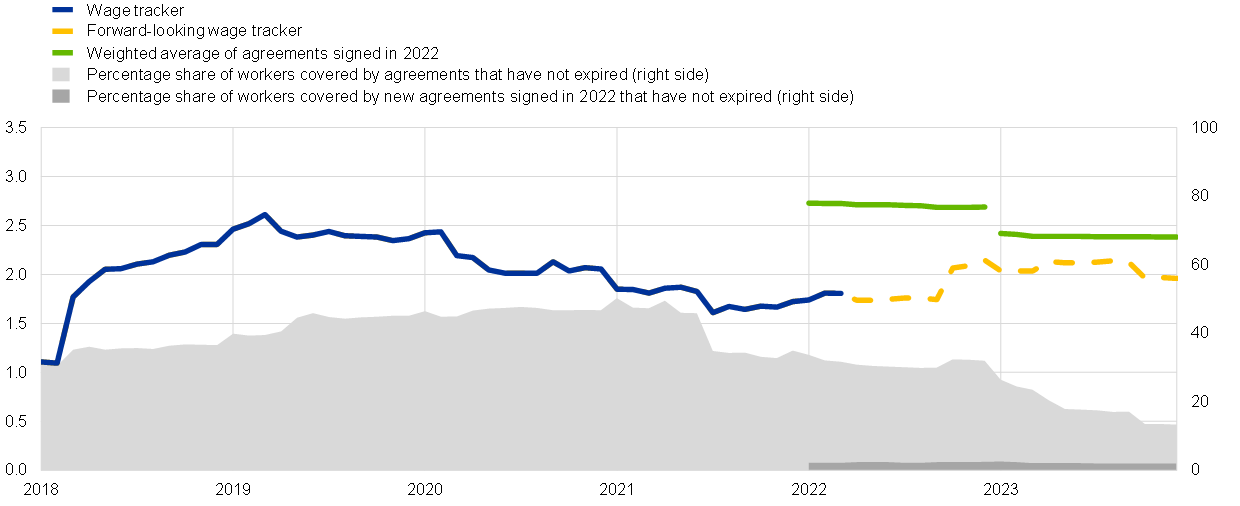
Sources: Calculated based on microdata on wage agreements in Germany, Italy, Spain and the Netherlands. Data fort the Netherlands is based on the database maintained by the Dutch employer association AWVN. For Italy the data comes from Istat (contratti collettivi e retribuzioni contrattuali), for Spain from the Ministerio de Trabajo y Economía Social and for Germany from Bundesbank.
Notes: Experimental euro area wage tracker includes weighted average of Germany, Italy (data from July 2021 to September 2022) Spain and the Netherlands. The orange line shows the weighted average of wage increases in agreements that have not yet expired, weighted by the number of workers covered by these agreements. The green lines show weighted averages of wage increases in agreements that were concluded in 2022, weighted by the number of workers covered by these agreements. Latest observations: Last agreements signed in NL ES, IT and DE in March 2022
Chart 9 shows the expected momentum in inflation dynamics, as captured by the April 2022 median results from the Survey of Monetary Analysts.[8] The left panel shows the headline HICP, while the right panel shows the core HICPX indicator. Compared to the 6 per cent inflation realised over Q2 2021 to Q1 2022, the coming twelve months (Q2 2022 to Q1 2023) are projected to see cumulative headline inflation at 3.7 percent. In the subsequent two years (Q2 2023 to Q1 2025), inflation per year is projected to be slightly below 2 per cent. In essence, Chart 9 indicates that one more year of inflation momentum above target is expected by market analysts before returning to the target level. In relation to HICPX, the next twelve months are projected to see cumulative core inflation at 2.3 per cent, while core inflation over Q2 2023 to Q1 2025 is expected to average 1.9 per cent per year.
Chart 9
Realised and expected level of HICP and HICP excluding energy and food
(percentages)
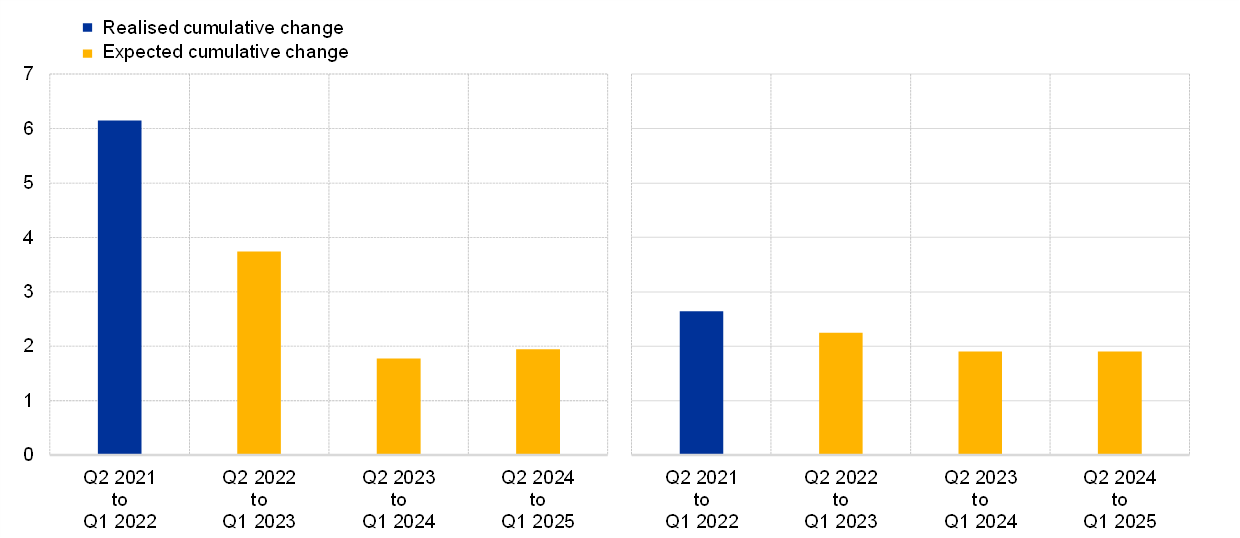
Source: Survey of Monetary Analysts.
Note: Expectation is based on the median from the April 2022 Survey of Monetary Analysts.
In terms of the evolution of longer-term inflation expectations, Charts 10-12 present a range of indicators. In relation to the Survey of Professional Forecasters, Chart 10 conveys two messages. First, over the course of 2021, there was a significant re-anchoring of longer-term inflation expectations at our two per cent target: the distribution in the Q1 2021 survey was similar to the prevailing pattern for an extended period before the pandemic with the modal expectation at around 1.6 per cent, whereas the distributions in the Q1 2022 and Q2 2022 surveys show the modal expectation at 2.0 per cent and a significant rightward shift in the mass of the distribution. Second, there is also a visible difference between the Q1 2022 and Q2 2022 survey: the right tail of the distribution has expanded, with more forecasters expecting long-term inflation above 2.5 per cent, significantly higher than the target level.
Chart 10
Long-term inflation expectations
(annual percentage changes; percentages of respondents)
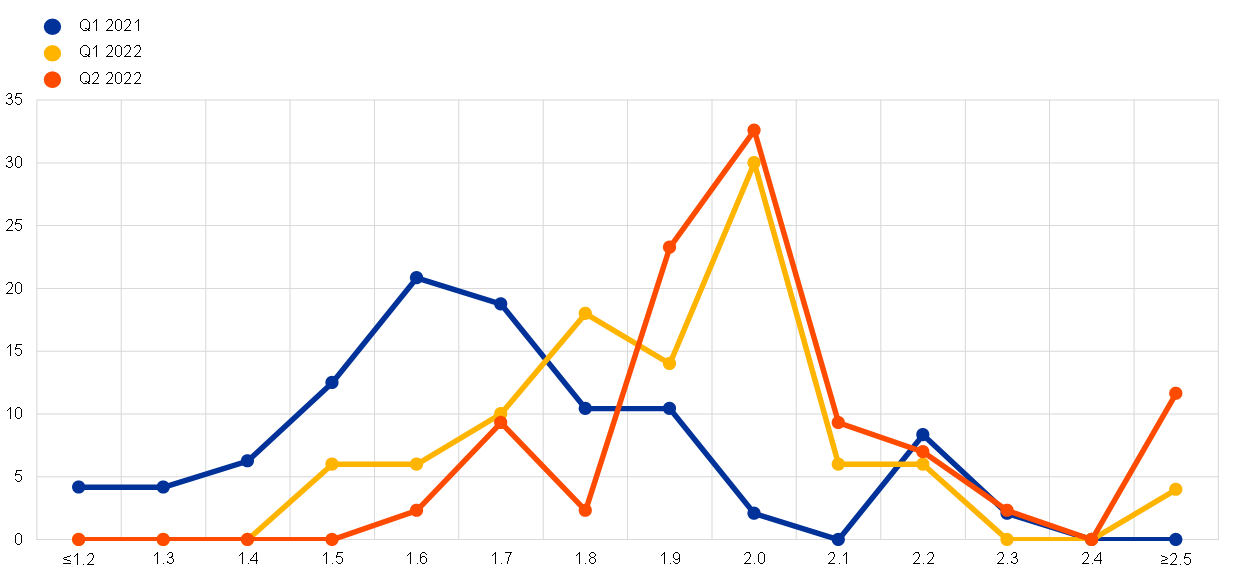
Source: ECB Survey of Professional Forecasters.
Notes: Respondents are asked to report their point forecasts and to separately assign probabilities to different ranges of outcomes. This chart shows the distribution of point forecast responses.
A similar message is conveyed by market measures of inflation compensation, as shown in Chart 11. The left panel of Chart 11 shows that the estimated “true” (that is, corrected for risk premia) longer-term inflation expectations of market participations re-anchored over the course of 2021 at around 2 per cent, after an extended period substantially below the target. In terms of inflation risk, there has been a significant shift from an inflation risk discount until mid-2021 to an increasing inflation risk premium in recent months.
Chart 11
Inflation-linked swap rate
(percentages per annum)
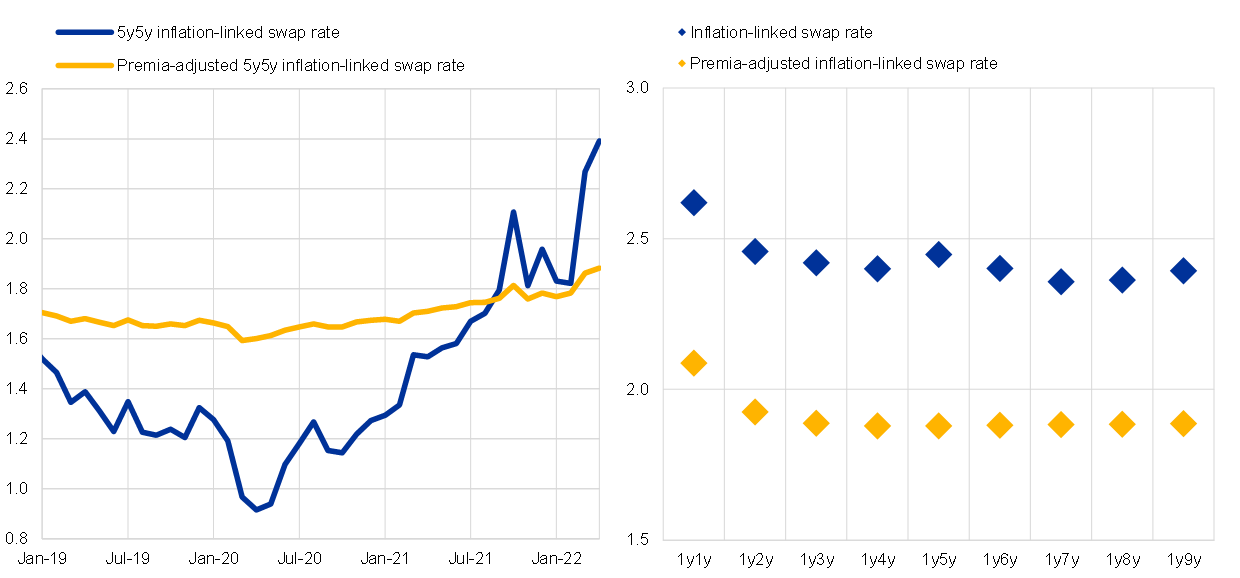
Sources: Refinitiv and ECB calculations.
Notes: Premia-adjusted average estimates based on two affine term structure models following Joslin, Singleton and Zhu (2011) applied to ILS rates adjusted for the indexation lag (monthly data), as in Camba-Mendez and Werner (2017); see Burban, V. et al. (2021), “Decomposing market-based measures of inflation compensation into inflation expectations and risk premia”, Economic Bulletin, Issue 8, ECB. The latest observations are for the end of April 2022 (monthly models).
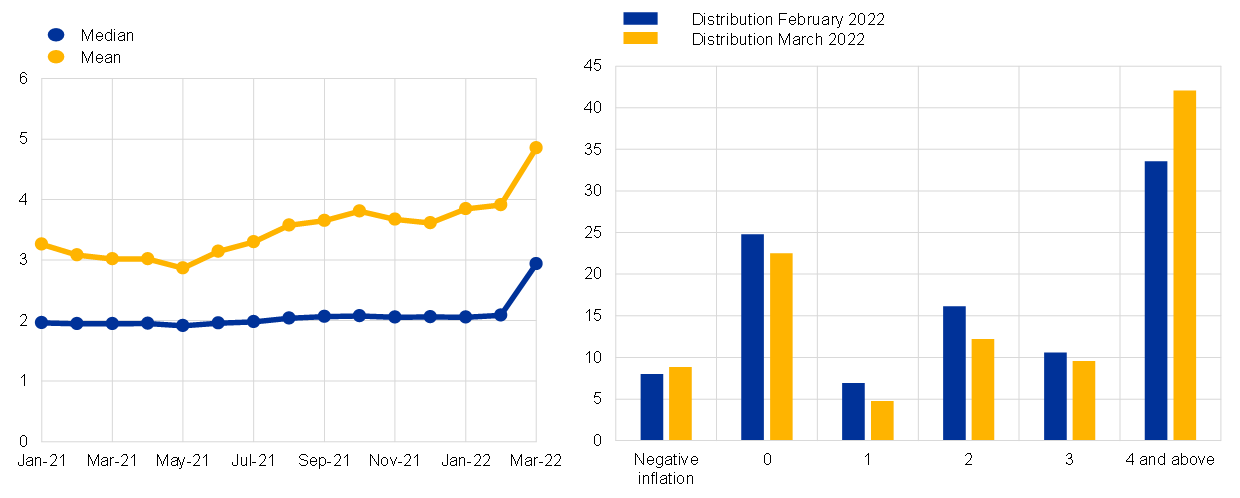
Chart 12 shows the three-year-ahead inflation expectations from the Consumer Expectations Survey. The left panel shows that there has been a marked shift in the March results – having been quite stable at around 2 per cent, the median expectation moved up to 2.9 per cent. In particular, there was a shift in the proportion of participants reporting expected inflation rates above 4 per cent. In line with the literature on household inflation expectations, the most important signal is conveyed by the shift in the distribution of beliefs about future inflation more than the precise level of expected inflation.
Chart 12
Inflation expectations in the ECB Consumer Expectations Survey
(left panel: annual percentage changes; right panel: annual percentage changes; percentages of respondents)
Sources: ECB Consumer Expectations Survey and ECB staff calculations.
Notes: “Median” refers to the median across individual respondents. Data is winsorised at the 2nd and 98th percentile. The latest observations are for March 2022.
Taken together, Charts 10-12 indicate that there has been a substantial and widespread shift in longer-term inflation expectations since early 2021, largely in the direction of re-anchoring expected inflation at the two percent target. This suggests that the euro area is unlikely to revert to the persistent below-target inflation trend that was so entrenched before the pandemic. At the same time, the most recent signals from surveys and market-based measures also suggest that the right tail of the distribution is expanding, which warrants close monitoring.
Monetary policy
In recent years, the monetary stance of the ECB has been determined by a combination of policy measures: the low level of the key policy rates, rate forward guidance, asset purchases and targeted lending operations. The period of very low interest rates for banks in the targeted lending programme (TLTRO III) is scheduled to end next month. Moreover, as shown in Chart 13, there has been a very substantial decline in the rate of asset purchases in recent months and the Governing Council expects to end net purchases under the asset purchase programme (APP) in the third quarter.
Chart 13
Monthly flow of net purchases under APP and PEPP
(EUR billions)

Source: ECB.
Notes: The chart shows aggregated net purchases for all public and private APP and PEPP programmes at month-end. The latest observation is for 30 April 2022. The values for May and June 2022 were inferred from the ECB’s most recent monetary policy announcement (14 April 2022).
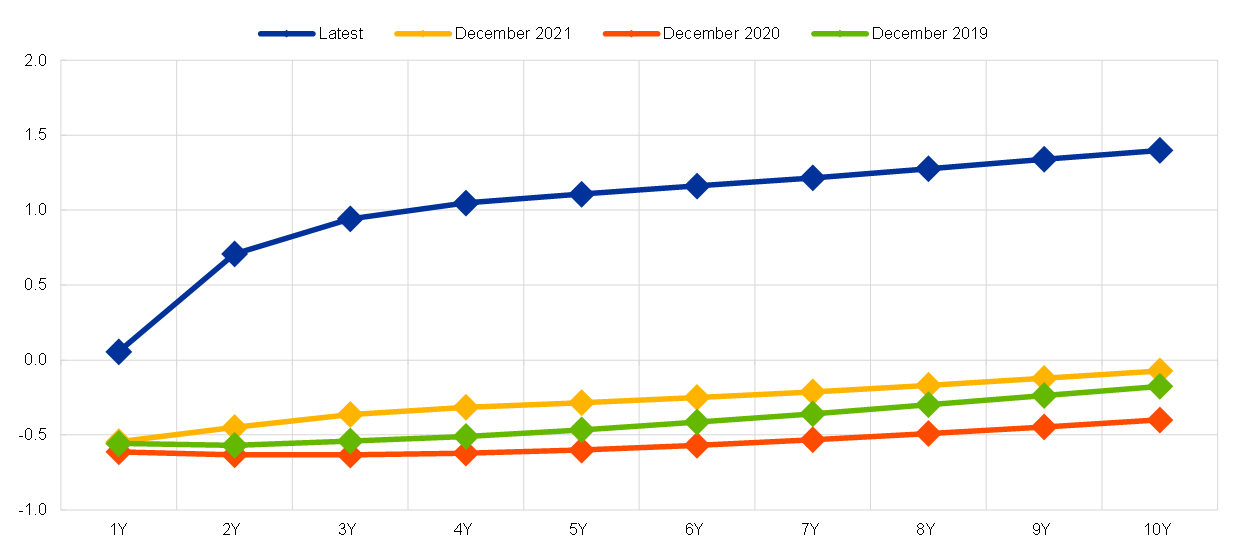
Furthermore, as shown in Chart 14, there has been a remarkable shift in the yield curve during the initial months of 2022. In part, this reflects the re-pricing of risk premia in the current highly-uncertain environment. In part, it reflects the anticipation of market participants that the rate forward guidance criteria of the ECB are closer to being fulfilled and that the medium-term inflation outlook will call for a normalisation of policy rates over time.
Chart 14
Overnight interest rate swap yield curve
(percentages per annum)
Sources: Bloomberg, Refinitiv and ECB calculations.
Note: The curves refer to the day before the respective Governing Council meetings (15 December 2021, 9 December 2020 and 11 December 2019). The latest observations are for 29 April 2022.
In thinking about the normalisation process, gradualism is an important consideration. In particular, while the normalisation process should ultimately result in policy rates reaching the level that maintains inflation at two percent on a durable basis, the timeline to complete this normalisation process is intrinsically uncertain for two basic reasons.
First, it is important to take the time to observe the impact of shifts in financing conditions on inflation dynamics. There is a wide range of estimates of the impact of higher interest rates on activity levels and inflation pressures. In particular, it is likely that there are significant interaction effects between shifts in financing conditions and other macroeconomic forces. Accordingly, the feedback loop between various steps in the policy normalisation process and inflation dynamics needs to be incorporated into the monetary policy decision process. In particular, moving along the normalisation path, both the benchmark market interest rates and the lending margins will adjust. Whereas the elasticity of benchmark rates to the gradual reduction and eventual termination of net purchases can be estimated reasonably precisely building on past experience, the reaction of the loan pricing policies of banks (and the re-setting of the terms and conditions of lending agreements) to the policy normalisation is not very well forecastable and depends on a number of factors. In turn, the impact of higher interest rates and a tightening of credit conditions on economic activity and on the formation of inflation expectations are also subject to considerable uncertainty.
Second, high uncertainty about the economic impact of the war in Ukraine, the energy shock and the post-pandemic recovery suggests that it is unlikely that the economy will quickly settle into a new steady-state equilibrium. It follows that cyclical factors are likely to be important for the course of monetary policy, in addition to the underlying normalisation process.
For these reasons, the calibration of our policies will remain data-dependent and reflect our evolving assessment of the outlook. Our over-riding commitment is that the Governing Council will take whatever action is needed to fulfil the ECB’s mandate to pursue price stability and to contribute to safeguarding financial stability. We stand ready to adjust all of our instruments within our mandate, incorporating flexibility if warranted, to ensure that inflation stabilises at our two per cent target over the medium term.
The March 2022 ECB staff macroeconomic projections included adverse and severe scenarios in addition to the baseline projections in recognition of the highly-uncertain impact of the war on the euro area economy and the inflation outlook.
Adrjan, P.l and Lydon, R. (2022), “Job Posting Growth Stalls in Europe” Indeed Hiring Lab Blog, 4 May.
See also Lane, P.R. (2022), “Monetary policy during the pandemic: the role of the PEPP”, Speech at the Paris School of Economics, 31 March, Lane, P. R. (2022), “Inflation in the near-term and in the medium-term”, Opening remarks at MNI Webcast, 17 February and Lane, P.R. (2022), “Bottlenecks and monetary policy”, The ECB Blog, 10 February.
Wage agreements specify both current and future wage increases and frequently cover 1-2 years. The wage trackers reflect the average wage growth among those workers for whom agreements are already in place – the so-called coverage. This coverage is decreasing with the length of the time horizon – as the longer one looks into the future the more agreements will have run out. The experimental wage tracker for the euro area reflects a weighted average of wage increases based on micro data on wage agreements in Germany, Italy, Spain and the Netherlands.
For more than half of the private sector employees in the euro area, inflation does not play a formal role in wage setting, but can be an important factor in wage negotiations and in some countries there is renewed pressure to introduce or increase the prevalence of indexation clauses. See, for example, ECB (2022) “An initial analysis of the impact of inflation on collective bargaining in 2022”, Bank of Spain Economic Bulletin, Issue 1See also ECB (2021) “The prevalence of private sector wage indexation in the euro area and its potential role for the impact of inflation on wages” Economic Bulletin, Issue 7.
Also substantial increases in minimum wage increases, which are in some countries linked to inflation, can be expected to contribute more strongly than usual to euro area wage growth in 2022 and 2023. See ECB (2022), ”Minimum wages and their role for euro area wage growth”, Economic Bulletin, Issue 3.
A pickup in nominal wages later this year is also in line with the results in the March 2022 Corporate Telephone Survey.See ECB (2022), “Main findings from the ECB’s recent contacts with non-financial companies”, Economic Bulletin, Issue 3.
To capture momentum in inflation dynamics, I focus on the cumulative change in the price level over a twelve month period.
Evropská centrální banka
Generální ředitelství pro komunikaci
- Sonnemannstrasse 20
- 60314 Frankfurt am Main, Německo
- +49 69 1344 7455
- media@ecb.europa.eu
Reprodukce je povolena pouze s uvedením zdroje.
Kontakty pro média