





Financial stability implications of geopolitical and geoeconomic risks
Published as part of the Financial Stability Review, May 2026.
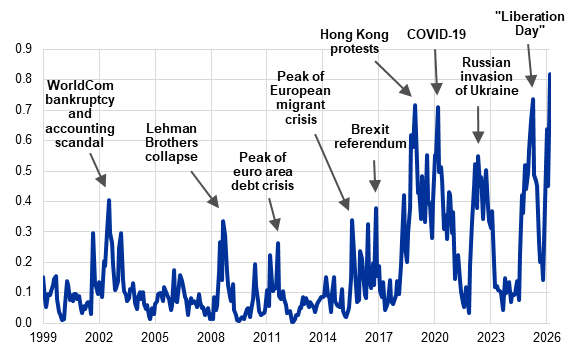
The outlook for global growth, inflation and financial stability has been adversely affected recently by unexpected geopolitical and geoeconomic events. Notably, the war in the Middle East has led to high levels of uncertainty and disruptions to the supply of oil and other energy commodities. This box evaluates recent developments in geopolitical and geoeconomic risks and assesses their impact on euro area financial stability.[1] To take into account the fact that these risks have multiple dimensions, the analysis reviews a wide range of up-to-date indicators relating to defence, trade and economic policy uncertainty, market volatility and migration (Chart A, panel a).[2] As a second step, it develops a new composite indicator of geoeconomic risk, integrating geopolitical, trade and financial market dimensions in a single metric, which can be used to analyse transmission to macro-financial risks (Chart A, panel b).[3]
Geoeconomic risks are currently heightened across several dimensions, in particular geopolitical risk, global supply chain pressure and trade policy. In the first quarter of 2026, renewed geoeconomic stress linked to tariff uncertainty and geopolitical events, including the war in the Middle East, led to a new spike in risk indicators. Some of these indicators exceeded the levels seen after the US tariff announcement in the second quarter of 2025 (Chart A, panel a). Comparing individual indicators with their historical distribution reveals that although the current shock has persisted at an elevated level since the second quarter of 2025, it differs markedly from the pandemic shock. While geopolitical and trade-related indicators were higher in the first quarter of 2026, the pandemic shock saw stronger pressures on global supply chains and higher financial market volatility.
The composite indicator for geoeconomic risks reached an all-time high in March 2026, suggesting adverse implications for macro-financial stability in the euro area. The main drivers of geoeconomic risk in April 2025 and early 2026 were associated with trade and defence risks. If sustained over a long period of time, the recent increase could have adverse effects on financial stability in the euro area. To gauge the impact on macro-financial stability, an econometric quantile vector autoregression was estimated to assess the responses of real GDP, the financial cycle and financial stress to a shock to the geoeconomic composite indicator.[4]
Chart A
Following the spike of individual indicators in Q2 2025, the composite geoeconomic risk reached new highs in Q1 2026
a) Geoeconomic risk indicators over time | b) The geoeconomic composite indicator since 1999 |
|---|---|
(percentiles) | (Q1 1999-Q1 2026, index points) |
 |  |
Sources: ECB calculations.
Notes: Panel a: the percentile representation transforms the original indicators into their percentiles using the historical distribution. Panel b: the geoeconomic composite indicator is a monthly indicator based on 12 individual indicators, categorised as defence, trade or capital/finance. In addition to the dynamics of the individual indicators, the composite accounts for time-varying correlations to emphasise episodes of a systemic nature.
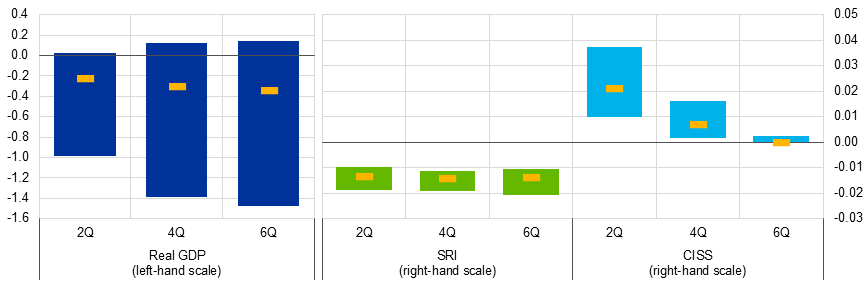
Spikes in geoeconomic risk pose significant downward risks to economic activity and raise the risk of financial stress. An increase in the geoeconomic composite indicator of 1 standard deviation induces a sharp decline in economic activity with marked asymmetry: downside risks for real GDP growth over the first six quarters ahead, represented by the 10th percentile of the GDP outlook distribution, rise significantly more than upside risks (Chart B). This asymmetry is accompanied by increased financial stress, as measured by the CISS, which increases for all categories of the composite indicator – defence, trade and capital/finance. Furthermore, all categories dampen the financial cycle, thereby weakening financial conditions and stability. Overall, the persistent and evolving nature of geoeconomic risks continues to pose challenges to financial markets and economic stability in the euro area.
Chart B
Geoeconomic risk shocks pose significant downside risks to real GDP growth and increase financial stress
Impact of shocks to the geoeconomic composite indicator on the distributions of macro-financial variables
(percentages, index points)
Sources: Eurostat, ECB and ECB calculations.
Notes: The results are based on a quantile vector autoregression and depict the impacts two, four and six quarters ahead. The bars represent the range of 10th to 90th percentile, whereas the yellow markers denote the medians of impulse responses to a 1-standard deviation shock to the geoeconomic composite indicator on GDP, the Systemic Risk Indicator (SRI) and the Composite Indicator of System Stress (CISS), in levels based on a quantile vector autoregression by Bochmann et al.* The shock is identified through a Cholesky decomposition in which the composite indicator is ordered first.
*) Bochmann, P., Dieckelmann, D., Fahr, S. and Ruzicka, J., “Financial stability considerations in the conduct of monetary policy”, Working Paper Series, No 2870, ECB, 2023.
The box builds on Avril, P., Bochmann, P., Fahr, S., Horan, A., Pancaro, C. and Pizzeghello, R., “Risks to euro area financial stability from trade tensions”, Financial Stability Review, ECB, May 2025, and Dieckelmann, D., Kaufmann, C., Larkou, C., McQuade, P., Negri, C., Pancaro, C. and Rößler, D., “Turbulent times: geopolitical risk and its impact on euro area financial stability”, Financial Stability Review, ECB, May 2024. The indicators are described in detail in the ECB/ESRB report “Financial stability risks from global fragmentation”, European Systemic Risk Board, January 2026 and the associated technical annex.
The indicators selected are as follows:
“economic policy uncertainty”, taken from Baker, S.R., Bloom, N., Davis, S.J. and Kost, K.J., “Policy News and Stock Market Volatility”, NBER Working Paper Series, No 25720, 2019; “geopolitical risk”, taken from Caldara, D. and Iacoviello, M., “Measuring Geopolitical Risk”, American Economic Review, Vol. 112, No 4, 2022, pp. 1194-1225; “EMV national security policy and EMV trade policy tracker”, taken from Baker, S.R., Bloom, N., Davis, S.J. and Kost, K.J., “Policy News and Stock Market Volatility”, NBER Working Paper Series, No 25720, 2019; “global supply chain pressure”, taken from Federal Reserve Bank of New York, Global Supply Chain Pressure Index, 2025; “trade policy uncertainty”, taken from Caldara, D., Iacoviello, M., Molligo, P., Prestipino, A. and Raffo, A., “Does Trade Policy Uncertainty Affect Global Economic Activity?”, FEDS Notes, Board of Governors of the Federal Reserve System, 4 September 2019; “common volatility”, taken from Engle, R.F. and Campos-Martins, S., “What are the events that shake our world? Measuring and hedging global COVOL”, Journal of Financial Economics, Vol. 147, Issue 1, pp. 221-242, January 2023; “migration fear”, taken from Bloom, N., Davis, S. and Baker, S., “Immigration fears and policy uncertainty”, VoxEU, Centre for Economic Policy Research, 15 December 2015.The composite indicator builds on a broad set of 12 individual indicators, beyond those represented in Chart A, panel a, and aggregated following the methodology by Holló, D., Kremer, M. and Lo Duca, M., “CISS – A composite indicator of systemic stress in the financial system”, Working Paper Series, No 1426, ECB, March 2012. The indicator also quantifies contributions from the co-movement of individual metrics, representing episodes of a more systemic nature.
The econometric model includes the composite indicator, real GDP growth, HICP inflation, the ECB’s Systemic Risk Indicator (SRI) and the ECB’s Composite Indicator of Systemic Stress (CISS). For details on the SRI, see Lang, J.H., Izzo, C., Fahr, S. and Ruzicka, J., “Anticipating the bust: a new cyclical systemic risk indicator to assess the likelihood and severity of financial crises”, Occasional Paper Series, No 219, ECB, February 2019; for details on the CISS, see Holló, D., Kremer, M. and Lo Duca, M., “CISS – A composite indicator of systemic stress in the financial system”, Working Paper Series, No 1426, ECB, March 2012. See also the econometric model described in Bochmann, P., Dieckelmann, D., Fahr, S. and Ruzicka, J., “Financial stability considerations in the conduct of monetary policy”, Working Paper Series, No 2870, ECB, November 2023.