
€STR Annual Methodology Review
1 Introduction
The euro short-term rate (€STR) was launched by the European Central Bank (ECB) on 2 October 2019. It reflects the wholesale euro unsecured overnight borrowing costs of banks located in the euro area. The €STR is based entirely on daily confidential statistical information relating to money market transactions collected in compliance with the Money Market Statistical Reporting (MMSR) Regulation[1].
Markets have made increased use of the €STR in the past year, especially since the successful transition of the overnight index swap (OIS) market to the €STR in October 2021. The European Commission designated the €STR as the statutory replacement rate for the euro overnight index average (EONIA) on 21 October 2021[2], and EONIA was discontinued on 3 January 2022 in line with the recommendation of the private sector-led working group on euro risk-free rates.
In its third year since launch, €STR has proved its robustness and accuracy. It has done so in a rapidly changing environment marked by the war in Ukraine together with the policy rate hikes carried out by the ECB in pursuit of its price stability mandate and in the face of an elevated outlook for inflation.
Production of the €STR is regulated by the €STR Guideline[3], which establishes the ECB’s responsibility as rate administrator. Under Article 15 of the Guideline, the administrator is required to review at least annually whether changes in the underlying market for the €STR require changes to the €STR methodology. This report therefore (i) reviews the performance of the rate and developments in the underlying markets, and (ii) assesses whether any changes in the methodology are required so the rate better captures the underlying economic reality, namely the overnight wholesale unsecured borrowing costs of euro area banks. The assessment is an important check on the robustness of methodological choices made in 2018, when market conditions were different.
The ability of the €STR methodology to correctly measure the defined underlying economic reality is first assessed against the following three main criteria.
- Rate accuracy: does the rate correctly reflect the underlying market dynamics?
- Data sufficiency: is the rate built on a sufficient volume of data?
- Rate representativeness: is the rate unbiased?
This initial assessment of the methodology is then complemented by a gap analysis using MMSR data. This is to ensure that the defined scope is still adequate for measuring the underlying interest rate.
Finally, the calibration of key parameters in the methodology is reviewed, specifically the 25% trimming level and the data sufficiency thresholds.
The report covers the period from the start of October 2021 to the end of September 2022.
The report is structured as follows: Section 2 reviews how the methodology performed in the reference period, analysing €STR volatility and trends in the underlying volume of transactions; Section 3 reviews the adequacy of the scope of the €STR and looks into market developments in sectors and maturities outside the current scope; Section 4 reviews the core parameters of the methodology; Section 5 concludes with a final assessment.
2 Methodology
This section looks at how the €STR’s main metrics behaved to assess whether the methodology proved able to deliver an adequate measure of the underlying economic reality.
2.1 Assessment of rate accuracy
During the period under review (from October 2021 to the end of September 2022), the €STR reflected the respective market dynamics well. The rate remained resilient in the months of heightened market volatility in the aftermath of the Russian invasion of Ukraine and continued to provide a good reflection of market activity on specific calendar days, for instance quarter-ends. In terms of responsiveness to market developments, the €STR showed a full and immediate pass-through of the ECB policy rate changes. During the period under review, the ECB raised its three key interest rates at two consecutive policy meetings: by 50 basis points on 21 July and by 75 basis points on 8 September. Accordingly, the €STR increased by 49.6 basis points on 27 July and 74.5 basis points on 14 September. These were the first days of the respective reserve maintenance periods and therefore the dates as of which the new interest rates would apply. As a result, the €STR moved within a relatively wide range between -59.3 basis points before the start of the rate hike cycle and 66.3 basis points following the second rate hike (Chart 1). Given the high level of excess liquidity in the banking system, the €STR maintained a stable negative spread overall against the ECB’s deposit facility rate (DFR). The high level of excess liquidity created an opportunity for reporting banks to apply rates below the DFR to overnight deposits from other financial institutions, especially those that do not have access to the deposit facility provided by the Eurosystem. As outlined in the two public consultations that supported the development of the €STR methodology,[4] unsecured money market activity has shifted away from the interbank market to a large extent and now encompasses transactions with a large array of other financial institutions, including money market funds, pension funds and insurance companies. These firms do not have access to the Eurosystem deposit facility, and commercial banks therefore routinely offer them rates below the deposit facility rate to cover transaction and regulatory costs.
Chart 1
The €STR and the policy environment since 1 October 2021
(left-hand scale: percentage points; right-hand scale: EUR billions)

Source: ECB calculations.
Rate dispersion, measured as the difference between the rates at the 25th and 75th percentiles (i.e. the interquartile range), was around 4 basis points for most of the year, unchanged from the second year of the €STR. The overall stability of dispersion was attributable to the stable pricing behaviour of the majority of reporting agents (Chart 2).
Chart 2
€STR and rates at the 25th and 75th percentiles
(percentage points)
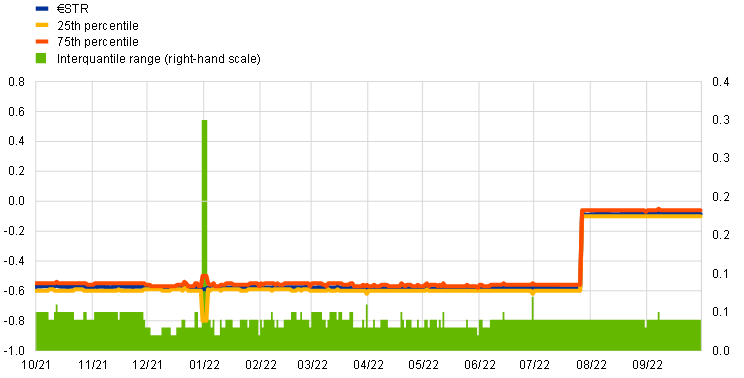
Source: ECB calculations.
However, there were a few days on which dispersion between the rates at the 25th and 75th percentiles was higher. This was particularly the case on all regulatory reporting dates, with dispersion peaking at 30 basis points at the 2021 year-end compared with 11 basis points at end-2020 and 7 basis points at year-end 2019. On such days, banks tend to adjust their offered rates significantly downwards in order to fend off the inflow of liquidity and a corresponding expansion of their balance sheet.
The distribution of the rate on eligible transactions changed shape in 2022, as the cluster of liquidity consisting of lower-priced transactions, particularly those priced at a negative spread of more than 10 basis points against the DFR, increased in weight (see Chart 3). Given the significant amount of excess liquidity, banks were able to charge lower rates to depositors more frequently than in the previous year.
Chart 3
Volume share and price distribution in 2021-22
(percentage of total volume)

Source: ECB calculations.
The significant liquidity pool at rates well below the DFR on dates other than reporting dates (i.e. month-end and quarter-end) is another indicator that the persistence of high excess liquidity is having an enduring impact on pricing behaviour, as a larger fraction of reporting agents accept deposits at rates that are routinely 10 basis points or more below the DFR. This is also relevant for the assessment of the trimming applied, which is reviewed in Section 4.1.
In terms of day-to-day volatility, the €STR average absolute daily fluctuation hovered around the 0.2 basis point mark, similarly to the first two years of the €STR (the two days on which the new ECB policy rates took effect for the first time were excluded). On average, volatility at quarter-ends was also stable at around 1.2 basis points during the period under review, compared with 1.3 basis points in the second year of the benchmark rate and 0.9 basis points in the first year. Compared with secured euro one-day money market rates, such as the GC Pooling overnight rate and the repo funds rate, the volatility of the €STR remained more contained. Repo rates exhibited much stronger volatility around quarter-ends than the €STR, in view of their collateral component.
The ECB periodically publishes summary information on errors larger than 0.1 basis points that were detected after the standard publication and did not meet the republication criteria. There were nine such errors in the first year of the €STR, 17 in the second and only four such cases in the most recent year. These errors only had an insignificant impact on volatility, so that on average day-to-day deviations remained within the ranges seen on normal days. The limited impact such production errors had on the accuracy of the rate confirms that (i) the methodology is sufficiently robust to cope with such events, and (ii) the underlying market liquidity is sufficiently high for single reporting issues to be unlikely to have any material impact on the rate.
In the year under review, the €STR was consistent with general market trends, including in the context of the ECB policy rate hikes. The distribution of the underlying transactions changed somewhat in 2022, with the weight of transactions at lower rates increasing compared with the previous year. Volatility remained contained. The rate reflected the impact of factors affecting day-to-day money market liquidity and trading patterns, such as quarter-ends.
2.2 Assessment of data sufficiency
The underlying transaction volumes providing the basis for calculating the €STR increased during the period under review, reaching an average of €52 billion compared with an average of €45 billion in the second review year and €38 billion in the first. In the year under review, the underlying volumes oscillated between a low of around €14 billion over the 2021 year-end period and the all-time high of €80 billion reached on 14 September 2022 (Chart 4). As discussed in the following section, the reporting banks accepted deposits from a wide range of financial institutions, of which money market funds accounted for the highest share. Since the coronavirus (COVID-19) market stress in 2020 in particular, money market funds have maintained significant amounts of overnight deposits with reporting banks. Generally, maintaining ample overnight liquidity buffers remained important for many financial institutions in the context of increased market volatility following the war in Ukraine. Finally, expectations of higher interest rates and the move to positive rates later on provided an incentive for many institutions to manage their liquidity more actively, which contributed to higher eligible volumes for the €STR.
Chart 4
€STR volume and number of active banks
(left-hand scale: volume in EUR billions; right-hand scale: number of active banks)
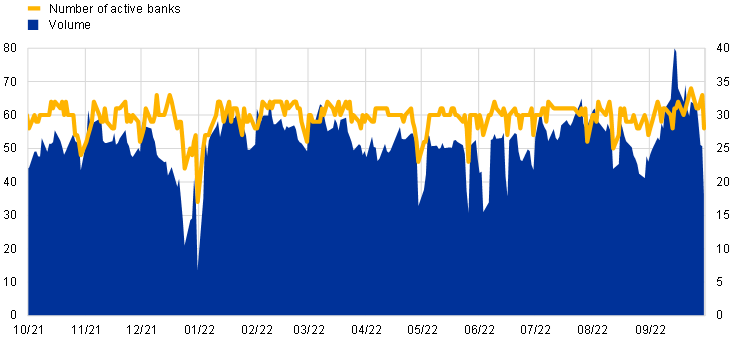
Source: ECB calculations.
As expected, unsecured money market activity was more subdued during the holiday periods, for example during the Christmas period in 2021 and also during local holidays in some euro area countries. On 31 December the second-lowest volume in the history of the €STR was registered, standing at below €14 billion, as market participants were closing their books, thus refraining from entering into new transactions and expanding their balance sheets.
The level of participation remained steady overall, with around 30 banks reporting eligible overnight transactions every day. Participation dropped significantly around holidays – the Christmas period, New Year, Labour Day, Ascension Day and Whit Monday. On a single occasion, 31 December 2021, the level of participation dropped below the data sufficiency threshold of 20, which resulted in the €STR being calculated and published under the contingency procedure. The relative stability of the rate on 31 December 2021 was hence also evidence of the robustness of the €STR contingency computation methodology.
€STR volumes increased further, averaging €52 billion in the third year of rate production. This indicated a sufficient level of market liquidity underpinning the rate and therefore provided a solid basis for the day-to-day rate calculation. Contingency computation had to be triggered only once, at year-end, owing to the drop in market activity at that time.
2.3 Assessment of rate representativeness
During the period under review the €STR saw an improvement in the concentration metrics relating to reporting banks and the sectors of the counterparties involved, although the combined share of activity attributable to French and German reporting agents increased.
The volume share of the five largest banks decreased slightly to 55% on average, compared with 56% and 54% in the second and first years of €STR production respectively. Concentration remained well below the 60% mark observed in the initial calibration of the methodology.
The combined share of volume reported by banks located in Germany and France rose to 82% in the period under review, compared with 76% and 72% in the second and first years of production, and 58% in the pre-production analysis. This rise was essentially driven by an increase in the activity of German banks, while the share of French banks declined slightly. The activity of Dutch and Belgian reporting agents continued to fall, with their share of volume dropping from 33% in the pre-production period to 20% and 19% in the first and second years of the €STR, and 15% in the third (Chart 5).
Chart 5
Volume share of reporting banks by size and location

Source: ECB calculations
Overall, 13 different banks featured among the five largest reporting institutions in terms of volume contribution during the period under review. That compares with 11 and 16 banks observed during the second and the first years of €STR production respectively.
The participation of reporting agents is measured by looking at how many banks ranked among the five most active reporting agents in terms of volumes and for how long. A higher number of banks made it to each of the five highest ranks, while the turnover of institutions within each rank increased marginally. However, the number of days during which these most active banks were present was either unchanged or slightly lower compared with the 2020-21 period (Chart 6). For example, the top three institutions that made it to rank one remained there in 97% of days versus 98% in the second year of the €STR and 92% in the first year.
Chart 6
Reporting agent participation indicator

Source: ECB calculations
Notes: The chart shows the number of reporting agents within each rank (bars) and the frequency of participation of the top three reporting agents in each rank (dots). A high frequency implies a higher proportion of days during the respective period when the top three reporting agents occupied the respective rank.
The distribution of activity by counterparty sector was broadly unchanged. Money market funds remained by far the biggest counterparties to reporting agents, generating some 44% of daily activity. Funds continued to hold significant cash buffers overnight with large banks owing to the increased macroeconomic and geopolitical uncertainties, together with expectations of increases in interest rates (Chart 7). Interbank activity remained limited at around 13%.
Chart 7
Breakdown of volumes by counterparty sector since October 2021: five-day moving average
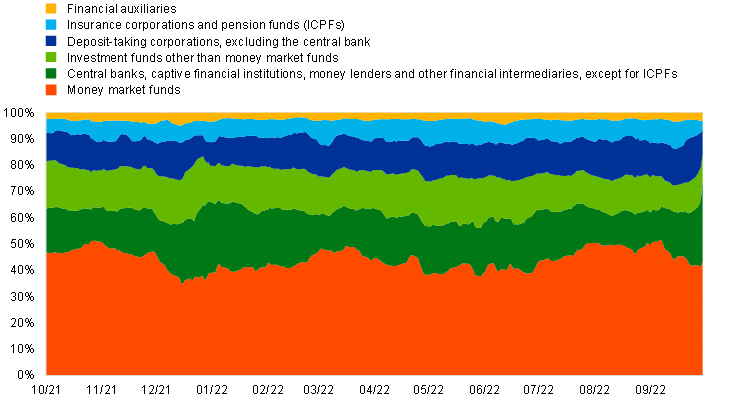
Source: ECB calculations.
Note: All borrowing transactions with a volume above €1 million (all rate types, all instrument types and all counterparty sectors are included).
Large French and German banks’ combined share of the transaction volumes underpinning the €STR increased further to 82% as they continued to gain a substantial portion of the activity generated by money market funds. Despite the higher concentration, there is still sufficient diversity of both reporting banks and counterparties for the benchmark to be representative. The changes in concentration metrics will continue to be monitored closely in the future.
3 Scope
This section aims to identify whether market liquidity in unsecured overnight trades conducted with financial firms using deposit instruments may have moved to sectors or maturities other than those currently eligible for inclusion in the €STR. If such gaps in coverage were to emerge, the ability of the €STR to adequately measure the underlying interest rate could be at risk and a reassessment of the scope might be necessary. For this analysis, a wider dataset than the one underpinning the €STR is required, so MMSR data are used.
3.1 Maturity analysis
During the period under review, the share of liquidity in the overnight segment (as opposed to other maturities) increased slightly, from 65% to 68% (Chart 8).
In absolute terms, the volume of overnight borrowing hovered at around €89 billion throughout the year, a marked increase over the year before (+10%). This reflects the persisting geopolitical and macroeconomic uncertainties, with money market funds in particular continuing to hold large overnight liquidity buffers in case investors demand repayment. It also reflects expectations of higher rates as mentioned in Section 2. The volume of borrowing at longer maturities increased at a similar pace to overnight borrowing in absolute terms compared with the previous year, resulting in the percentage share of liquidity remaining stable for these maturities.
Chart 8
Breakdown of volumes by maturity since 1 October 2020

Source: MMSR data.
Note: All borrowing transactions with a volume above €1 million (all rate types, all instrument types and all counterparty sectors are included).
Overnight borrowing– continues to represent by far the highest concentration of liquidity in the unsecured segment. This ensures that the rate is robustly based on a wide pool of daily transactions.
3.2 Sectoral analysis
In terms of broad counterparty sectors, the share of non-financial firms rather than financial companies as counterparties increased to 28% during the last months of the period under review, up from around 20% at the end of 2021/beginning of 2022 (Chart 9). This increase can be largely attributed to the rise in the volume of transactions with non-financial corporations. Following the war in Ukraine, some corporates exposed to the energy sector have increased their cash buffers in response to the volatility in energy markets and the higher margin requirements set by central counterparties. However, in absolute terms, this increase in overnight depositing by non-financial counterparties does not represent a transfer of activity out of financials but rather an increase in overall activity. In addition, despite the decline in the share of activity represented by counterparties in the financial sector, they remain by far the dominant sector. Hence, data sufficiency based on the eligible scope in terms of broad counterparty sector (i.e. financials) is not compromised by this development.
The price of liquidity that reporting banks received from non-financial counterparties remained higher than that received from financials, reflecting pricing dynamics influenced by commercial considerations such as cross-selling. However, in response to the recent ECB policy rate hikes, this pricing difference narrowed to some extent, from an average spread of 7 basis points in the period up until June to an average of 3 basis points in the last quarter under review (Chart 10).
At least until the ECB started raising rates in July, the spread between financials and non-financials remained at a level justifying the decision for transactions executed with non-financial counterparties to remain outside the scope of the €STR. This decision was because the pricing conditions of these counterparties are materially influenced by parameters other than funding costs. More recently, during a period of increased activity, this spread has narrowed or been marginally inverted, and developments in this regard will therefore be monitored.
Chart 9
Breakdown of volumes by broad counterparty sector since 1 October 2021
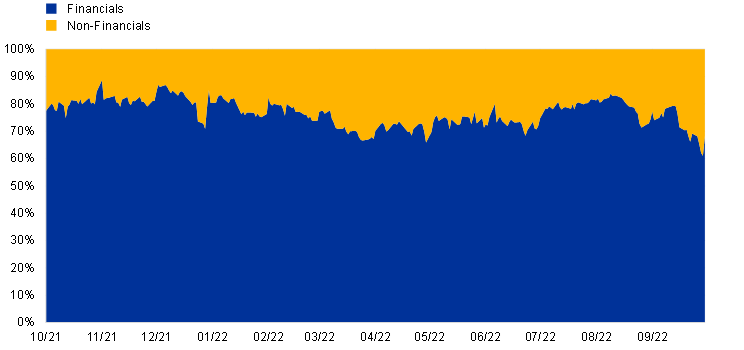
Source: MMSR data.
Note: Overnight borrowing transactions with a volume above €1 million (all instrument types, rate types and counterparty sectors are included).
Chart 10
Rates and spread by broad counterparty sector since 1 October 2021

Market liquidity remains largely within the broad counterparty sector eligible for inclusion in the scope of the €STR.
3.3 Instrument analysis
Compared with last year, the use of deposits was stable at 77% of all unsecured overnight transactions recorded in the MMSR data. The remaining instruments mainly consist of call accounts (Chart 11), generally used by some cooperative banking networks to place cash surpluses from their retail customers with their central institution reporting under the MMSR. Corporate and institutional clients favour deposits, as their day-to-day cash positions and limits require more flexibility than call accounts usually permit. After the ECB started to raise its policy rates in July 2022, both deposits and call account volumes increased at a broadly similar pace. This happened in particular after some clients started to engage once again in more active liquidity management in a positive rate environment.
Chart 11
Breakdown of volumes by instrument type since 1 October 2021

Source: MMSR data.
Notes: Overnight borrowing transactions with a volume above €1 million (all instrument types, rate types and counterparty sectors are included). Short-term securities include commercial paper, certificates of deposit and other securities.
The pricing of call accounts remains distinct from that of deposits. Since the ECB policy rate hike in July 2022, deposits have become better remunerated than call accounts, reversing the trend observed since the launch of the €STR whereby call accounts offered more favourable remuneration. Since the mid-September 2022 policy rate hike, remuneration for deposits has been 9 basis points higher on average than remuneration for call accounts (Chart 12). Several factors explain this new development. First, call account remuneration tends to be “stickier’’, which means it adjusts more slowly than deposit remuneration to new market conditions. This is because prices for call accounts are not renegotiated as often as those for deposits. Second, market feedback indicates significant increases in call account activity coming from a number of previously dormant accounts (especially in cooperative networks and notably among local authorities) which are priced at different terms than deposits.
This development shows the imperfect pass-through of the recent rate hikes to call accounts, in contrast to deposits.
Chart 12
Interest rate by instrument type since 1 October 2021
(percentage points)

Source: MMSR data.
Notes: Overnight borrowing transactions with a volume above €1 million (all instrument types, rate types and counterparty sectors are included). Short-term securities include commercial paper, certificates of deposit and other securities.
Liquidity with instruments that fall within the scope of the €STR increased, supporting the robustness of the rate. Deposits remain by far the most liquid instrument. The pricing behaviour of call accounts justifies the decision for them to remain out of scope for €STR calculation.
3.4 General assessment of scope
The €STR scope remains appropriate. In particular:
- liquidity remains abundant in the overnight segment;
- liquidity remains concentrated among the counterparties and instruments initially identified as being the most active and appropriate;
- pricing dynamics and behaviours continue to justify the exclusion of instruments other than deposits.
- developments regarding non-financial corporates will be monitored.
4 Parameter calibration
In addition to the scope assessment, a review of the calculation parameters is also required. This review covers (i) the 25% trimming level applied in the daily calculation of the €STR, and (ii) the data sufficiency thresholds (contingency thresholds) which determine whether the standard or contingency method for calculation is applied.
4.1 Testing the 25% trimming level
Trimming is one of the key features of the methodology. It is a way of limiting volatility stemming from idiosyncratic factors. At the time the methodology was devised, a level of 25% was deemed appropriate.
The impact of the trimming level on volatility was retested using €STR data for the 12 months from 1 October 2021. The level shifts resulting from the ECB policy rate changes were filtered out, as otherwise volatility levels would have been artificially high. Compared with the findings for the periods 2016-18 and 2019-21, the data continue to suggest that trimming at 25% achieves an acceptable level of volatility in the rate. At this trimming level, volatility in the review year (at around 0.2 basis points) was very similar to that in previous years. This is consistent with the very stable price for overnight liquidity in the centre of the distribution (calculated taking 50% of transactions) in an environment of considerable excess liquidity.
Chart 13
Rate volatility according to trimming levels
(day-to-day volatility rate relative to the trimming level; x-axis: trimming level in percentage points; y-axis: average absolute day-to-day changes in basis points)

Sources: MMSR data and ECB calculations
Notes: Trimming level in percentages (x-axis); average absolute day-to-day changes in basis points (y-axis). The grey line indicates the suggested trimming level (25%) which coincides with the trimming level associated with the minimum average absolute day-to-day changes for 2021. The 2020 period covers 1 October 2019 to 30 September 2020. The 2021 period covers 1 October 2020 to 30 September 2021. Initial data for the €STR trimming level calibration cover the period from 1 August 2016 to 15 January 2018.
As in previous years, rate volatility was less influenced by the trimming level than was the case with the initial calibration made in 2018. The higher volatility at low trimming levels still suggests that outliers may influence the rate. We also observe a limited renewed increase in volatility at a 50% trimming level (which amounts to a rate calculated based on a median). This suggests the continued existence of pools of liquidity at slightly different prices very close to the centre of the distribution, and the median may fall within any of them.
Overall, the trimming level had limited influence on the behaviour of the rate (Chart 13), so no change is needed.
The 25% trimming level remains adequate overall.
4.2 Testing the contingency thresholds
The contingency policy aims to ensure the continuity of €STR publication when (a) there are not enough banks sending data (i.e. there are fewer than 20), or (b) the share of the largest contributors goes beyond certain levels (five banks represent 75% or more of turnover). These safeguards protect the rate from the risk of bias in the event of insufficient data, while being agnostic as to the source of data insufficiency and/or excessive concentration. Data insufficiency can be caused either by a genuine lack of market activity or by technical incidents preventing a sufficient data feed.
In the past year, the number of active banks remained stable at around 30, except on 31 December 2021, when a contingency procedure was required (Chart 14, upper panel). On this date only 17 banks reported transactions, thus triggering the contingency publication using the previous day’s data and those available for 31 December, in accordance with the methodology. The contingency computation limited the rate volatility, which would otherwise have been more exposed to outlying values. This demonstrated the robustness and appropriateness of the current methodology.
In May and June, bank holidays in some countries had an impact on participation. However, even on those dates, the concentration metrics for the five largest banks remained below the 75% threshold at around 65% (Chart 14, lower panel).
Chart 14
Contingency monitoring

Source: ECB.
Market activity increased further in the year under review. The average daily volume reached around €52 billion, while the average number of daily transactions (532) and the average number of active banks (30) were fairly similar to those of the previous year. The lowest number of banks actively reporting was 17 on 31 December 2021, the day that the above-mentioned contingency publication was triggered (Table 1).
Table 1
Activity metrics

Source: MMSR.
Leaving aside the contingency situation, the individual days with the lowest numbers of reporting banks were 24 December 2021 (22 banks) and 26 May 2022 (Ascension Day, 23 banks). These numbers are comparable with those in the previous year.
The lower participation at reporting dates reflects regulatory constraints, which generally tend to weigh on the ability of banks to expand their balance sheet over these periods.
During bank holidays it is also common for funding to be more widely executed at maturities longer than overnight and typically up to one week, bridging the period where depositors are less active.
Otherwise, on normal days the metrics show the robustness of the market activity on which accurate measurement of the underlying interest is built. Therefore, no changes in the contingency parameters are needed.
Contingency parameters continue to provide adequate safeguards against any scenario in which there would be insufficient data to calculate the €STR. They are adequate in the current market circumstances, where shifts in market participation are expected, especially around holidays and reporting dates. Therefore, they will be kept unchanged and monitored carefully.
5 Overall assessment
The assessment presented in this report demonstrates that the €STR continues to provide an accurate reflection of short-term wholesale unsecured bank borrowing costs. The rate is consistently backed by sufficient market activity, which ensures that it remains a representative and unbiased measure of the very short-term borrowing costs of the reporting banks. The scope remains adequate for calculating the rate, as it captured all relevant market liquidity within the money market statistical reporting universe in the year under review. The contingency thresholds remain commensurate to the daily changes in market participation and have proved to be an adequate safeguard for representative and unbiased rate calculation. Finally, the level of trimming applied in the calculation contributes to the desired reduction in volatility by helping to prevent idiosyncratic factors from affecting the rate level.
These findings allow the administrator to conclude that no changes need to be made to the €STR methodology.
© European Central Bank, 2022
Postal address 60640 Frankfurt am Main, Germany
Telephone +49 69 1344 0
Website www.ecb.europa.eu
All rights reserved. Reproduction for educational and non-commercial purposes is permitted provided that the source is acknowledged.
For specific terminology please refer to the ECB glossary (available in English only).
PDF ISBN 978-92-899-5466-2, ISSN 2811-6828, doi:10.2866/923408, QB-CT-22-001-EN-N
HTML ISBN 978-92-899-5467-9, ISSN 2811-6828, doi:10.2866/064211, QB-CT-22-001-EN-Q