
- CONSUMER EXPECTATIONS SURVEY – LATEST RESULTS
Income and consumption
Frankfurt am Main, 12 January 2023
Overview
This report contains the main aggregate indicators from the Consumer Expectations Survey (CES) related to household income and consumption. Results are reported monthly at the euro area level, by country, by age group and by income quintile. The topics covered include:
- Household net income expectations over the next 12 months
- Household spending perceptions over the previous 12 months
- Household spending expectations over the next 12 months
Table 1 provides an overview of the latest results for the main indicators included in this report. For more detailed information on how the aggregate indicators are computed, please refer to the Guide to the computation of aggregate statistics and the CES Methodological information on the survey, available on the data and methodological information section of the CES webpage. The data behind the aggregate series included in this report can also be found under the same section.
Table 1
Overview of latest results – Income and consumption

Source: CES.
Notes: Weighted estimates. The median is computed on the basis of a symmetric linear interpolation that accounts for rounding of responses. Mean values are winsorised at the 2nd and 98th percentiles of each survey round and country. Numbers on household spending and household net income represent expected and perceived annual percentage changes.
Household net income expectations over the next 12 months
In the qualitative question, respondents are asked: “Over the next 12 months, what do you expect will happen to your household’s total net income (that is after tax and compulsory deductions)?” The possible responses are “Increase a lot”, “Decrease a lot”, “Increase a little”, “Decrease a little” and “Stay exactly the same”.
The open-ended (quantitative) question reads: “By about what percent do you expect the total net income of your household to increase/decrease, during the next 12 months?”
Chart 1
Household net income expectations 12 months ahead – qualitative
Qualitative measure of income expectations (forward-looking)
(percentages of respondents)

Source: CES.
Notes: Weighted estimates. Net percentages are obtained by subtracting the percentage of respondents indicating that their income will decrease from the percentage of respondents indicating that their income will increase.
Chart 2
Household net income expectations 12 months ahead – pooled
Quantitative measure of income expectations (forward-looking)
(percentage changes)

Source: CES.
Notes: Weighted estimates. The median is computed on the basis of a symmetric linear interpolation that accounts for rounding of responses. Mean values are winsorised at the 2nd and 98th percentiles of each survey round and country.
Chart 3
Mean household net income expectations 12 months ahead – by country
Quantitative measure of income expectations (forward-looking)
(percentage changes)
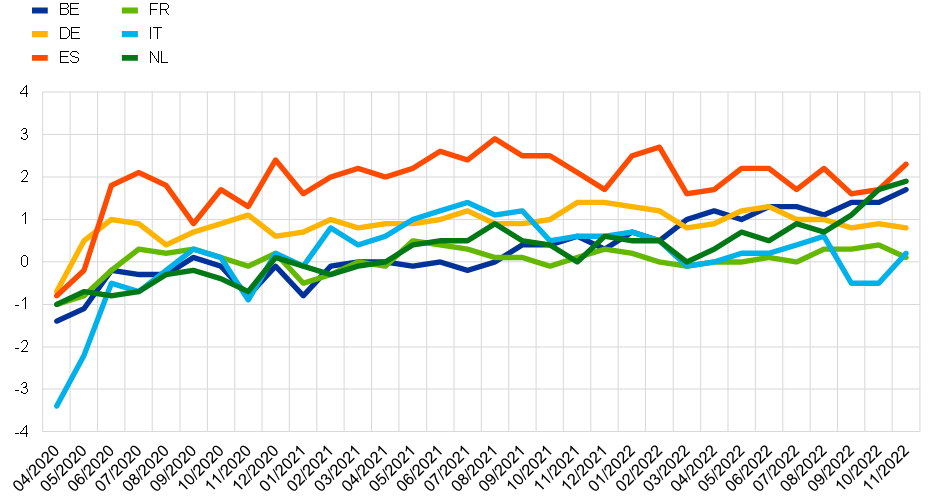
Source: CES.
Notes: Weighted estimates. Mean values are winsorised at the 2nd and 98th percentiles of each survey round and country.
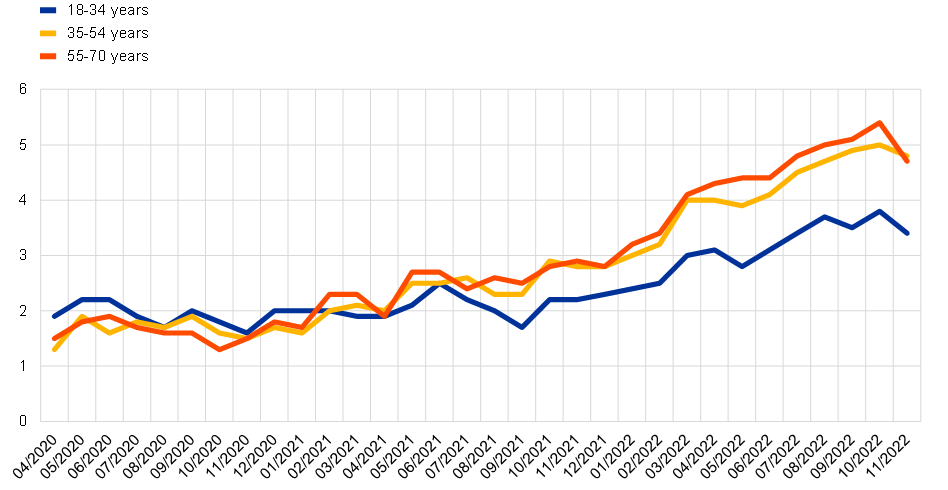
Chart 4
Mean household net income expectations 12 months ahead – by age
Quantitative measure of income expectations (forward-looking)
(percentage changes)

Source: CES.
Notes: Weighted estimates. Mean values are winsorised at the 2nd and 98th percentiles of each survey round and country.
Chart 5
Mean household net income expectations 12 months ahead – by income quintile
Quantitative measure of income expectations (forward-looking)
(percentage changes)

Source: CES.
Notes: Weighted estimates. Mean values are winsorised at the 2nd and 98th percentiles of each survey round and country.
Household spending perceptions over the previous 12 months
In the qualitative question, respondents are asked: “Compared with 12 months ago, what do you think has happened to your household spending?” The possible responses are “My household spending increased a lot”, “My household spending decreased a lot”, “My household spending increased a little”, “My household spending decreased a little”, and “My household spending remained exactly the same”.
The open-ended (quantitative) question reads: “How much higher/lower do you think your household spending is now compared with 12 months ago?” If a “Don’t know” answer is selected, respondents can provide answers in bracketed ranges.
Chart 6
Household spending perceptions over the previous 12 months – qualitative
Qualitative measure of household spending (backward-looking)
(percentages of respondents)

Source: CES.
Notes: Weighted estimates. Net percentages are obtained by subtracting the percentage of respondents indicating that their household spending has decreased from the percentage of respondents indicating that their household spending has increased.
Chart 7
Household spending perceptions over the previous 12 months – pooled
Quantitative measure of household spending (backward-looking)
(percentage changes)

Source: CES.
Notes: Weighted estimates. The median is computed on the basis of a symmetric linear interpolation that accounts for rounding of responses. Mean values are winsorised at the 2nd and 98th percentiles of each survey round and country.
Chart 8
Mean household spending perceptions over the previous 12 months – by country
Quantitative measure of household spending (backward-looking)
(percentage changes)
Source: CES.
Notes: Weighted estimates. Mean values are winsorised at the 2nd and 98th percentiles of each survey round and country.
Chart 9
Mean household spending perceptions over the previous 12 months – by age
Quantitative measure of household spending (backward-looking)
(percentage changes)

Source: CES.
Notes: Weighted estimates. Mean values are winsorised at the 2nd and 98th percentiles of each survey round and country.
Chart 10
Mean household spending perceptions over the previous 12 months – by income quintile
Quantitative measure of household spending (backward-looking)
(percentage changes)

Source: CES.
Notes: Weighted estimates. Mean values are winsorised at the 2nd and 98th percentiles of each survey round and country.
Household spending expectations over the next 12 months
In the qualitative question, respondents are asked: “During the next 12 months, how do you expect your household spending on all goods and services to compare with your spending in the past 12 months?” The possible responses are “My household spending will increase a lot”, “My household spending will decrease a lot”, “My household spending will increase a little”, “My household spending will decrease a little” and “My household spending will remain exactly the same”.
The open-ended (quantitative) question reads: “By what percent do you expect your household spending on all goods and services to change during the next 12 months compared with your spending in the past 12 months?” If a “Don’t know” answer is selected, respondents can provide answers in bracketed ranges.
Chart 11
Household spending expectations over the next 12 months – qualitative
Qualitative measure of household spending (forward-looking)
(percentages of respondents)

Source: CES.
Notes: Weighted estimates. Net percentages are obtained by subtracting the percentage of respondents indicating that their household spending will decrease from the percentage of respondents indicating that their household spending will increase.
Chart 12
Household spending expectations over the next 12 months – pooled
Quantitative measure of household spending (forward-looking)
(percentage changes)
Source: CES.
Notes: Weighted estimates. Mean values are winsorised at the 2nd and 98th percentiles of each survey round and country. The median is computed on the basis of a symmetric linear interpolation that accounts for rounding of responses.
Chart 13
Mean household spending expectations over the next 12 months – by country
Quantitative measure of household spending (forward-looking)
(percentage changes)

Source: CES.
Notes: Weighted estimates. Mean values are winsorised at the 2nd and 98th percentiles of each survey round and country.
Chart 14
Mean household spending expectations over the next 12 months – by age group
Quantitative measure of household spending (forward-looking)
(percentage changes)
Source: CES.
Notes: Weighted estimates. Mean values are winsorised at the 2nd and 98th percentiles of each survey round and country.
Chart 15
Mean household spending expectations over the next 12 months – by income quintile
Quantitative measure of household spending (forward-looking)
(percentage changes)

Source: CES.
Notes: Weighted estimates. Mean values are winsorised at the 2nd and 98th percentiles of each survey round and country.