
What is behind the change in the gap between services price inflation and goods price inflation?
Published as part of the ECB Economic Bulletin, Issue 5/2019.
Services price inflation tends to be much higher than non-energy goods price inflation. This tendency has not only been a feature of the euro area economy over the past 20 years but has also been observed in the US economy. The gap and its variation over time, which implies a changing speed in the evolution of relative prices, indicate that aggregate inflation developments typically reflect more than a generalised change in the purchasing power of money. Understanding the nature of the demand and supply forces that underlie relative price developments is an important element of inflation analysis. Against this background, this box reviews some of the features and sources of the gap between services price inflation and non-energy industrial goods price inflation in the euro area.[1]
The gap between services price inflation and goods price inflation has narrowed in the period following the financial crisis. Since 1999, HICP services price inflation in the euro area has been, on average, 1.9%, whereas non-energy industrial goods price inflation has been about 0.6%. The gap between the two rates has been positive at all times during the past 20 years (see Chart A). However, the gap declined from an average of 1.5 percentage points in the period 1999-2008 to an average of 1 percentage point in the period 2008-19. The narrower gap reflects a larger decline in average services price inflation (2.3% to 1.5%) than in average non-energy industrial goods price inflation (0.7% to 0.5%) from the first period to the next. These developments have occurred against the backdrop of a different demand environment in the euro area since the crisis. In open economies, a higher level of demand typically benefits the price of non-tradable services more than the price of tradable goods. It is therefore likely that the larger decline in services price inflation than in non-energy industrial goods price inflation has to some extent reflected the weaker demand conditions in the euro area after the crisis. The focus of this box, however, is on the role of unit labour costs and import prices in explaining relative inflation developments in services and non-energy industrial goods.
Chart A
Services and goods price inflation and the gap between the two
(annual percentage changes and percentage points)

Sources: Eurostat and ECB calculations.
Notes: The services/goods price inflation gap is the difference between the annual rates of change in the HICP components services and non-energy industrial goods. The spike in services price inflation in 2015 is due to Eurostat’s methodological changes to the treatment of package holiday prices in Germany.
The decline in services and non-energy industrial goods price inflation is fairly broad based in terms of the respective sub-components. Chart B shows this in terms of their contributions to services and non-energy industrial goods price inflation respectively, with the changes from the first period to the second largely reflecting changes in inflation rates rather than changes in the weights of components.[2] With the exception of communication services, all sub-components have recorded lower average contributions to services and non-energy industrial goods price inflation in the post-crisis period than previously (see Chart B). The less negative average inflation rate for communication services is, to a large extent, accounted for by a less pronounced trend decline in the price of telephone services and equipment. This slower trend decline likely reflects some fading out of the longer-term impact of large-scale liberalisation of the telecommunications sector and of the IT revolution in the early 2000s. The drop in the average contribution of miscellaneous services to overall services price inflation is largely due to developments in medical and education services, including the abolition of medical fees and education fees over a number of years in some euro area countries. The main driver of the smaller contribution to inflation from recreation and personal services has been the slowdown in restaurant services prices growth; this likely reflected a drop in demand in some countries in the aftermath of the crisis but also specific tax reductions in others. The decline in the contribution from transportation services reflected lower price increases for car maintenance and repair, which were likely linked to the car scrapping schemes introduced following the crisis and the associated renewal of the stock of cars and reduced need for repairs in subsequent years. Lower rent inflation has been the main driver of the decline in the contribution from housing services inflation.[3] The declines in the contributions from the non-energy industrial goods sub-components have been more muted than those for services. The decrease in the contribution from non-durable goods has reflected price developments in different goods, especially those for personal care. The decline in semi-durable goods inflation has mirrored slower price dynamics in both clothing and non-clothing items. Slower car and furniture price increases, the latter particularly relevant in countries that experienced the pre-crisis housing boom, have been behind the slowdown in durable goods inflation. A factor that is likely to have dampened price dynamics across a broad range of non-energy industrial goods is an increase in competition, fostered by the rapid growth of online businesses. On the whole, this granular perspective suggests that the changes in the inflation gap between services and non-energy industrial goods may reflect both general factors and the accumulation of idiosyncratic developments for individual euro area countries and HICP items.
Chart B
Average contributions of the respective sub-components to services and goods price inflation rates
(percentage points)

Sources: Eurostat and ECB calculations.
Notes: Red bars show services sub-components and blue bars show non-energy industrial goods sub-components.
Wages and productivity are typically seen as some of the main general factors behind the gap between services price inflation and goods price inflation. This can be seen by looking at production sectors and making a broad association between manufacturing and the production of non-energy industrial goods on the one hand, and between market services and the production of consumer services on the other hand. Over the past two decades, productivity growth in the euro area has been much stronger in the manufacturing sector than in the market services sector, whereas for wage growth this was much less the case. A high wage growth relative to productivity growth in the services sector is in line with the Balassa-Samuelson effect, whereby the relatively high wage growth in the manufacturing and tradable goods sectors spills over to the market services sector with its non-tradable goods. The importance of wage growth in determining services price increases is strengthened by the different cost structure of the two sectors. Labour costs are estimated to have represented about 40% of the cost structure in services and about 20% in industry excluding energy and construction in both 2008 and 2016.[4] Looking at the synthesis of wages and productivity in terms of unit labour cost growth, the decline in the gap between services price inflation and goods price inflation in the post-crisis period has coincided with the corresponding decline in the gap between the unit labour cost growth of the two sectors. There has been a large decline (of about one-half of a percentage point) in average unit labour cost growth in the services sector in the post-crisis period, while average unit labour cost growth in manufacturing has remained stable across the two periods. Although average growth in wages (compensation per employee) and productivity declined in both sectors, the decline in wage growth has been much larger than that of productivity in the services sector (see Chart C).
Chart C
Unit labour cost growth – sectoral developments
(average annual percentage changes)
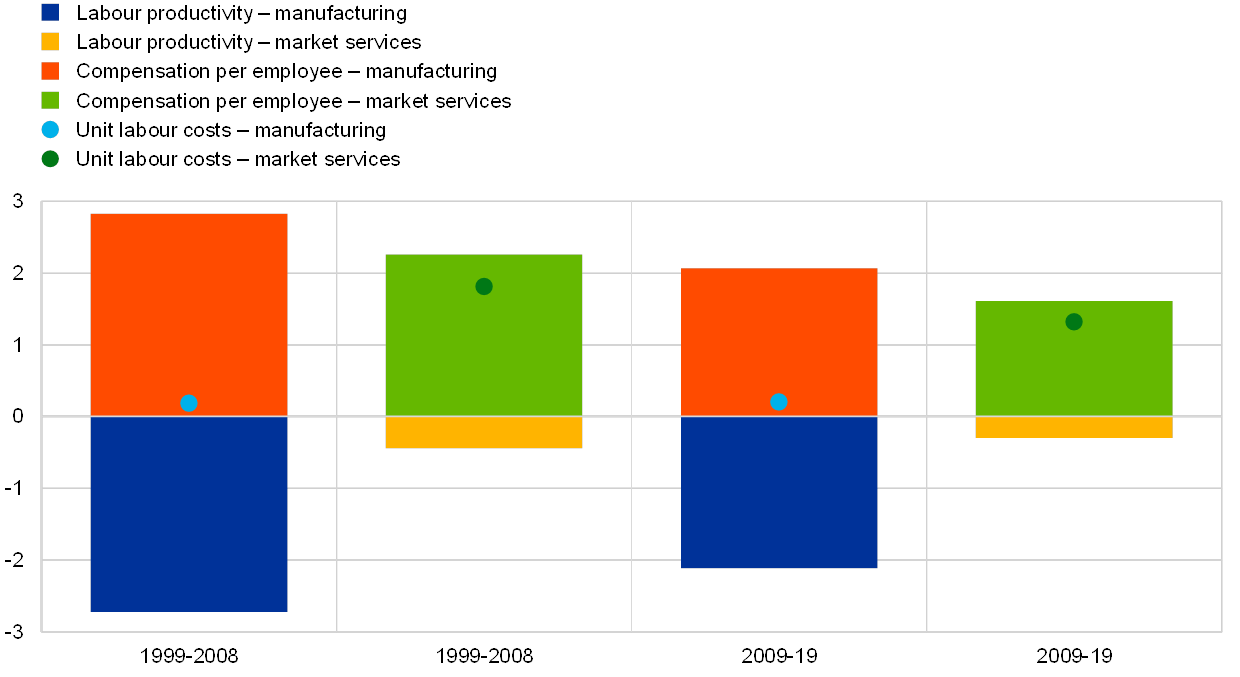
Sources: Eurostat and ECB calculations.
Notes: Labour productivity is shown on an inverse scale. Market services are defined as services excluding public administration, education, health and social services.
Another general factor explaining the gap between services price inflation and goods price inflation is the different exposure to import price developments. The direct import content of non-energy industrial goods is about 12%, compared with about 1% for services. These ratios remained broadly unchanged between 2005 and 2017.[5] A comparison of the GDP deflator (a broad measure of domestic price developments) with the import deflator (a broad measure of foreign price developments) shows that the latter has generally been more subdued and saw a stronger decline between the pre- and post-crisis periods (the average increase in the GDP deflator fell from 2.0% to 1.1%, while that of the import deflator fell from 1.8% to 0.6%).[6] The subdued foreign cost growth has thus likely had a considerably larger dampening impact on non-energy industrial goods price inflation than on services price inflation. This may help to explain why non-energy industrial goods inflation has, on average, been only 0.5% in the post-crisis period. However, these developments have contributed to a widening rather than a narrowing of the gap between services price inflation and non-energy industrial goods price inflation. This suggests that the factors behind the diminishing gap were more on the services side.
One more general factor that may have operated largely on the services side is the evolution of administered prices excluding food and energy. Most of these administered prices are typically part of the services components of the HICP, rather than the non-energy industrial goods components. The lower average growth rate of administered prices excluding food and energy in the post-crisis period has thus contributed to the decline in the gap between services price inflation and goods price inflation (the average growth of administered prices has been 1.7% since 2009, compared with an average of 2.0% during the period 2001-08).[7]
Overall, the narrowing gap between services price inflation and goods price inflation helps to explain the lower HICP inflation excluding food and energy. The change in the gap seems to have largely reflected the relatively high decline in unit labour cost growth in the services sector that has dampened services inflation. Services accounted for 0.37 percentage points of the 0.5 percentage point decline in average HICP inflation excluding energy and food from 1.6% in the pre-crisis period to 1.1% in the period since 2009. However, HICP inflation excluding food and energy would have declined even more had the weight of the services component not changed. While the decline in inflation between the two periods was stronger for services than for non-energy goods, the average services price inflation rate remained visibly higher. The increase of the weight of services in HICP inflation excluding energy and food, from an average of 57% in the period 1999-2008 to an average of 61% in the period 2009-19, thus gave more prominence to the higher inflation rate of services in underlying inflation developments.
- For an analysis of the inflation gap in the euro area up to 2008, see the box entitled “Why is services inflation higher than goods inflation in the euro area?”, Monthly Bulletin, ECB, January 2009. This feature is also discussed in Cœuré, B., “The rise of services and the transmission of monetary policy”, speech given at the 21st Geneva Conference on the World Economy, 16 May 2019.
- The average weight of household services declined by 0.2 percentage points over the two periods and the weights of recreation and transportation services by 0.1 percentage points, while the average weight of miscellaneous services increased by 0.3 percentage points and that of communication services remained unchanged. Within non-energy industrial goods, the average weight of durables declined by 0.2 percentage points, that of non-durables increased by 0.2 percentage points and that of semi-durables remained unchanged.
- For a discussion, see the box entitled “Rent inflation in the euro area since the crisis”, Economic Bulletin, ECB, Issue 4, 2019.
- These estimates are obtained from the euro area input-output tables provided by Eurostat by dividing compensation of employees by the total costs of the sectors (where total costs comprise: foreign and domestic inputs of goods and services; taxes less subsidies; and compensation of employees).
- These estimates are based on Eurostat’s input-output tables, which provide the breakdown across sectors for private consumption and imports of final consumer goods and services for the years 2005-17. The ratio between the import content of the two sectors would likely be smaller if the indirect import content – which represents intermediate imported inputs used for the production of domestic goods and services – were also included, as it tends to be larger for services than for goods.
- Developments in the effective exchange rate of the euro do not support the narrowing of the inflation gap since, on the whole, the second period has seen a depreciation of the exchange rate, although the second period has been marked – like the first one – by large fluctuations in the euro exchange rate. Similarly, import prices for non-food consumer goods have increased by 1.1%, on average, since 2009, whereas they declined by 0.3%, on average, in the period 2006-08 (no data are available before 2006).
- The impact of changes in indirect taxes has been similar on services price inflation and non-energy industrial goods price inflation.