
The role of energy prices in recent inflation outcomes: a cross-country perspective
Published as part of the ECB Economic Bulletin, Issue 7/2018.
Euro area headline inflation is currently dominated by a strong contribution from energy prices. In the third quarter of 2018, energy prices contributed 0.9 percentage point to the headline HICP inflation rate of around 2.0%, thus accounting for almost half. This large contribution mainly reflects past developments in crude oil prices, a factor that constitutes a common influence across euro area countries. However, the contribution of energy to HICP inflation depends both on the share of energy in consumption expenditure and on the degree of pass-through of oil price developments to consumer energy prices. This box reviews the extent to which these features can help explain differences across euro area countries in the recent contribution of energy to overall HICP inflation.[1]
The contribution of energy to HICP inflation currently differs significantly across euro area countries. For most large countries, in the third quarter of 2018 the share of HICP inflation accounted for by the energy contribution was fairly close to the euro area average, i.e. up to half (see Chart A). However, for some smaller countries, this share ranged from very small (energy accounting for almost nothing in Malta) to very high (energy accounting for almost all of HICP inflation in Ireland). It should be noted that this cross-country comparison is only indicative of the relative importance of energy, as headline HICP is also determined by developments in HICP inflation excluding energy.[2]
Chart A
Energy inflation in HICP inflation in the third quarter of 2018
(percentage point contributions; annual percentage changes in HICP)
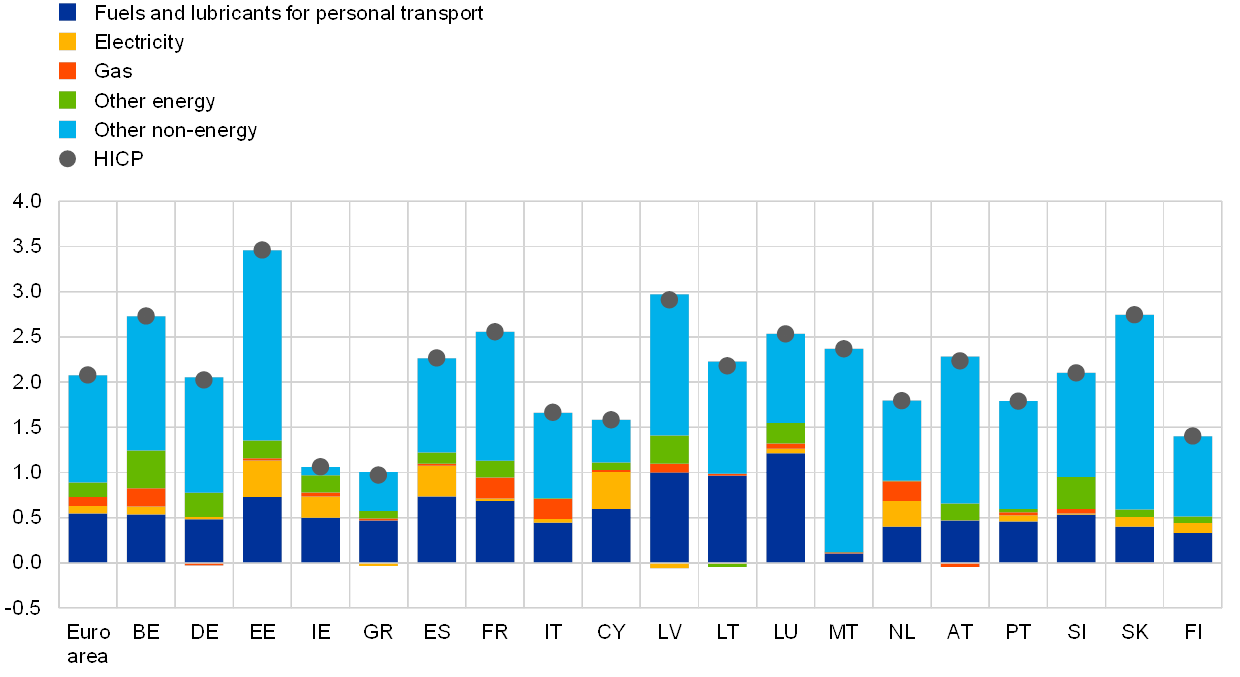
Sources: Eurostat and ECB calculations.
Note: “Other energy” includes liquid and solid fuels and heat energy.
The weight of energy in the HICP differs across countries, but cannot fully explain current differences in contributions to headline inflation. Current contributions of energy prices to headline inflation are generally above what would be implied by the energy weight in the HICP. These weights range from around 6% in Malta to almost 15% in Slovakia, while for the euro area as a whole the weight of energy in HICP is 10% (see Chart B). On balance, transport fuels account for roughly half of the energy weight (more than any other energy item), and fuel prices typically follow changes in crude oil prices in euro more closely than other energy components. This explains why, in all countries, fuel prices have historically been the main determinant of energy inflation dynamics.[3] At the same time, the differences in fuel price inflation across countries in the third quarter of 2018 were larger than can be accounted for by the differences in weights. This suggests that other factors are also at work in determining the pass-through.
Chart B
Weights of energy and its main sub-items in HICP in 2018
(percentages)
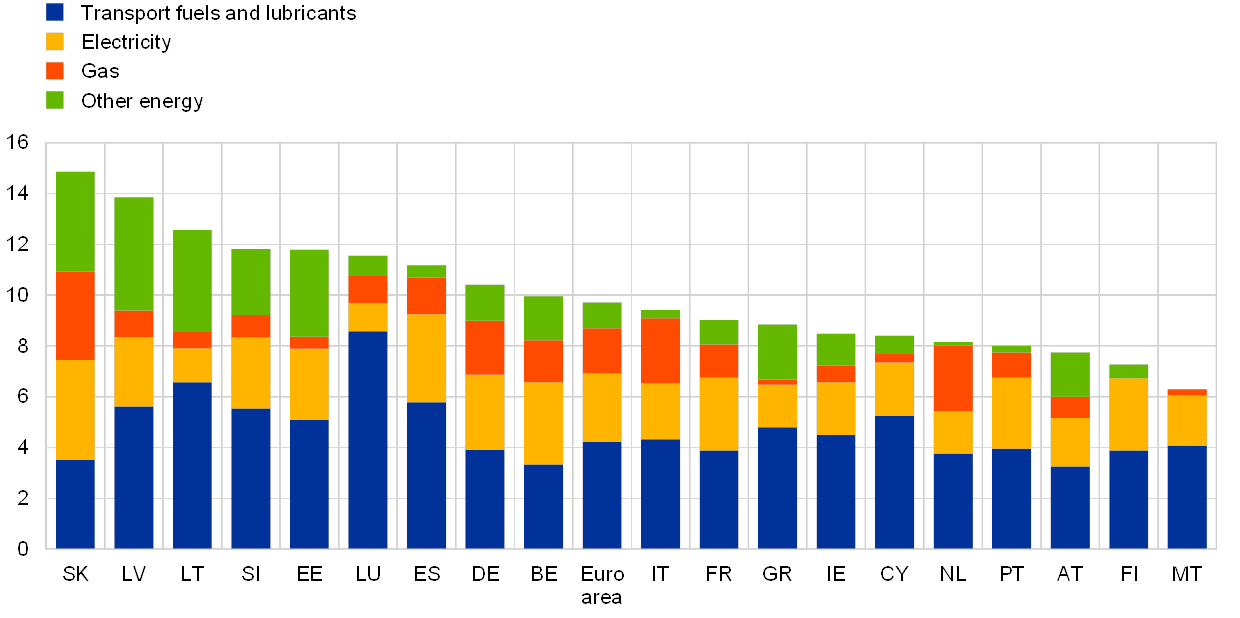
Sources: Eurostat and ECB calculations.
Note: “Other energy” includes liquid and solid fuels and heat energy. The relatively large weight of transport fuels in Luxembourg also reflects purchases by consumers who are not resident in Luxembourg.
The pass-through of oil prices to fuel prices is not one-to-one, as the final consumer price also depends on taxes and the behaviour of margins. Changes in taxes (in particular excise taxes) usually have a noticeable impact on fuel prices,[4] and the level of taxes affects the pass-through of oil price changes. The larger the share of excise taxes – a fixed amount per litre – is in a country’s fuel price, the smaller the percentage change in fuel prices is for a given change in oil prices. By contrast, although differences in rates of value added tax (VAT) can partly explain differences in the level of the consumer price of fuel, owing to the proportional nature of VAT, different VAT rates across countries cannot explain differences in the pass-through of changes in oil prices to fuel prices. In the case of petrol prices, the total tax share varies across countries from around 50% in Luxembourg, Malta and Spain to just above 60% in the Netherlands, Italy and Greece, thus partly helping to explain differences in the final level of the fuel price and the pass-through of crude oil price changes to fuel prices (see Chart C). Costs and margins arising in the refining and distribution processes usually constitute a relatively small part of fuel prices (just above 10%). Over longer horizons it is unlikely that, for instance due to differences in technology or buffering practices, such costs and margins could account for major differences across countries in the pass-through of crude oil prices to fuel prices. However, over shorter horizons, for instance if margins were to react to seasonal boosts in demand, such differences might become relevant.
Chart C
Decomposition of petrol prices in the third quarter of 2018
(left-hand scale: percentages; right-hand scale: EUR per litre)

Sources: Bloomberg, European Commission and ECB calculations.
Note: Refining margins are calculated as the difference between refined oil and crude oil prices, and distribution margins are calculated as the difference between petrol prices before taxes and refined oil prices.
Gas and electricity inflation does not necessarily co-move with oil prices and fuel inflation. While the pass-through of crude oil prices to fuel prices is relatively straightforward and fast (almost complete within five weeks),[5] the pass-through to consumer gas and electricity prices is more complex and more limited. Consumer gas prices are driven largely by wholesale gas prices, which over time have become less strongly linked to oil prices.[6] Electricity is generated in many different ways (hydro, solar, wind, nuclear, coal, etc.) and the frequency of price changes for electricity is different from that for fuel and gas. In all euro area countries, the link between oil prices and gas and electricity prices is more delayed and weaker than the link between oil prices and fuel prices, and the strength of the link also varies more across countries for gas and electricity than it does for fuel (see Chart D).[7] Moreover, in a number of euro area countries, gas and electricity prices (as well as heat energy) are fully or partly regulated, so they may respond to oil price changes with a delay or they may not respond at all.[8] Owing to this weaker link between gas and electricity prices and crude oil prices, euro area countries with a higher share of fuel in their energy basket have generally also had a higher contribution of energy to their inflation outcomes in recent months.
Chart D
Correlation of energy inflation items with crude oil prices (in euro)
(contemporaneous correlation coefficient of annual inflation rates, January 1999 to September 2018)

Sources: Bloomberg, Eurostat and ECB calculations.
Notes: Finland does not have gas in its consumer price basket. The pass-through of crude oil price changes to gas and electricity prices could take one to two years (the correlation coefficient for longer lags is higher), which is very slow compared to the rather fast pass-through to fuel prices (up to 90% within five weeks). However, even accounting for this delay, the correlation coefficient calculated for longer lags with crude oil prices is lower for gas and electricity prices than for fuel prices.
To conclude, all euro area countries have faced a rise in the oil price in euro, but this has affected their HICP inflation rates to different extents. This reflects differences in both the respective weights of energy items (fuel, gas and electricity) in the HICP and the strength of the link between the prices of the different energy items and oil prices. Hence, strong common oil price developments do not necessarily lead to a reduction in inflation dispersion. Looking forward, the small downward trend in crude oil futures prices implies that energy price inflation should moderate somewhat, reducing both its contribution to headline HICP inflation and cross-country differences in headline inflation due to energy outcomes.
- This box does not cover the impact of tax changes on energy inflation and the indirect first-round effects of oil price changes. For a description of latter, see Task Force of the Monetary Policy Committee of the European System of Central Banks, “Energy markets and the euro area macroeconomy”, Occasional Paper Series, No 113, ECB, June 2010, in particular the section entitled “The impact of energy prices on inflation”. On the impact of oil prices on euro area consumer energy prices, see also the box entitled “Oil prices and euro area consumer energy prices”, Economic Bulletin, Issue 2, ECB, 2016.
- Relative contributions can also be distorted if HICP excluding energy and/or energy inflation rates are negative.
- Over the period since 1999, the average (unweighted) contemporaneous correlation across euro area countries between annual rates of change in total energy and fuel prices has been 0.9, while for gas prices (at 0.5) and electricity prices (at 0.1) it has been significantly smaller.
- For example, increases in excise taxes contributed to higher annual fuel price inflation in Estonia and Latvia in the third quarter of 2018. Changes in excise taxes in France and Finland had smaller impacts.
- See Task Force of the Monetary Policy Committee of the European System of Central Banks, “Energy markets and the euro area macroeconomy”, Occasional Paper Series, No 113, ECB, June 2010, in particular the section entitled “The impact of energy prices on inflation”..
- Owing to developments in spot markets in Europe, the share of oil-linked wholesale gas pricing declined from around 80% in 2005 to around 30% in 2017. See International Gas Union, “Wholesale Gas Price Survey”, 2018 Edition, June 2018.
- Given the delay in the pass-through for gas and electricity prices, the correlation coefficient for longer lags (unweighted average across euro area countries; calculated using annual inflation rates) would reach 0.6 between crude oil and gas prices and 0.3 between crude oil and electricity prices, which is below the contemporaneous correlation coefficient of 0.8 between crude oil and fuel prices.
- According to Eurostat’s classification, the following countries have partly or fully regulated prices for either electricity, gas or heat energy: Estonia, Greece, Spain, France, Italy, Cyprus, Latvia, Lithuania, Malta, the Netherlands, Slovenia, Slovakia and Finland.