


Negative rates and the transmission of monetary policy
Negative rates and the transmission of monetary policy
Published as part of the ECB Economic Bulletin, Issue 3/2020.
1 Introduction
As structural and cyclical factors have brought nominal interest rates closer to zero, the need to ease financing conditions further has prompted the adoption of a negative interest rate policy (NIRP). The introduction of negative policy rates has been part of a comprehensive policy strategy adopted by the ECB since mid-2014 in order to stave off the unprecedented disinflationary forces that arose in the aftermath of the global and sovereign debt crises. The ECB has cut its deposit facility rate (DFR) into negative territory five times since 2014. The latest lowering of the DFR in September 2019 and the associated market expectations of a longer period of negative rates have reignited the question of how negative rates are transmitted to the economy, especially through banks, and whether they may have counter-productive effects by impinging on banks’ intermediation capacity.
Negative rates are transmitted via different channels. Negative rates soften the expectation of markets that current and future short-term rates cannot be negative. By lowering the perceived lower bound of central bank rates, negative rates allow the monetary accommodation to propagate through the entire yield curve. Moreover, investor demand for longer-dated assets increases more than when rates are positive, exerting further downward pressure on the term premium, i.e. the compensation that investors demand for the uncertainty regarding the future path of interest rates. Finally, commercial banks are incentivised to expand lending so as to avoid the negative rate applied to their excess holdings of reserves with the central bank (excess liquidity) in a situation in which the cost of liabilities is partially constrained.
The transmission of NIRP via banks could in principle be hindered by potential large-scale shifts into cash and downward pressure on bank profitability. The transmission of monetary policy could be diluted if investors hoard cash rather than rebalancing their portfolios towards longer-term or riskier assets. So far there are no signs of large-scale liquidity “leakages” of this type, mainly owing to the costs of forgoing the services provided by central bank reserves or commercial bank deposits as a means of conducting payments and storing value. This is partly due to the limited transmission of negative deposit rates to retail deposits, especially of households, which can, however, dent bank profitability and ultimately hamper their ability to provide lending to the real economy. Potential factors that may hinder the transmission of monetary policy in the event of any further extension of the policy or deeper cuts into negative rate territory must therefore be monitored closely.
Overall, negative interest rates have supported economic activity and ultimately contributed to price stability. As a result of NIRP, lending volumes have expanded and the creditworthiness of borrowers has improved, thereby mitigating the impact of lower interest margins on overall bank profitability. While NIRP, and more generally the low level of interest rates, may contribute to the build-up of debt and spur over-pricing of financial assets or exuberance in housing markets, when such phenomena are identified they are generally best addressed by targeted macroprudential policies. Meanwhile, the first-order and tangible effect of NIRP on financial stability has been that it has enhanced it by improving the sustainability of outstanding debt.
This article is organised as follows. Section 2 explains how negative rates are transmitted via banks and financial markets. Box 1 illustrates the transmission of NIRP to financial market prices. Section 3 then turns to the impact of negative rates on bank profitability and risk-taking. Box 2 describes the transmission of negative rates in money markets. Section 4 reports empirical evidence on how negative rates affect the broader economy. Section 5 concludes.
2 The transmission of negative interest rates
In June 2014 the ECB introduced NIRP as part of a broad credit easing package, leading to lower bank deposit and lending rates. NIRP shares some of the basic easing features of a standard interest rate cut, as is evident in the reaction of bank funding and lending rates to the original cut in the DFR into negative territory as well as to the subsequent reductions (see Chart 1). However, when rates are below zero, additional channels are activated. Some enhance the stimulus provided by the cut, while others can dampen transmission via banks.
NIRP reduces bank funding costs, stimulating loan supply. Composite funding costs for euro area banks have been compressed since 2014, helping to maintain intermediation margins for banks with an average funding structure. Moreover, there is evidence that, as negative rates persist, even banks that rely predominantly on deposit funding eventually pass the interest rate reduction on to at least part of their deposit base, namely corporate deposits and large retail deposits. However, some degree of downward rigidity in retail deposit rates remains, limiting the scope for further improvements in funding costs without changes to the funding structure.
Chart 1
Developments in policy rates, bank funding costs and bank lending rates
(percentages per annum)

Sources: ECB and ECB calculations.
Notes: The vertical black lines indicate the five cuts in the DFR into negative territory, from 0 to -0.1% in June 2014, from -0.1% to -0.2% in September 2014, from -0.2% to -0.3% in December 2015, from -0.3% to -0.4% in March 2016, and from -0.4% to -0.5% in September 2019. Latest observation: December 2019.
Moreover, there are additional channels that strengthen the transmission of negative rates compared to a standard rate cut, especially when the latter occurs close to the perceived “lower bound”.[2]
First, negative interest rates remove the non-negativity restriction on current and future expected short-term rates and, therefore, monetary accommodation can propagate throughout the yield curve. Before June 2014 the distribution of future expected short-term rates was effectively truncated at zero, as market participants were not assigning significant probability to future rates being negative. The introduction of negative policy rates allowed the constellation of rates to expand into negative territory. As the expansion of the interest rate distribution on the negative side affects not only current rates but also expected future rates, the stimulus also propagates to longer maturities (see Box 1).
Second, NIRP increases investor demand for longer-dated assets, exerting further downward pressure on the term premium. The negative remuneration of excess liquidity and its transmission to short-term interest rates create incentives for investors to rebalance their portfolios towards assets with longer maturities, increasing the demand for these securities relative to their supply. While this compression in yields of longer-dated assets also occurs following policy rate cuts in positive territory, it becomes more prominent when rates are below zero, as some investors are particularly averse to accepting negative nominal returns, for instance because they are committed to providing positive nominal returns to their final beneficiaries. This ultimately exerts extra downward pressure on the term premium.
Third, commercial banks are encouraged to expand lending to avoid negative interest on their holdings of excess liquidity. Banks face a direct charge on their excess liquidity, which exerts pressure on their profitability, particularly as the remuneration of their liabilities is, in part, bounded at zero. They can avoid this charge by rebalancing their portfolios in favour of credit expansion or by purchasing securities.[3] In fact, returns on all liquid assets in banks’ portfolios drop relative to loans, providing them with a strong incentive to rebalance in favour of credit origination.[4]
At the same time, negative rates also entail frictions that may hinder the transmission of monetary policy via banks. Banknotes yield a zero nominal return, so, if deposits carry negative nominal interest rates, depositors may at some point resort to cash hoarding as a way to avoid them. This implies that retail deposit rates, which are quite responsive downwards when policy rates adjust in positive territory, become much stickier. As the returns on the assets held by banks are not subject to the same downward stickiness, this results in a compression of banks’ interest margins, which applies pressure on bank profitability. Moreover, banks tend to hold assets with relatively long durations, which reprice more slowly than their liabilities, so protracted periods of negative rates may dent banks’ net worth and thereby impair the bank-based transmission mechanism of monetary policy. Moreover, the pressure to maintain intermediation margins and to move away from less risky liquid assets provides banks with an incentive to increase their risk tolerance, which may eventually lead to excessive risk-taking.[5]
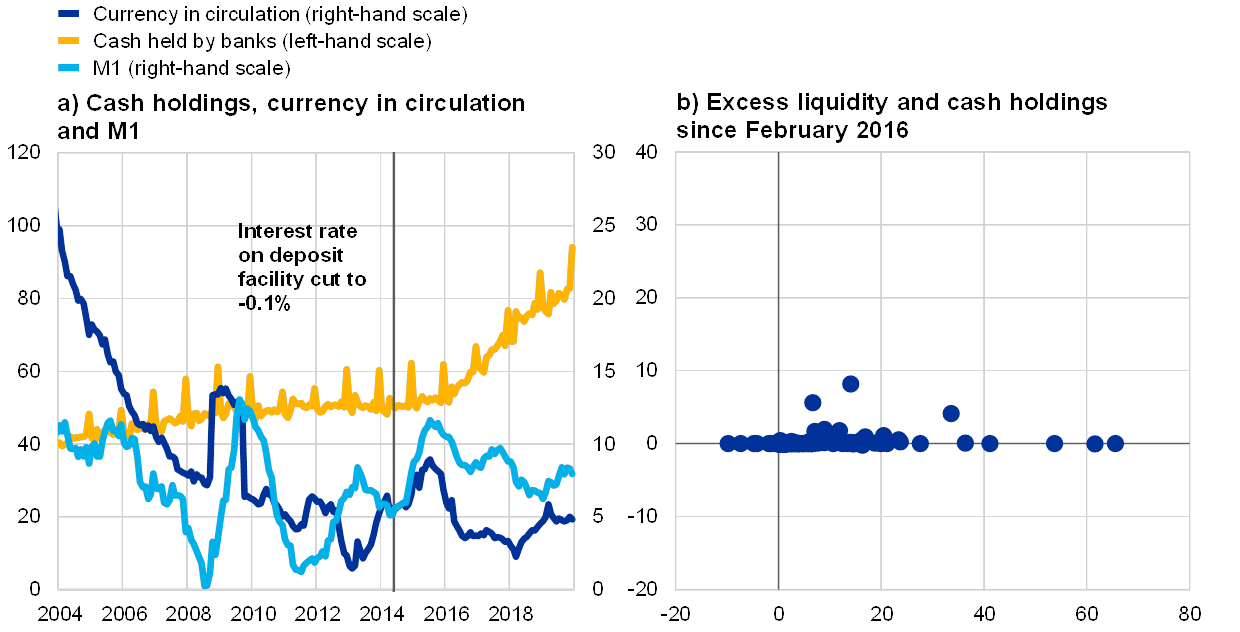
More generally, investors (banks and non-banks) might hoard cash rather than rebalance their portfolios towards longer-term or riskier assets, although there are no strong signals of such a “leakage”. To the extent that cash and deposits are perfect substitutes, agents would respond to negative interest rates on deposits by holding cash, implying an effective lower bound of zero for interest rates. However, in practice they are not perfect substitutes. In fact, deposits have several advantages, such as being a more efficient means of storing value and conducting payments. This convenience has an intrinsic monetary value. So far, there is no evidence of large-scale shifts into cash among depositors such as households, corporates or non-bank financial institutions (see Chart 2, panel a). Banks themselves may, in principle, also use their holdings of excess reserves with the central bank to acquire and hold banknotes as a way to eschew the negative rate on those reserves. While an increase in banks’ holdings of banknotes has indeed been observed, this has not occurred to an extent that would provide strong signals of a leakage of liquidity away from the banking sector and into cash, as there is very little correlation between excess liquidity and actual vault cash (see Chart 2, panel b).
Chart 2
Currency in circulation and holdings of cash and excess liquidity by euro area banks
(panel a: left-hand scale: non-seasonally adjusted stocks, EUR billions; right-hand scale: annual rate of growth, percentages; panel b: x-axis: changes in excess reserves, EUR billions; y-axis: changes in vault cash, EUR billions)
Sources: ECB and ECB calculations.
Notes: The vertical line in panel a indicates the introduction of the negative deposit rate in June 2014. Figures for currency in circulation refer to the year-on-year growth rate. For M1, the annual growth rate is shown. In panel b, changes between February 2016 and December 2019 are computed using annual averages. Latest observation: December 2019.
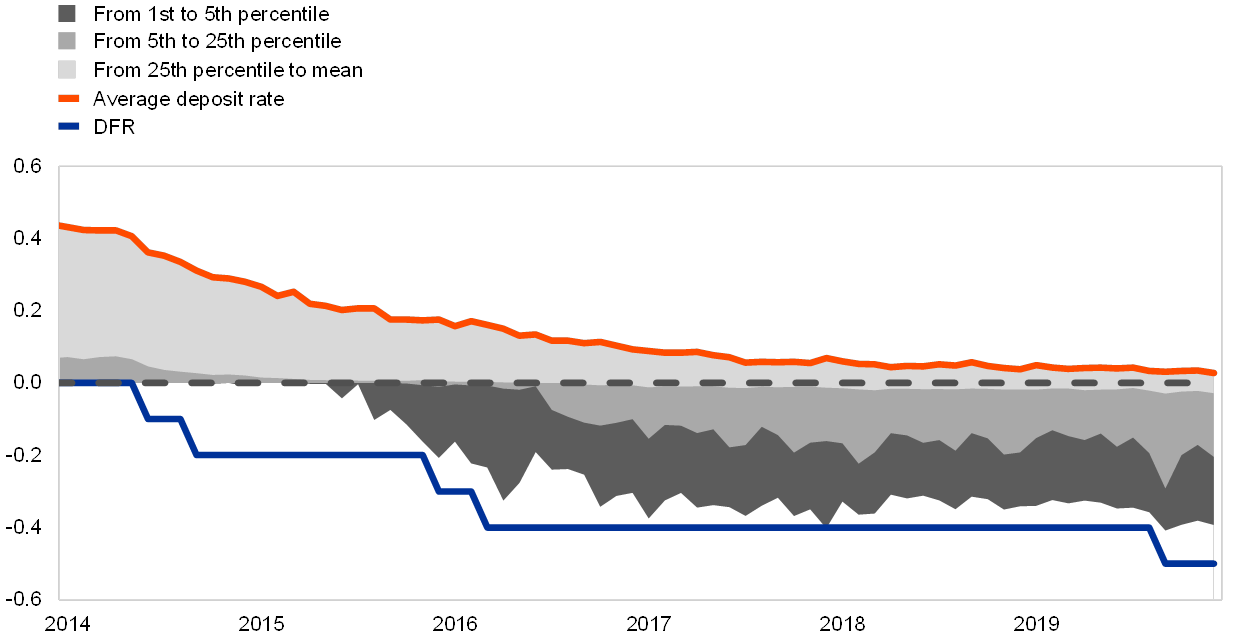
Retail deposits tend not to carry negative rates, either because of legislative hurdles and litigation risks or concerns about deposit withdrawals. Legislators and courts have so far maintained a legal framework that poses a series of legal constraints and litigation risks related to the application of negative deposit rates. These vary from country to country and according to the sector of the depositor and are also dependent on whether they would apply to new or existing contracts. However, in the majority of euro area countries, the transmission of negative rates to corporate deposits is not subject to legal constraints and is indeed a relatively widespread phenomenon which has been increasing over time (see Chart 3).[6] Moreover, fees and commissions can lead to an effective negative nominal return on deposits, even if they do not carry a negative interest rate. Nonetheless, there is no evidence that, as the remuneration of retail deposits passed the zero line, banks experienced significant outflows of deposits. This suggests that, until it reaches a level that exceeds the cost of hoarding cash, a negative nominal rate would only generate a change in behaviour among retail depositors as a result of some form of money illusion or other behavioural bias.[7]
Chart 3
Evolution of deposit rates for non-financial corporations
(percentages per annum)
Sources: ECB and ECB calculations.
Notes: The red line is a composite indicator of the average deposit rate on new deposits. The composite indicator is computed by taking the weighted average of deposit rates on new overnight and agreed maturity deposits, where the weights are outstanding amounts of these two categories. Rates on new deposits with agreed maturity are a weighted average of rates on new deposits for each maturity (below 1 year, between 1 and 2 years, above 2 years), where the weights are the 24-month moving averages of the new business volumes. Shaded areas refer to different quantiles of the distribution of deposit rates. The solid blue line is the DFR and the dashed black line indicates zero. Latest observation: December 2019.
Other instruments in the current policy toolbox, in particular asset purchases, forward guidance, targeted longer-term refinancing operations (TLTROs) and the two-tier system for reserve remuneration, complement and reinforce the transmission of NIRP. Asset purchases increase the volume of excess liquidity in the banking system, strengthening the pressure on individual banks to shift their excess liquidity to other banks by acquiring assets. Forward guidance reduces uncertainty about the future path of interest rates. TLTROs ensure that banks can obtain funding at very low interest rates (as low as the DFR) and help to channel the resulting reduction in funding costs towards new lending to firms and households (other than for house purchases). The two-tier system for reserve remuneration allows the accommodative effects of NIRP to be maintained while mitigating the downward pressure on bank profitability stemming from the negative remuneration of excess liquidity holdings.
Box 1The transmission of negative policy rates to the yield curve and other asset prices
Concomitant with the overall decline in the DFR of 50 basis points between June 2014 and the end of 2019, sovereign bond and swap rates across maturities decreased significantly, while corporate bond yields declined and equity prices rose. Specifically, the short end of the yield curve traced the 50 basis point reduction in the DFR almost one for one, with the one-week overnight index swap (OIS) rate decreasing by close to 60 basis points between 4 June 2014 and the end of 2019.[8] Ten-year OIS rates, a key benchmark for long-term risk-free rates in the euro area, declined by around 130 basis points over the same period, i.e. exceeding the decline at the short end of the curve. Investment grade corporate bond yields of non-financial corporations (NFCs) decreased by roughly 120 basis points, while euro area equity prices increased by close to 25%.
Bond yields across maturities have been influenced by a host of other factors besides changes in current and expected ECB policy rates. For instance, long-term rates also incorporate risk premia, which in turn depend on a number of factors, such as other policy measures (including asset purchases) and global risk factors.[9] In order to estimate the yield curve impact stemming purely from negative interest rate policy (NIRP), a counterfactual “no-NIRP” scenario has been constructed in which both current and expected future short-term rates are prevented from going below zero. Specifically, at any horizon, the option-implied risk-neutral density of future short-term rates is cut at zero from below and the probability mass that markets assigned to sub-zero rates is re-attributed to the zero lower bound. Such counterfactual rate distributions can be skewed to the upside, inducing a tightening bias in the corresponding forward curve. The difference between forward rates in such a hypothetical non-negative-rate scenario and observed rates is taken as the impact of negative policy rates. A Bayesian vector autoregression (BVAR) model has been used to translate the derived impact on the forward curve into the full yield curve impact.[10]
NIRP is estimated to have compressed two-year and ten-year sovereign bond yields by around 40 basis points and 35 basis points, respectively, by the end of 2019 (see Chart A). In contrast to estimates of standard policy rate cuts in positive territory, the impact on longer maturities is comparably large relative to the impact on the short end of the curve. This pattern is also visible when looking at changes in the yield curve in response to surprise policy rate cuts (shocks) averaged over several events; while the impact of a standard rate cut diminishes relatively quickly across maturities, it is more pronounced for rate cuts to negative levels.[11]
Chart A
Estimated impact of negative interest rate policy on the sovereign yield curve
(percentage points)
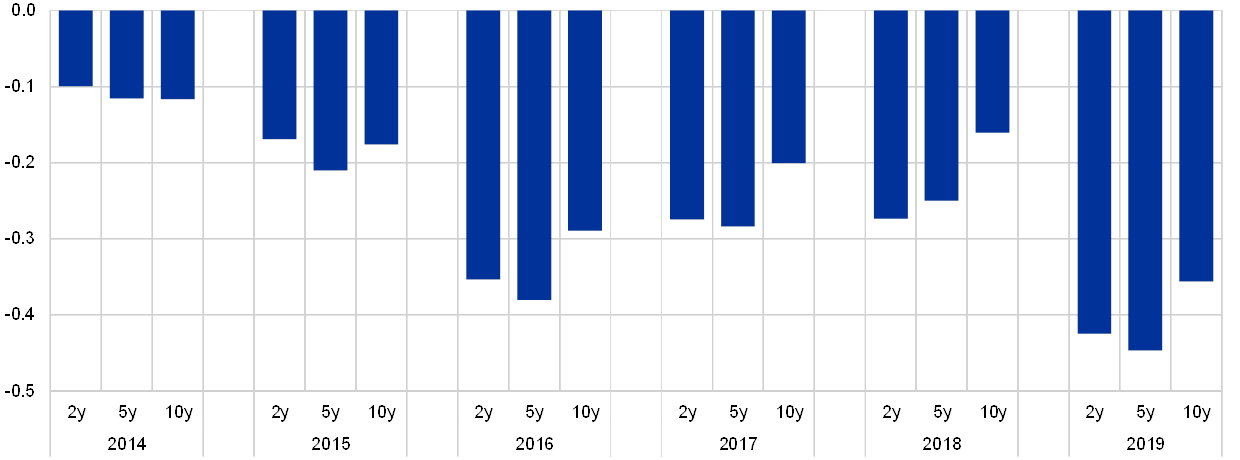
Source: Updated figures for Rostagno, M. et al. op. cit.
Note: The chart illustrates the impact of NIRP on sovereign yields (weighted average of German, French, Italian and Spanish sovereign bond yields), which works primarily via the short-term rate and the OIS forward curve.
One of the reasons for the different “footprints” of policy innovations is that yield-seeking investors may be more strongly incentivised to climb up the maturity ladder if shorter-term assets are pushed into more negative yields. Rate cuts to below zero and the ensuing ECB communications have typically been understood by investors as indicating an extended scope for rate cuts in the future. Market participants’ perceived distribution of future policy rates thus extends further into negative territory, which decreases rate expectations and thereby compresses long-term rates.[12]
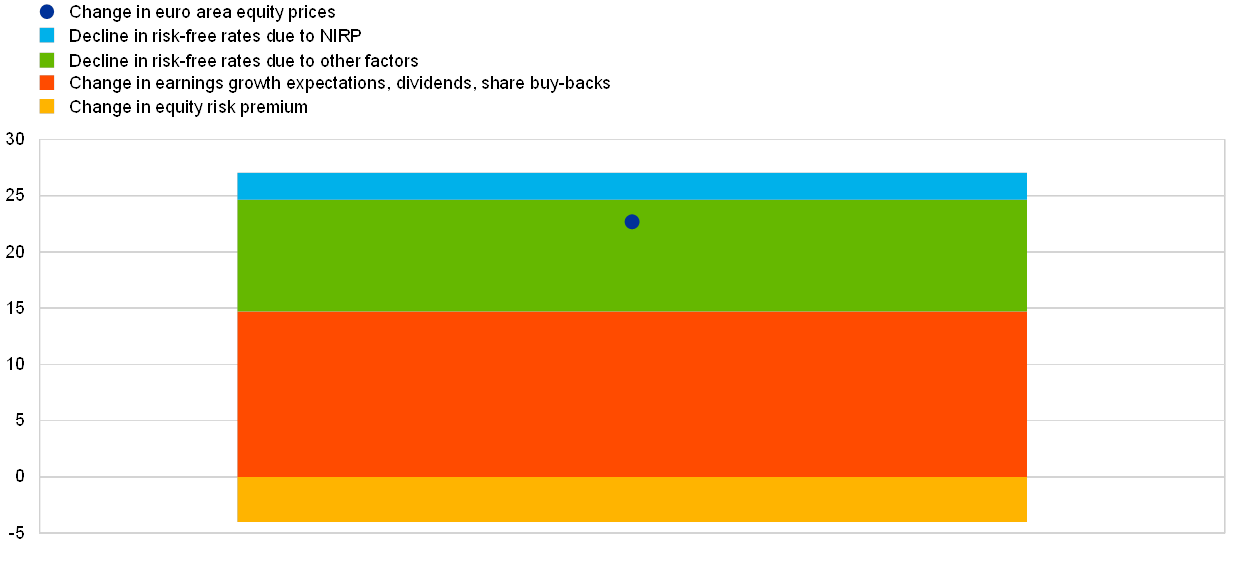
The NIRP-induced decrease in risk-free rates had a direct effect on risky asset prices, leading – all else being equal – to increases in stock prices and decreases in corporate and sovereign bond yields. Employing a dividend discount model to dissect the drivers of stock price changes between early June 2014 and the end of 2019 suggests that roughly half of the total increase in stock prices was due to decreases in the risk-free component of the discount rate (see Chart B).[13] The impact of NIRP – identified via the yield curve analysis described above – is estimated to account for somewhat more than one-fifth of this, i.e. contributing around 3 percentage points to the overall stock price increase. This figure is probably a lower bound for the overall contribution of NIRP to stock price changes, as the stimulating effect of this policy measure on the economy (see Section 4) is likely to have raised earnings expectations and might have decreased the equity risk premium via confidence effects. At the same time, in the period from June 2014 to the end of 2019, the equity risk premium increased overall, constituting a drag on equity prices. Thus, even if NIRP itself has had a positive effect on equity premia, equity valuations relative to those of risk-free rates do not appear to be more stretched compared to their pre-NIRP levels.
Chart B
Decomposition of the change in euro area equity prices from June 2014 to the end of 2019
(percentages, cumulative changes since June 2014)
Sources: Bloomberg, Thomson Reuters, IBES, Consensus Economics and ECB calculations.
Notes: The decomposition is based on a dividend discount model. The model includes share buy-backs, discounts future cash flows with interest rates of appropriate maturity, and includes five expected dividend growth horizons. Each slice of the bar denotes the contribution of the respective factor to the overall change in stock prices. Due to approximation errors, the changes displayed in the chart do not precisely add up to the total change in euro area equity prices over the period. For more details, see Economic Bulletin, Issue 4, ECB, 2018. Latest observation: December 2019.
Similarly, all else being equal, NIRP induced a decrease in the risk-free component of corporate and sovereign bond yields. In addition, an improved macroeconomic outlook and risk perceptions may have compressed yields further via lowered spreads and risk premia.
Overall, alongside other monetary policy measures, negative rates have contributed to alleviating the cost of market-based financing in the euro area since mid-2014. Importantly, they have helped lower risk-free rates across the maturity spectrum, thereby facilitating a pass-through to a wide spectrum of corporate and household financing, ranging from corporate bank loan rates (being typically of shorter maturity) to mortgage lending rates and corporate bond yields (traditionally issued at longer maturity and duration).
3 Impact on bank profitability and risk-taking
Euro area bank profitability has gradually recovered from the significant decline that followed the crisis, but remains low by historical standards (see Chart 4). Bank profitability showed an upward trend in the run-up to the financial crisis, followed by a decline, which was largely driven by a sharp increase in loan loss provisions. Since 2012, bank profitability has gradually recovered, as loan loss provisions have decreased and net interest income has remained broadly stable. Nevertheless, the return on equity stood at around 6% in the third quarter of 2019, which is below most estimates of the cost of equity – for example, the majority of banks participating in the European Banking Authority’s Risk Assessment Questionnaire report an estimated cost of equity of between 8% and 10%.[14] Beyond the cyclical environment, structural challenges afflicting the euro area banking sector played a significant role in depressing the overall level of bank profitability.[15] Low profits limit the scope for organic recapitalisation of banks through retained earnings, which is necessary to build and retain the capacity to intermediate and provide credit to firms and households. At the same time, market valuations of bank equities are low, also compared to non-financial or other financial firms. This, in turn, can inhibit banks from tapping markets to raise capital, as doing so when valuations are low would heavily dilute the holdings of current shareholders.
Chart 4
Evolution of profitability and its main components
(percentages of total assets)
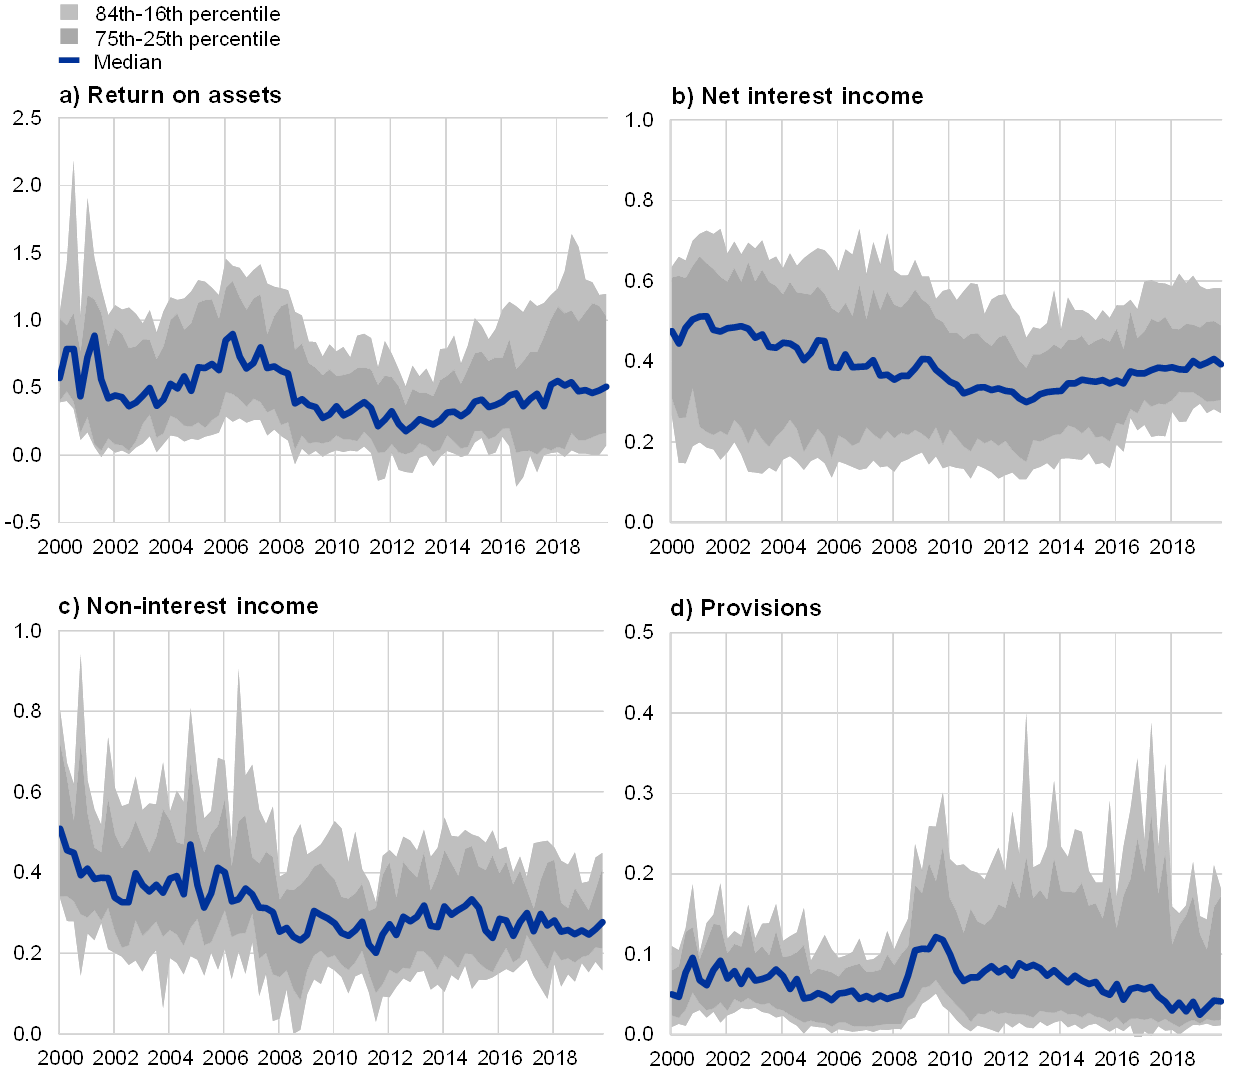
Sources: Bankscope, SNL, Bloomberg and Capital IQ.
Notes: The chart illustrates developments over time in the main components of bank profitability as a percentage of total assets (y-axes) and their cross-sectional dispersion for a sample of 288 banks. The solid blue line represents the median for the cross-section of banks for each quarter. Similarly, the shaded areas indicate the interquartile range (dark grey) and the standard deviation (light grey) of the cross-sectional distribution of banks. Latest observation: December 2019.
Negative interest rates have both adverse and beneficial effects on bank profitability, and the net effect is ultimately an empirical question. In addition to the constraints on lowering retail deposit rates below zero, NIRP leads to a more significant reduction in rates at the longer end of the term structure than a conventional policy rate cut (see Box 1). Since banks typically engage in maturity transformation, obtaining funding at shorter maturities and durations than those at which they lend, this contributes to an additional squeeze on net interest margins compared to a rate cut in a positive interest rate environment. However, there are also channels through which NIRP supports bank profits, in particular through its impact on asset valuations and, more importantly, on the macroeconomy.[16] The positive impact of the policy on macroeconomic conditions leads to higher intermediation volumes, supporting net interest income. Moreover, the improved economic outlook and the lower level of interest rates boost borrower creditworthiness, reducing costs stemming from loan loss provisions. At the same time, decreases in yields driven by NIRP are reflected in an increase in the value of the securities held by banks, thereby leading to (temporary) capital gains for banks.
The main component of bank profitability, net interest income, has so far remained rather resilient, as larger intermediation volumes have offset the lower margins. Chart 5 shows that the decrease in income on loans and securities has been offset by lower interest expenses on deposits and debt securities issued, based on actual developments in interest rates and volumes. In the chart, these movements are represented by the red circles. The developments are further decomposed into price and quantity effects (yellow and blue bars). These show that the negative impact of lower interest rates on the income from loans has been partly offset by higher intermediation volumes. The negative quantity effect on debt securities reflects banks’ portfolio rebalancing towards loans. Analogously, on the liability side, the liquidity injected by the APP led to an increase in deposits by the money holding sector, thereby increasing the relevance of this funding source for banks. At the same time, lower interest rates on deposits and debt securities issued supported net interest income.
Chart 5
Changes in net interest income between 2014 and the third quarter of 2019
(percentages of total assets)
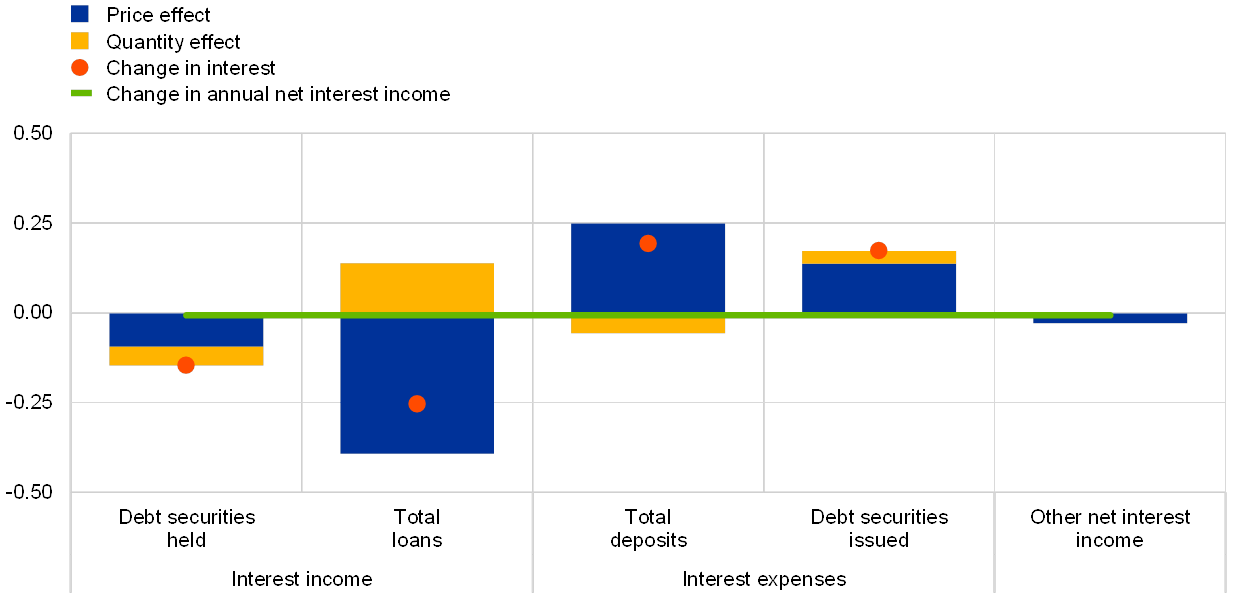
Sources: ECB and ECB calculations.
Notes: The sample is balanced (covering 194 euro area banks) and adjusted for major mergers and acquisitions. Interest expenses are inverted, so decreases in costs are shown as positive contributions to profits.
To comprehensively assess the impact of NIRP on bank profitability, it is crucial to look at components beyond net interest income and to take into account the impact of the policy on the broader economy. As discussed above, one would expect, all else being equal, that lower and, in particular, negative interest rates would lead to a decline in banks’ net interest margins, and indeed several empirical studies highlight this relationship.[17] However, the overall impact on bank profitability depends not only on developments in net interest margins but also on the macroeconomic outlook, which affects credit demand and borrower creditworthiness and therefore intermediation volumes and loan loss provisions. Therefore, a comprehensive assessment of the impact of low or negative interest rates on bank profitability requires consideration not only of developments in interest rates but also of the impact of monetary policy on economic activity.
Negative interest rates have had a broadly neutral impact on bank profitability so far, as their negative effect on net interest income has been offset by a positive effect on borrower creditworthiness. Chart 6 reports the results of a comprehensive assessment of the impact of NIRP on bank profitability. The exercise was conducted by comparing actual developments in the main components of bank profitability in the period during which NIRP has been in place with those under a counterfactual scenario in which NIRP was not implemented. This scenario is obtained from the simulation of a BVAR model under the assumption that the zero lower bound would be enforced at all times, thereby preventing the term structure of interest rates from assuming negative values across all maturities.[18] Under this scenario, higher interest rates would have been reflected in weaker loan growth and lower borrower creditworthiness and therefore in higher loan loss provisions. Actual developments in bank profitability components (red circles) can therefore be decomposed into a part that represents the estimated impact of NIRP (yellow bars) and one which would have been observed under the counterfactual scenario (blue bars). In line with the frictions highlighted above, the estimated impact of NIRP on net interest income is negative.[19] The direct cost of remunerating banks’ holdings of excess liquidity at the negative DFR is shown as a separate component and, overall, is limited. The chart also illustrates the positive impact of negative interest rates on non-interest income. This effect is relatively small and short-lived, as it mainly reflects the impact of decreases in interest rates on the value of the securities held by banks. More importantly, NIRP is estimated to have accounted for a significant share of the observed decline in loan loss provisions. Overall, taking all effects into account, NIRP is estimated to have had a negligible impact on bank profitability up to now.
Chart 6
Changes in bank profitability between 2014 and the third quarter of 2019 and NIRP impact
(percentages of total assets)

Sources: ECB and ECB calculations.
Notes: The sample is balanced (covering 194 euro area banks) and adjusted for major mergers and acquisitions. The NIRP impact is obtained using a dynamic BVAR model.
While some banks are more exposed to the low interest rate environment, so far there is no evidence of an overall negative impact of NIRP on bank profits across bank business models. This conclusion is based on an assessment of the impact of NIRP on bank profitability across bank business models using a dynamic macroeconomic model similar to that described above. The results indicate that, while NIRP has a more negative impact on the net interest margins of retail banks – those relying more on retail deposits – the same banks also benefit more from the improved credit quality and intermediation volumes that are linked to the positive impact of monetary accommodation on the macroeconomic outlook.
Looking ahead, the balance between costs and benefits may evolve if interest rates remain low for a long period of time. The detrimental impact on net interest margins is likely to be more significant as rates remain low for longer.[20] This is because banks are still benefiting from income on fixed-rate loans originated when interest rates were higher, and this income will progressively decrease as legacy loans mature.[21] Moreover, the scope for further savings in provisions and funding costs is limited, in particular for banks whose loan portfolio is concentrated on low-risk borrowers. The cost for banks of holding excess reserves also increased following the cut in the DFR in September 2019 and the increase in excess liquidity driven by the reactivation of the APP, but these effects are mitigated by the introduction of the two-tier system for the remuneration of excess reserves (see also Box 2).
While the compression of intermediation margins can lead to an increase in the riskiness of bank portfolios, so far there is limited evidence that such an increase has been excessive. Banks may be more willing to raise the risk profile of their investments in the aftermath of NIRP in a search for higher yields.[22] Whether this riskiness can be deemed excessive depends on whether it is adequately priced in in the terms and conditions of new loans and, even more importantly, on whether it is factored in in credit standards. Evidence from the euro area bank lending survey (BLS) shows that the easing of margins on riskier loans has been much more contained than that on average loans, and, over the last year, margins on riskier loans have actually been tightening.[23] Moreover, model-based evidence suggests that the increase in the risk profile of portfolios has been adequately reflected in lending rates, although some sectors, like consumer lending, have started to show signs of exuberance.[24] Regulatory pressures and supervisory oversight have played, and continue to play, a crucial role in fostering a balanced coexistence between negative rates and prudent loan pricing practices.[25]
While the broader low interest rate environment can pose financial stability risks, targeted macroprudential action is best placed to address specific fragilities. Excessive debt, overpricing of certain financial assets or exuberance in some local housing markets can be supported by the broader low interest rate environment and may threaten financial stability. For example, the January 2020 BLS has highlighted that, even amid growing concerns about the macroeconomic outlook that have curtailed borrowing by firms, net demand for housing loans is continuing to increase at above the historical average rate.[26] While the overall rate of growth of housing loans in the euro area is not very high compared to past episodes, in some countries it may pose financial stability concerns, as it may generate bubbles in local house prices that may warrant targeted macroprudential action by national authorities.[27] Indeed, the European Systemic Risk Board (ESRB) has recently issued a series of warnings and recommendations on vulnerabilities in the residential real estate sector.[28] Moreover, macroprudential authorities in different jurisdictions have activated a series of measures in the real estate domain, regarding the maturity and loan-to-value ratio of loans and the debt service-to-income ratio of borrowers.
Box 2The transmission of negative interest rates in euro area money markets
Short-term interest rates in euro area money markets play a crucial role in the monetary policy transmission process, by serving as the main reference points for banks when pricing loans to firms and households. Effective monetary policy transmission therefore requires changes in the ECB’s key interest rates to be closely followed by developments in money market rates. Ultimately, the market rates that matter most for the pricing of bank loans vary with unsecured overnight rates, such as the euro overnight index average (EONIA) or the euro short-term rate (€STR).[29]
The supply of central bank reserves available in the banking system determines which of the ECB’s key interest rates anchors short-term rates (see Chart A). This relationship also holds in a negative interest rate environment. If the central bank provides sufficient reserves to just match the demand in the banking system arising from reserve requirements and autonomous factors, market participants tend to price the cost of overnight funding close to the interest rate on the MRO.[30] In an environment of excess liquidity, however, overnight rates are grounded by the DFR. When the ECB began its negative interest rate policy by reducing the DFR to below zero in June 2014, excess liquidity was already elevated compared with pre-crisis levels, at around €200 billion. Consequently, short-term rates hovered between the DFR and the MRO rate. The injection of substantial amounts of excess liquidity from the asset purchase programme pushed interest rates more decisively towards the DFR, most notably since the start of the public sector purchase programme (PSPP) in March 2015.
Chart A
Short-term money market rates and excess liquidity
(left panel: left-hand scale: percentages; right-hand scale: EUR trillions; right panel: basis points)

Sources: ECB and Bloomberg.
Notes: The right panel shows the change in the EONIA on the first day after each rate cut relative to the average EONIA in the five business days before each rate cut. The pre-€STR is used before October 2019. In the left panel, the vertical broken line indicates the introduction of the negative DFR. In the right panel, the horizontal broken line indicates the size of each of the cuts in the DFR (10 basis points). Latest observations: 27 January 2020.
The ECB’s negative interest rate policy has been smoothly transmitted to short-term rates (see Chart A). The EONIA – historically the interbank lending rate for overnight funds in the euro area – is currently hovering around -0.45%, roughly 50 basis points below its level in June 2014.[31] It has thus fully traced the overall reduction in the DFR since the start of the negative interest rate policy. The delay in the pass-through of the initial DFR cuts below zero in June and September 2014 probably reflected operational adjustment costs of market participants in the new negative interest rate environment, as well as frictions in the distribution of excess liquidity across the euro area.[32] In contrast, subsequent reductions in the DFR, which have taken place in an environment of high excess liquidity, have been followed promptly by short-term money market rates.
Chart B
Turnover in selected money market segments
(EUR trillions)

Sources: ECB Euro Money Market Survey (until Q2 2015) and money market statistical reporting (MMSR) (as of Q3 2016).
Note: The vertical broken line indicates when the collection of MMSR data started (Q3 2016). Latest observations: Q4 2019.
The excess liquidity generated by the ECB’s non-standard measures has reduced demand from banks for short-term liquidity in money markets, which in turn has led to some money market benchmark rates falling below the DFR. This reflects the fact that euro area banks have the outside option of placing their excess liquidity in the deposit facility instead of lending it in the market (see Chart B).[33] As a result, unsecured interbank rates (such as, historically, the EONIA) are based on increasingly low trading volumes, but have remained above the DFR. At the same time, the APP has also placed large amounts of liquidity in the hands of non-banks and banks located outside the euro area, which do not have access to the ECB’s deposit facility. These market participants need to resort to euro area money markets for liquidity storage purposes. Important benchmark rates reflecting such a broader spectrum of market participants – such as the €STR – are therefore largely dominated by the deposit-taking of euro area banks. These benchmark rates have declined to below the DFR, as banks with abundant reserves charge a spread to accept additional deposits. For similar reasons, certain repurchase agreement (repo) rates are also hovering below the DFR. While general collateral repo rates reflecting cash funding costs have remained relatively tightly linked to the level of the DFR, repo rates for specific collateral have occasionally dropped significantly lower, reflecting market participants’ search for specific bonds.[34]
Chart C
Reaction of banks’ secured borrowing volumes and rates to the introduction of the two-tier system for excess reserve remuneration
(left panel: percentages; right panel: basis points)
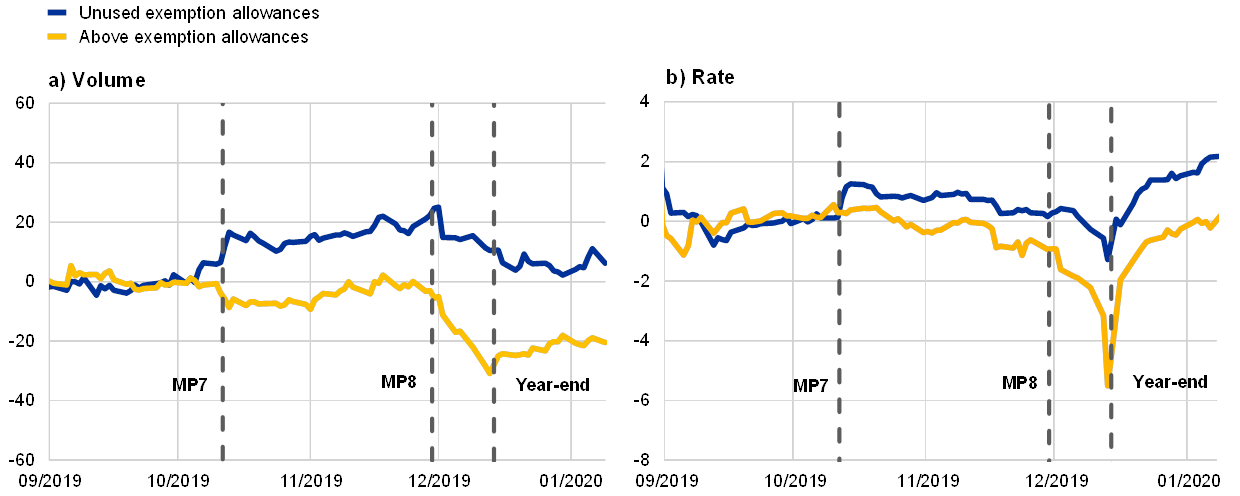
Source: ECB.
Notes: MP7 and MP8 stand for the seventh and eighth reserve maintenance periods of 2019. The chart plots the stock of outstanding secured borrowing volumes and the volume-weighted average borrowing rate of those MMSR reporting agents which trade on a regular basis in the secured market, distinguishing between reporting agents with less excess liquidity holdings during the sixth reserve maintenance period (MP6) than their exemption allowance (i.e. six times their minimum reserve requirement) (blue line) and reporting agents with more excess liquidity holdings than their exemption allowance (yellow line). For each of the two groups, the stock of outstanding volumes is shown as the average percentage deviation from the average during MP6. Rates are expressed in basis point deviations from the average rate in MP6. The vertical broken lines indicate the start of MP7 (with the introduction of the two-tier system), the start of MP8 and the 2019 year-end. Latest observations: 25 January 2020.
In September 2019 the ECB decided to introduce a two-tier system for the remuneration of excess liquidity holdings to support the bank-based transmission of monetary policy. The initial experience with this system suggests that sufficient excess liquidity remains subject to the DFR to ensure a continued effective transmission of negative policy rates in euro area money markets.[35] Under the two-tier system, parts of credit institutions’ excess liquidity holdings with the Eurosystem are currently remunerated at 0% instead of at the DFR. This provides incentives for banks holding less excess liquidity than their exempt allowance to borrow additional reserves at any rate below 0% and deposit them with the central bank at a profit. Banks that had unused allowances before the introduction of the two-tier system have therefore substantially increased their money market borrowing activity in the secured segment (see Chart C, left panel). At the same time, the borrowing activity of banks in the unsecured segment remained limited and mostly confined to specific domestic money markets. Accordingly, while repo rates have experienced limited and temporary upward pressure due to the increased trading activity (see Chart C, right panel), unsecured benchmark rates have remained largely unchanged. The two-tier system has thus partially revived demand for reserves, but money market rates have remained broadly stable and closely anchored to the DFR.[36]
4 Impact on the broader economy
The overall impact of NIRP on loan growth derives from both the funding cost relief granted by the policy rate cut and the non-standard channels activated when rates move into negative territory. As is also the case with standard rate cuts, NIRP exerts an easing effect which operates through the bank lending channel of monetary policy transmission and stems primarily from a reduction in bank funding costs. This first-order effect, however, may differ in magnitude from that of a policy rate cut in positive territory since, as explained above, negative rates give rise to some specific frictions, while also activating additional channels, which can result in a multiplication of the stimulus provided by the monetary policy accommodation, especially as regards loan creation.
The compression in funding costs not related to retail deposits activated a bank lending channel that accounted for an expansion of aggregate corporate loan growth by around 0.4 percentage points. Funding options for banks include not only deposits of households and firms but also debt securities, Eurosystem funding, deposits of other financial institutions and governments, money market funds and external liabilities. Even under the conservative assumption that all deposits of the non-financial private sector, irrespective of their size, are bound at zero, the sum of all these funds still leaves around two-thirds of funding sources that can be remunerated at rates below zero. According to past regularities, this funding cost relief would have stimulated loan growth by around 0.4 percentage points on average, as envisaged under a standard bank lending channel of propagation to the broader economy.[37] It is important to note that this is a conservative estimate, not only because deposit rates actually declined by 0.6 percentage points but also because it abstracts from the compression of risk and term premia.[38]
A review of available empirical studies suggests that non-standard channels support aggregate loan supply, leading to an additional increase in annual corporate loan growth of around 0.3 percentage points (see Chart 7). Negative interest rates exert pressure on the intermediation margins of banks that rely more on retail deposits, leading healthier banks to expand their loan supply or to try and maintain profitability via search-for-yield.[39] Conversely, weaker banks with limited capacity to expand credit supply or increase risk may keep lending rates unchanged or even be forced to increase them. This has been referred to in the economic literature as the “reversal rate”.[40] Other studies focus on the weight of liquid assets in banks’ balance sheets or the self-reported impact of the policy on banks.[41] For each study and each key characteristic, we compute the growth of bank loans to firms that would have emerged if the ECB had not adopted NIRP in 2014. We then order these counterfactuals depending on the resulting loan growth, and report their median (the dashed black line in Chart 7) and their overall range (grey area), spanning values from just above the actual loan growth (blue line) to well below it. In the absence of NIRP, loan growth for banks negatively affected by the policy (related to the income loss implied by the hard bound on retail deposit rates) would have been 0.3 percentage points higher than the observed loan growth. At the same time, loan growth would have been substantially lower for banks whose lending was positively affected by the policy (-0.5 percentage points each year being the median across studies, with estimates as low as -1.6 percentage points at the bottom of the range). Taking into account the whole set of available empirical analyses, the counterfactual loan growth in the absence of NIRP would have been lower by around 0.3 percentage points each year.
Chart 7
Estimated impact of NIRP on bank loans to firms
(percentages per annum)

Sources: Altavilla, C. et al., “Credit supply and demand in unconventional times”, op. cit.; Arce, Ó. et al., op. cit.; Bubeck, J., Maddaloni, A. and Peydró, J.-L., “Negative Monetary Policy Rates and Systemic Banks’ Risk-Taking: Evidence from the Euro Area Securities Register,” Working Papers, No 1128, Barcelona Graduate School of Economics, November 2019; Bottero, M. et al., op. cit.; Demiralp, S. et al., op. cit.; Grandi, P. and Guille, M., op. cit.; Heider, F. et al., op. cit.; and Tan, G., “Beyond the zero lower bound: negative policy rates and bank lending”, DNB Working Paper, No 649, September 2019.
Notes: The blue line is the actual annual NFC loan growth (six-month moving average). The grey area represents the dispersion in loan growth among banks according to their exposure to NIRP-specific effects, corresponding to one standard deviation of the key bank characteristic from the bottom tercile of the distribution as identified by various contributions in the literature (deposit ratio, liquidity ratio, BLS response to NIRP question). The relative response for a standard deviation above (below) the mean is computed as the maximum (minimum) response as gathered from studies in the literature, adapted to take into account the different formulation of the empirical exercises and normalised for each sample’s specificities (period and country). The dashed line represents the median across all studies.
Overall, empirical evidence points to a positive impact of NIRP on loan growth (of around 0.7 percentage points each year), an assessment which is corroborated by survey evidence from the euro area BLS (see Chart 8). A consistently positive net percentage of euro area banks have been reporting that the negative DFR led to higher loan volumes (panel a). On average, 10% of banks in net percentage terms reported that the negative DFR led to an increase in loan volumes to enterprises, while the share was 15% for loans to households for house purchases.[42] Consistent with the expansion in credit supply, the decrease in lending rates was even more widespread, with around 40% of banks reporting a compression of lending rates in net terms for both enterprises and households for house purchases.
Chart 8
Impact of negative DFR on lending conditions as reported by banks in the BLS
(net percentages reporting a positive impact)
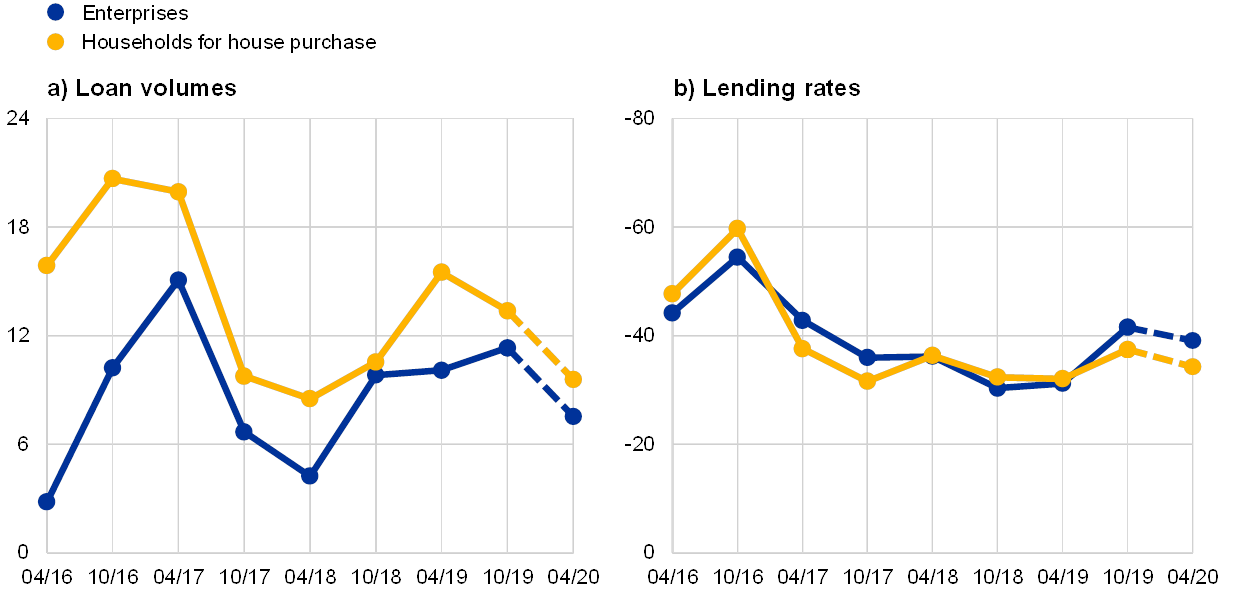
Source: ECB (euro area BLS).
Notes: Responses refer to the questions on the impact of the negative DFR on lending volumes (panel a) and lending rates (panel b) over the six months ending at the date on the x-axis. Observations for April 2020 correspond to the expected impact over the six months ending in April 2020. The net percentage is the percentage of banks reporting a positive impact minus the percentage of banks reporting a negative impact. Figures at the country level are weighted by volume of loans to obtain aggregate figures for the euro area. Latest observation: October 2019.
Negative rates, in conjunction with the other policy measures, have contributed to the euro area expansion and supported inflation expectations. According to estimates carried out by Eurosystem staff, at the end of 2019 the level of real GDP was between 2.5 and 3.0 percentage points higher than it would have been in the absence of the unconventional measures that the ECB has taken since the middle of 2014. The policy contribution to the euro area inflation rate is estimated to have been on average between one-third and one-half of a percentage point per year until 2019. Identifying the contribution of each individual instrument is difficult because of the interaction among these policy tools (a feature that has often prompted the ECB to combine them in a policy package). However, one tentative way to isolate the contribution of NIRP is to run its estimated yield impact, as documented in Box 1, through macroeconomic models. These estimates suggest that around one-sixth of the overall cumulated impact on GDP growth is attributable to NIRP as a stand-alone instrument. This represents a tangible contribution, considering the overall limited rate adjustments in negative territory.[43] NIRP is found to explain a similar share of the overall policy effect on inflation. As acknowledged above, these estimates provide a conservative assessment of the contribution of NIRP, which is reinforced by its complementarity with other monetary policy tools.
There are reasons to believe that the impact on the broader economy goes beyond the transmission via bank lending. Additional channels emerge or are strengthened as the policy rate moves deeper into negative territory. One example is the effect of NIRP on the remuneration of liquid assets in which the corporate sector usually invests. NIRP compresses the remuneration of liquid assets, and is passed on to corporate deposits as policy rates move deeper into negative territory and expectations of a future rate hike move further into the future. Using information from more than 300 banks and 3 million firms operating in 19 euro area countries, Chart 9 shows different patterns in the non-financial investment of firms exposed to negative deposit rates, distinguishing them according to their holdings of liquid assets.[44] Firms with large holdings of liquid assets subject to negative deposit rates have an incentive to reduce these liquid assets by increasing non-financial investment (yellow line). By contrast, firms that have low liquid asset holdings and are therefore not particularly affected by negative deposit rates did not show such an acceleration (blue line). Formal econometric analysis of this corporate channel suggests that it is capable of adding 1 percentage point to aggregate business investment. In line with this empirical finding, a private sector survey of 500 German firms conducted in July-August 2019 found that, in the face of negative deposit rates, 32% of firms invested more in their own business.[45]
Chart 9
Investment growth of firms exposed to negative deposit rates
(index: 2014=1)
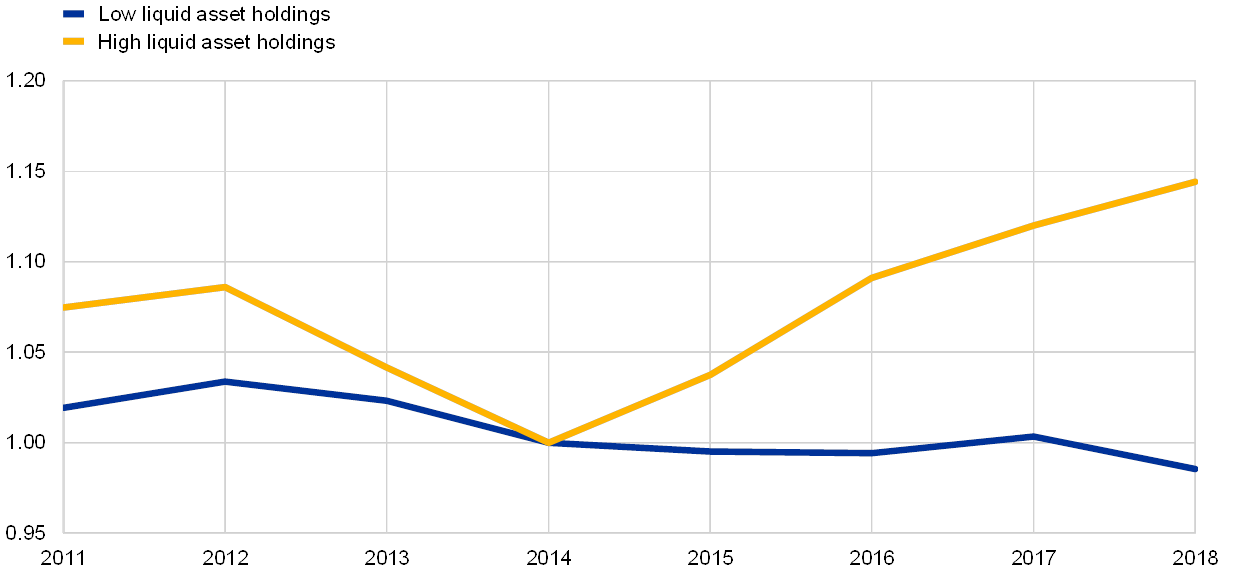
Source: Altavilla, C., Burlon, L., Giannetti, M. and Holton, S., “The impact of negative interest rates on banks and firms”, Vox column, CEPR Policy Portal, 8 November 2019.
Notes: Investment growth orthogonal to firm fixed effects and normalised to 1 in 2014. Latest observation: 2018.
5 Concluding remarks
The stimulus to the broader economy provided by NIRP has been effective in inducing an easing of financing conditions and thereby, ultimately, contributing to price stability. The interest rate cut has been channelled through both standard and non-standard transmission mechanisms, generating a reduction in bank funding costs and spurring loan creation. Effects were heterogeneous across bank characteristics. However, the dispersion in some bank responses does not challenge the overall positive first-order effect of NIRP on financing conditions. Notwithstanding the potential headwinds to transmission discussed above, as yet there is no sign that the stimulus provided by the measure has been exhausted, as new channels emerge while others fade away. Ultimately, the macroeconomic response has been sizeable and has helped to bring inflation closer to the ECB’s aim.
Protracted periods of negative rates do, however, have the potential to hinder the transmission of monetary policy. Prolonged periods of negative rates are qualitatively different from brief, “experimental” periods. If negative policy rates had proved to be short-lived, they might have become a mere footnote in central banking history. As negative rates persist, however, banks react to them to avoid the negative effects on profitability, although their leeway to do so is eroded over time. In the current euro area monetary policy environment, the effects of a long period of negative rates require continuous and careful monitoring as we venture further into uncharted territory.
Overall, NIRP still largely benefits the macroeconomic outlook and price stability. In order to support the bank-based transmission of monetary policy, the ECB has adopted a two-tier system for reserve remuneration. In parallel, specific risks to financial stability are addressed by action from other policy areas, which are specifically mandated to tackle phenomena and behaviours associated with such risks. Microprudential supervision monitors banks’ risk-taking behaviour, and so far it has provided an adequate set of incentives for intermediaries to calibrate their risk attitude to the macroeconomic circumstances. Moreover, national and supranational macroprudential authorities can effectively monitor and respond to localised house price bubbles and other threats to financial stability. Such mitigating action allows the euro area economy to continue to benefit from the significant and necessary stimulative impact of NIRP, which has proven to be an integral and effective part of the ECB’s policy response to past and current challenges.
- Data support provided by Maria Dimou and Michele Federle. The authors gratefully acknowledge input from Giacomo Carboni, Matteo Falagiarda, Florian Heider and Glenn Schepens, as well as comments and suggestions from Ugo Albertazzi and Csaba Móré.
- A comprehensive discussion on the role and effectiveness of non-standard measures, including NIRP, and the various channels through which they are transmitted to financial conditions and ultimately affect the real economy can be found in Rostagno, M., Altavilla, C., Carboni, C., Lemke, W., Motto, R., Saint-Guilhem, A. and Yiangou, J., “A tale of two decades: the ECB’s monetary policy at 20”, Working Paper Series, No 2346, ECB, December 2019.
- The banking system as a whole cannot reduce excess liquidity by expanding credit or acquiring securities, as such transactions merely shift liquidity from one bank to another within the closed system in which it can circulate. Nevertheless, individual banks can engineer a reduction in their own excess liquidity position in this way.
- See Demiralp, S., Eisenschmidt, J. and Vlassopoulos, T., “Negative interest rates, excess liquidity and retail deposits: banks’ reaction to unconventional monetary policy in the euro area”, Working Paper Series, No 2283, ECB, May 2019; and Bottero, M., Minoiu, C., Peydró, J.-L., Polo, A., Presbitero, A.F. and Sette, E., “Negative Monetary Policy Rates and Portfolio Rebalancing: Evidence from Credit Register Data”, IMF Working Papers, No 19/44, February 2019.
- More generally, there may also be incentives for non-banks to embark on excessive risk-taking. For example, several investment and pension funds are committed to paying out at least the nominal amount of initial contributions. NIRP reduces the return that can be obtained for a certain level of risk, forcing these intermediaries either to accept lower profitability or to invest in riskier assets in search of higher returns.
- Altavilla, C., Burlon, L., Giannetti, M. and Holton, S., “Is there a zero lower bound? The effects of negative policy rates on banks and firms”, Working Paper Series, No 2289, ECB, June 2019.
- For example, although for rational agents the reference rate should be the real rate, there is some uncertainty around its level, as it depends on inflation expectations. However, a negative nominal rate is not only more transparent but also a certain loss.
- The reaction of the short-term swap rate is slightly stronger than the move in the policy rate because the gap between the EONIA and the DFR was somewhat larger in mid-2014 than it is now.
- For a review of the influence by policy and non-policy factors on the euro area yield curve, see, for example, Lane, P.R., “The yield curve and monetary policy”, public lecture for the Centre for Finance and the Department of Economics at University College London, London, 25 November 2019. For an assessment of the impact of the asset purchase programme (APP) on euro area term premia, see, for example, the article entitled “Taking stock of the Eurosystem’s asset purchase programme after the end of net asset purchases”, Economic Bulletin, Issue 2, ECB, 2019.
- For details of this approach, see Rostagno, M. et al., op. cit.
- See, for example, Chart 6 in Lane, P.R., “The monetary policy toolbox: evidence from the euro area”, keynote speech at the 2020 US Monetary Policy Forum, 21 February 2020.
- See Lane, P.R., “The yield curve and monetary policy”, op. cit., and the references given therein.
- For more details, see the article entitled “Measuring and interpreting the cost of equity in the euro area”, Economic Bulletin, Issue 4, ECB, 2018.
- See “Risk Assessment Questionnaire – Summary of the Results”, European Banking Authority, Autumn 2019.
- These include poor cost-efficiency, overcapacity, strong competition and insufficient income diversification. See, for example, Andersson, M., Kok, C., Mirza, H., Móré, C. and Mosthaf, J., “How can euro area banks reach sustainable profitability in the future?”, Financial Stability Review, ECB, November 2018.
- Altavilla, C., Boucinha, M. and Peydró, J.-L., “Monetary policy and bank profitability in a low interest rate environment”, Economic Policy, Volume 33, Issue 96, 2018, pp. 531-586.
- See, for example, Alessandri, P. and Nelson, B.D., “Simple Banking: Profitability and the Yield Curve”, Journal of Money, Credit and Banking, Vol. 47(1), 2015, pp. 143-175; and Borio C., Gambacorta, L. and Hofmann, B., “The influence of monetary policy on bank profitability”, International Finance, Vol. 20(1), 2017, pp. 48-63.
- The model includes information on return on assets, net interest income, non-interest income, loan loss provisions, lending rates to NFCs, loan volumes to NFCs, real GDP, HICP inflation and interest rates with a remaining maturity of one day, five years and ten years over the period from the first quarter of 1999 to the second quarter of 2019. For technical details of the model, see Altavilla, C. et al., “Monetary policy and bank profitability in a low interest rate environment”, op. cit. As in Rostagno, M. et al., op. cit., the analysis is based on a conditional forecast for a counterfactual scenario with no NIRP under the assumption that the zero lower bound would be enforced at all times, thereby preventing the term structure from assuming negative values across all maturities.
- The blue bar is positive for net interest income, implying that the offsetting factors have up to now been more significant than expected. This could be due to a shift in banks’ funding structure towards cheaper funding sources or to a portfolio rebalancing towards riskier, and therefore higher-yielding, assets.
- See, for example, Altavilla, C. et al., “Monetary policy and bank profitability in a low interest rate environment”, op. cit.; and Claessens, S., Coleman, N. and Donnelly, M., “‘Low-For-Long’ interest rates and banks’ interest margins and profitability: Cross-country evidence”, Journal of Financial Intermediation, Vol. 35, Part A, 2018, pp. 1-16.
- Chart 1 illustrates the declining trend in loan-to-deposit margins for new loans. Analogously, by granting loans or investing in securities with fixed rates and long maturities in the current environment, banks are locking in low income streams for a long period of time, which could adversely affect their profitability in the future.
- See Heider, F., Saidi, F. and Schepens, G., “Life below zero: Bank lending under negative policy rates”, The Review of Financial Studies, Vol. 32(10), 2019.
- See Burlon, L., Dimou, M., Drahonsky, A. and Köhler-Ulbrich, P., “What does the bank lending survey tell us about credit conditions for euro area firms?”, Economic Bulletin, Issue 8, ECB, 2019.
- See Albertazzi U., Altavilla C. and Boucinha M., “Assessing the excessiveness of banks’ risk-taking”, in Albertazzi, U., Barbiero, F., Marques-Ibanez, D., Popov, A., Rodriguez D’Acri, C. and Vlassopoulos, T., “Monetary policy and bank stability: the analytical toolbox reviewed”, Working Paper Series, No 2377, ECB, February 2020.
- See Altavilla, C., Boucinha, M., Peydró, J.-L. and Smets, F., “Banking supervision, monetary policy and risk-taking: big data evidence from 15 credit registers”, Working Paper Series, No 2349, ECB, January 2020.
- See “The euro area bank lending survey – Fourth quarter of 2019”, ECB, January 2020.
- See Burlon, L., Gerali, A., Notarpietro, A. and Pisani, M., “Non-standard monetary policy, asset prices and macroprudential policy in a monetary union”, Journal of International Money and Finance, Vol. 88, 2018, pp. 25-53.
- See “ESRB issues five warnings and six recommendations on medium-term residential real estate sector vulnerabilities”, press release, ESRB, 23 September 2019.
- The euro interbank offered rate (EURIBOR) and interest rate swap rates are the most commonly used reference rates in the euro area for pricing bank loans to NFCs and households. These reference rates depend on expectations regarding unsecured overnight rates, such as the EONIA or the €STR, and therefore, ultimately, vary with such rates.
- See, among others, Poole, W. (1968), “Commercial bank reserve management in a stochastic model: implications for monetary policy”, Journal of Finance, 23, 769-791.; Whitesell, W. (2006), “Interest rate corridors and reserves,” Journal of Monetary Economics, 53(6), 1177–1195; and Bindseil, U. (2014), “Monetary Policy Operations and the Financial System”, Oxford University Press.
- The EONIA was traditionally calculated as a weighted average of the interest rates on overnight unsecured lending between banks. However, this calculation method does not comply with the EU Benchmarks Regulation (Regulation (EU) 2016/1011) and cannot be used for new contracts after 1 January 2020. Therefore, since 2 October 2019, the EONIA has been determined as the €STR plus a fixed spread of 8.5 basis points.
- See Demiralp, S. et al., op. cit.
- The drop in demand has been driven by post-crisis regulations, which have increased the regulatory cost of unsecured trading activity, possibly exacerbated by residual market fragmentation along national borders.
- Repo trades can be cash-driven (initiated to borrow cash in exchange for collateral) or security-driven (initiated to temporarily “borrow” specific securities that are offered as collateral in exchange for lending cash). As market participants search for specific collateral, some issuer-specific and even broad general collateral baskets have traded below the DFR. In a reaction to these developments, the Eurosystem enhanced its securities lending facility by accepting cash collateral from December 2016, mitigating some of the pressure on euro area repo markets.
- In September 2019 the Governing Council decided to introduce a two-tier reserve remuneration system to support the bank-based transmission of monetary policy. The system has been implemented since 30 October 2019.
- See also the box entitled “Market reaction to the two-tier system”, Economic Bulletin, Issue 8, ECB, 2019.
- Albertazzi, U., Nobili, A. and Signoretti, F., “The bank lending channel of conventional and unconventional monetary policy”, forthcoming, and Basten, C., and Mariathasan, M., “How Banks Respond to Negative Interest Rates: Evidence from the Swiss Exemption Threshold”, CESifo Working Paper Series, No 6901, 2018, argue that the bank lending channel remains active even under NIRP, while Borio, C., and Gambacorta, L., “Capital regulation, risk-taking and monetary policy: a missing link in the transmission mechanism?”, BIS Working Papers, No 268, 2017, point out that this channel is less effective in a low interest rate environment.
- At the same time, reliance on retail funding varies considerably across countries and across bank business models.
- See Heider, F. et al., op. cit.; Demiralp, S. et al., op. cit.; and Grandi, P. and Guille, M., “The Upside Down: French Banks, Deposits and Negative Policy Rates”, mimeo, 2020.
- See Brunnermeier, M. and Koby, Y., “The Reversal Interest Rate”, NBER Working Papers, No 25406, December 2018. Eggertsson, G.B., Juelsrud, R.E., Summers, L.H. and Wold, E.G., “Negative Nominal Interest Rates and the Bank Lending Channel”, NBER Working Papers, No 25416, January 2019, find an increase in lending rates for Sweden as a result of a policy rate cut into negative territory, although evidence is mixed, as highlighted in Erikson, H. and Vestin, D., “Pass-through at mildly negative policy rate: The Swedish case”, Vox column, CEPR Policy Portal, 22 January 2019.
- For the relevance of liquid assets, see Bottero, M. et al., op. cit. For the self-reported impact of NIRP, see Altavilla, C., Boucinha, M., Holton, S. and Ongena, S., “Credit supply and demand in unconventional times”, Working Paper Series, No 2202, ECB, November 2018; and Arce, Ó., García-Posada, M., Mayordomo, S. and Ongena, S., “Adapting lending policies when negative interest rates hit banks’ profits”, Working Papers, No 1832, Banco de España, 2018.
- See Altavilla, C., Andreeva, D.C., Boucinha, M. and Holton, S., “Monetary policy, credit institutions and the bank lending channel in the euro area”, Occasional Paper Series, No 222, ECB, May 2019.
- The methodology used here is explained in detail in Rostagno, M. et al., op. cit.
- See Altavilla, C. et al., “The impact of negative interest rates on banks and firms”, op. cit.
- See “Zwischen Sicherheit und Chance: Wie der Mittelstand anlegt”, market study by Commerzbank in cooperation with Forsa, 16 October 2019.