
Global value chain participation and exchange rate pass-through to export and import prices
Global value chain participation and exchange rate pass-through to export and import prices
Published as part of the ECB Economic Bulletin, Issue 5/2019.
Many studies suggest that advanced economies’ import prices have become less sensitive to exchange rate movements over the last few decades. Since exchange rate movements would in this case result in smaller changes in trade prices and quantities, exchange rates would have also become less important in the transmission of domestic and international shocks, which has important implications for monetary policy and the way it is transmitted to the economy. This article suggests that part of the likely decline in exchange rate pass-through to import prices is a result of the rise of global value chains. As production increasingly relies on imported intermediate goods, production costs and hence export prices become more sensitive to exchange rate changes. However, this effect also increasingly offsets the variation in import prices caused by exchange rate changes. Hence the existence of cross-country production linkages may amplify exchange rate pass-through to export prices but thereby dampen exchange rate pass-through to import prices.
1 Introduction
The degree to which exchange rate changes feed through to import prices is commonly referred to as the “exchange rate pass-through” to import prices. Assuming that export prices are rigid or even fixed in the exporter’s currency, a depreciation of the importer’s currency implies that import prices in that currency increase. However, the amount by which import prices in local currency change in response to a given change in the exchange rate may vary. The extent to which they react is the degree of exchange rate pass-through to import prices. Understanding and assessing this pass-through is essential for monitoring and forecasting domestic inflation, and hence for the calibration of monetary policy.
A salient feature of advanced economies during the last few decades has been a likely decline in exchange rate pass-through to import prices.[1] A wide range of estimates suggest that the sensitivity of many advanced economies’ import prices to changes in their nominal effective exchange rates has decreased since the late 1990s.
Another striking feature of the global economy during the last few decades has been the rise of global value chains. The increasing dispersion of stages of production was spurred by a number of factors. The decline in costs of transportation and logistics allowed firms to take advantage of large wage differences between advanced and emerging market economies through the internationalisation of supply chains. Advances in information and communication technologies in turn made the complex coordination of production processes at distance possible.[2] Moreover, the adoption of trade-liberalising policies over the past few decades created an environment conducive to the creation of globalised production chains.
The fragmentation of production chains across borders has been accompanied by an increase in the cross-border flow of intermediate goods. The regional dispersion of the research and development underlying the iPod, the manufacturing of its components, their assembly, as well as the sale and distribution of the iPod in local markets is a well-known example of production chain fragmentation;[3] another example is the role of Germany as the regional hub in “Factory Europe”. A consequence of fragmenting production chains internationally is a continuous rise – at least until the eruption of the global financial crisis – in the share of trade accounted for by intermediate goods relative to that of final goods. Trade in intermediate goods and services now accounts for a very large share of overall trade flows in goods and services.[4]
Global value chains may have a wide range of economic effects. Several studies have explored the effects of global value chains by looking at the increased fragmentation of production across borders. Drawing on newly developed input-output tables, a series of studies have developed frameworks to measure trade in valued added and an economy's and individual sectors’ integration in global value chains.[5] Building on these insights, other studies have looked at the economic implications of global value chains. For example, participation in global value chains appears to boost growth,[6] amplify cross-country monetary policy spillovers,[7] strengthen supply-side interlinkages and thus increase inflation correlations,[8] render an economy's income distribution more uneven and raise current account surpluses (or lower current account deficits).[9]
This article examines the role of global value chain participation in exchange rate pass-through to import and export prices.[10] The mechanism posited has two components. First, the exchange rate pass-through to the export prices of an economy’s trading partners is strengthened by their increased use of intermediates imported from that economy (i.e. their increased participation in global value chains). Second, the greater pass-through to its trading partners’ export prices leads to a weakening of the economy’s exchange rate pass-through to import prices.
The mechanism can best be described by an example in which the world consists of only two economies, namely Home and Foreign. For simplicity, it is assumed that export prices are fixed in the currency of the producer and that firms’ mark-ups are constant. The currency of Home depreciates against the currency of Foreign. If there are no global value chains, production costs in Foreign are not affected by an appreciation of its currency against the currency of Home, as all intermediate inputs used in production are sourced domestically. As a consequence, exchange rate pass-through to export prices in Foreign is zero. In Home, however, the same appreciation of the currency of Foreign implies a one-for-one increase in import prices, i.e. exchange rate pass-through to import prices in Home equals unity. So if the currency of Foreign appreciates by 10% against the currency of Home, export prices in Foreign are unchanged and import prices in Home rise by 10%.
Exchange rate pass-through to export and import prices changes in the presence of global value chains. With value chain integration, exchange rate pass-through to export prices in Foreign is positive rather than zero, and exchange rate pass-through to import prices in Home is less than one. For example, suppose half of the inputs in Foreign production are imported from Home. A 10% appreciation of the currency of Foreign implies a reduction in its production costs by 5%, so it can cut its export prices by 5%. The decline in Foreign’s export prices offsets part of the rise in import prices paid by Home that is implied by the depreciation of its currency against the currency of Foreign. Specifically, because Foreign’s export prices have been cut by 5% following the depreciation of Home’s currency, import prices in Home increase by less than 10%. Most importantly, the reduction in exchange rate pass-through to import prices in Home depends on the degree of Foreign’s value chain participation with Home.[11]
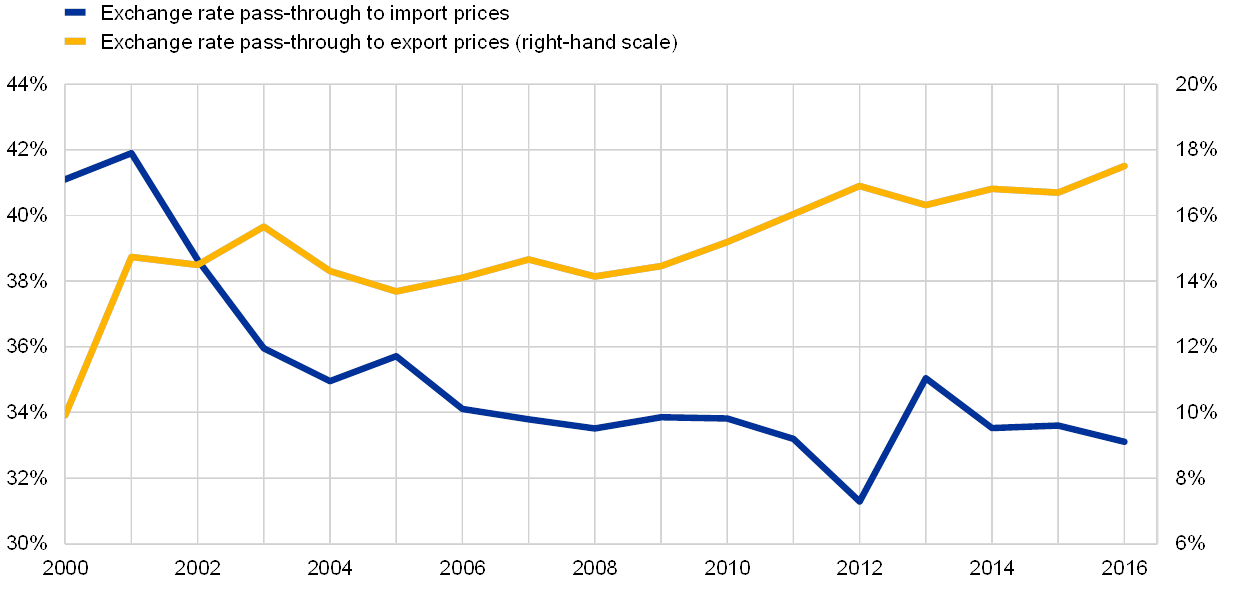
Since 2000, as advanced economies have increased participation in global value chains, the evidence suggests that their exchange rate pass-through has declined for import prices and increased for export prices (see Chart 1). The estimated exchange rate pass-through to import prices for the early 2000s is around 42%, i.e. a 10% nominal effective exchange rate depreciation was followed by an increase in import prices by 4.2% on average across advanced economies. For the late 2000s, the figure is estimated to have fallen to around 30%. Global value chain participation of advanced economies rose in the same period, with the ratio of domestic value added to gross exports – the VAX ratio – falling from 83% to 78%. A smaller VAX ratio indicates that a larger share of the value added embedded in an economy’s gross exports was created using imports rather than domestically produced intermediates.[12]
Chart 1
Developments in exchange rate pass-through to export and import prices and global value chain participation of advanced economies
(left-hand scale: elasticity; right-hand scale: ratio, inverted scale)

Source: ECB calculations.
Notes: Cross-country unweighted averages of both estimated exchange rate pass-through to export and import prices and the VAX ratio. The VAX ratio represents the ratio of an economy’s domestic value added to gross exports. The countries included are Australia, Austria, Belgium, Canada, Denmark, Finland, France, Germany, Greece, Ireland, Italy, Japan, the Netherlands, Norway, Portugal, Spain, Sweden, Switzerland, the United States and the United Kingdom.
The article presents empirical evidence, consistent with the mechanism described above, that changes in exchange rate pass-through to export and import prices are in part due to an increase in global value chain participation. In particular, the evidence suggests that economies which have participated increasingly in global value chains have exhibited rising exchange rate pass-through to export prices; in turn, economies whose trading partners have become increasingly integrated in value chains with them have exhibited falling exchange rate pass-through to import prices.
The finding that global value chain participation may reduce economies’ exchange rate pass-through to import prices has important implications for the conduct and transmission of monetary policy. In particular, when exchange rate pass-through to import prices is low, an exchange rate depreciation may lead to only very limited expenditure-switching effects under which exports would rise and imports would fall.[13] Moreover, the associated pressures on import prices, and hence consumer prices, would be minor. Overall, in a low import price pass-through environment exchange rate movements are accompanied by smaller changes in import prices and quantities, reducing the role played by the exchange rate channel in transmitting domestic and international shocks.
The article is structured as follows: Section 2 reviews the evolution of exchange rate pass-through to import and export prices as well as global value chain participation over the last few decades for advanced economies. Section 3 discusses the mechanism through which global value chain participation may affect economies’ exchange rate pass-through to export and import prices. Section 4 reports results from an analysis of cross-country data that sheds light on the relevance of participation in global value chains for exchange rate pass-through to export and import prices. Section 5 concludes.
2 The evolution of exchange rate pass-through to export and import prices and participation in global value chains
2.1 Exchange rate pass-through to export and import prices
Exchange rate pass-through to export and import prices is estimated to vary considerably across countries. When estimated in a single regression over the full sample period, without accounting for possible time-variation by means of rolling window regressions, exchange rate pass-through to export and import prices exhibits considerable cross-country differences (see Box 1 and Chart 2). For example, while changes in the nominal effective exchange rate are estimated to have translated into a change in export prices equivalent to almost 70% of the exchange rate change within the same quarter in Denmark, export prices in Norway are estimated to have hardly changed. Similarly, while Denmark’s import prices are estimated to have reflected 65% of changes in the nominal effective exchange rate, the figure for Japan is less than 10%.[14]
Box 1 Estimating exchange rate pass-through to export and import prices
In the empirical literature exchange rate pass-through is estimated as the impact of exchange rate changes on import and export prices, controlling for other factors that may affect trade prices, such as exporters’ production costs or local demand.[15] Accordingly, in this article exchange rate pass-through to export prices is estimated on the basis of country-specific rolling-window regressions[16]
(1)
where denotes the quarter-on-quarter log change of the export price unit value of economy i at time t, is the quarter-on-quarter log change of economy i's nominal effective exchange rate, is the quarter-on-quarter log change of the producer price index of economy i, and is the quarter-on-quarter log change of the (trade-weighted) average of trading partners' GDP. Analogously, exchange rate pass-through to import prices is estimated on the basis of the country-specific rolling-window regressions
(2)
where is the quarter-on-quarter log change of the import price unit value of economy i at time t, is the quarter-on-quarter log change of the (trade-weighted) average of trading partners' export prices as a proxy for their production costs, and is the quarter-on-quarter log change of GDP of economy i. Equations (1) and (2) are estimated on rolling windows = 1, 2,…, Τ for 20 advanced economies[17] for the period from 1991 to 2014 to obtain a sample of time-varying, country-specific estimates of exchange rate pass-through to export and import prices. Each rolling window spans a period of ten years. The first window is from 1991 to 2000, and the last window from 2005 to 2014. The interest centres on short-term – i.e. within one quarter – exchange rate pass-through to export and import prices, and hence the exchange rate is included only as the contemporaneous logarithmic first difference.[18] The estimated exchange rate pass-through to export and import prices for economy i and rolling window are given by the point estimates of for export and for import prices. The exchange rate is defined in terms of domestic currency per unit of foreign currency, so that an increase in the exchange rate represents a depreciation of the domestic currency. Thus, positive values of the estimates of and represent positive exchange rate pass-through to export and import prices, respectively.[19]
Chart 2
Estimates of short-term (one-quarter) exchange rate pass-through to exports and imports across advanced economies
(percentages)

Source: ECB calculations.
Exchange rate pass-through to export and import prices in advanced economies is estimated to have changed over time. When estimated using country-specific rolling-window regressions, average advanced economy exchange rate pass-through to export prices appears to have increased over time. By contrast, exchange rate pass-through to import prices appears to have fallen (see Chart 3). The latter finding is consistent with evidence found in existing literature.[20]
Chart 3
Average short-term (one-quarter) exchange rate pass-through to export and import prices over time for advanced economies
(percentages)
Source: ECB calculations.
Notes: Cross-country unweighted averages of the estimated exchange rate pass-through to export and import prices. The countries included are Australia, Austria, Belgium, Canada, Denmark, Finland, France, Germany, Greece, Ireland, Italy, Japan, the Netherlands, Norway, Portugal, Spain, Sweden, Switzerland, the United States and the United Kingdom.
2.2 Global value chain participation
Measuring global value chain participation is challenging. One widely-used measure that indicates how much a country is using imports in its production of exports is an economy’s ratio of domestic value added to gross exports, the “VAX” ratio. Low values of the VAX ratio indicate that a large share of an economy’s gross exports reflect value added through foreign inputs. The production of the iPod may again serve as an illustrative example. While the iPod is exported from China, the actual value added in China is very limited, consisting mainly of low-skilled assembly services. The major part of the value is sophisticated intermediate inputs produced by firms in the United States, Japan, South Korea and Taiwan.[21] Hence, China has a low ratio of domestic value added to gross exports of the iPod and is, according to this metric, participating to a large degree in the global value chain underlying the iPod. The VAX ratio can be constructed using data from the World Input-Output Database.[22]
Global value chain participation has risen significantly since the 1970s. Historical data on the VAX ratio show that there has been a secular decline in the ratio of domestic value added to gross exports, which reflects a rise in global value chain participation (see Chart 4). An increasingly large share of economies’ gross exports thus represents imported value added, i.e. imported intermediates that are used in the production of exports.
Chart 4
Global value chain participation between 1970 and 2009
(ratio)

Source: Johnson, R. and Noguera, G., “A Portrait of Trade in Value-Added over Four Decades”, The Review of Economics and Statistics, Vol. 99, No 5, 2017, pp. 896-911.
Very recently, in the aftermath of the global financial crisis, measures of global value chain participation have pointed to a slowdown in the rise in global value chains.[23] As the levelling off in the expansion of global value chain participation has been geographically widespread, the causes of the slowdown are unlikely to be country or region-specific (see Chart 5). Possible explanations that have been put forward include reductions in the length of firms’ supply chains aimed at improving risk management (for example in response to the 2011 earthquake in Japan), the introduction of local content requirements as well as other regulatory measures, and changes in the composition of demand.[24]
Chart 5
The rise in global value chain participation as reflected in the decline in the VAX ratio
(ratio, inverted scale)

Source: ECB calculations.
Notes: The VAX ratio reflects the ratio of an economy’s domestic value added to gross exports.
3 The impact of participation in global value chains on exchange rate pass-through to export and import prices
The use of imported intermediates in the context of global value chain participation may affect the sensitivity of trading partners’ production costs and export prices to exchange rate changes, and hence exchange rate pass-through to import prices. As explained above, when production in Foreign uses intermediate inputs imported from Home, an appreciation of the currency of Foreign against the currency of Home reduces Foreign’s production costs. This fall in production costs in Foreign may translate into a reduction in export prices. The drop in Foreign’s export prices dampens the rise in Home’s import prices that is caused by the depreciation of its currency. The testable prediction from this line of thought is that economies which participate to a larger extent in value chains with the rest of the world by using imported intermediates should exhibit greater exchange rate pass-through to their export prices, and that economies should exhibit lower exchange rate pass-through to their import prices when the intermediates they produce are used by the rest of the world in its production.
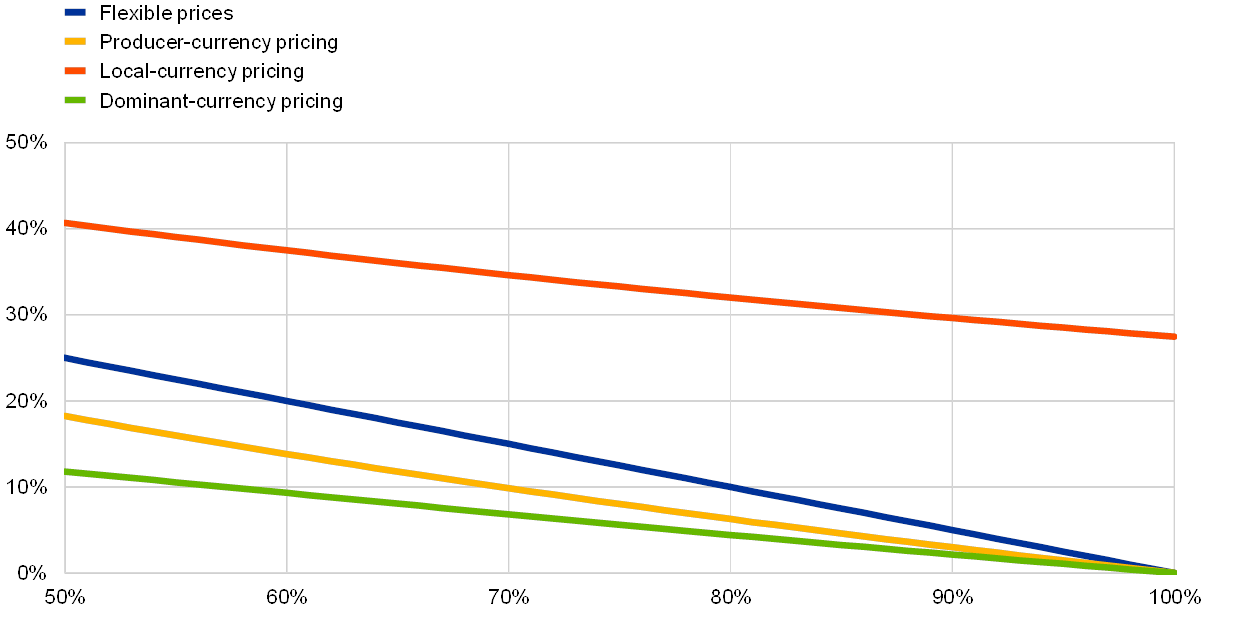
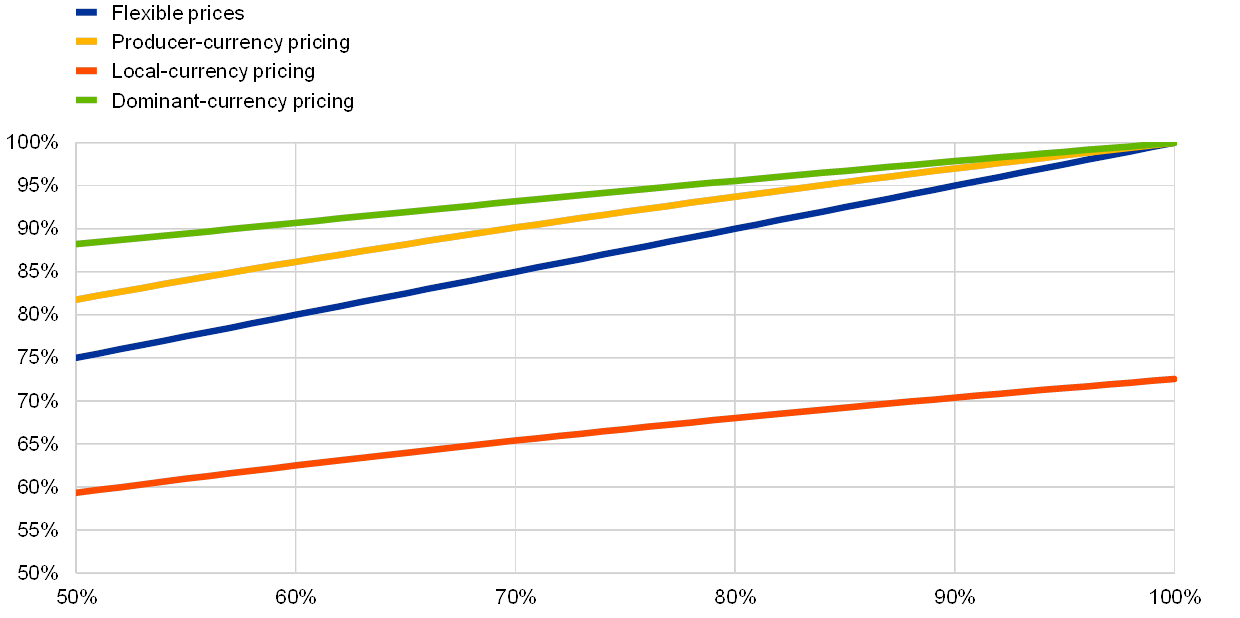
The mechanism through which exchange rate pass-through to import prices is modified by global value chain participation also arises in general equilibrium. A standard structural two-country general equilibrium model with imported intermediates used in production predicts that under producer-currency pricing – i.e. when export prices are sticky in the currency of the producer – Home’s exchange rate pass-through to export prices increases with its global value chain participation, i.e. it increases with a lower Home VAX ratio (see Chart 6).[25] Similarly, the model predicts that Home’s exchange rate pass-through to import prices falls with Foreign’s global value chain participation, i.e. it falls with a lower Foreign VAX ratio (see Chart 7).
Chart 6
Exchange rate pass-through to export prices and global value chain participation (VAX ratio) under alternative assumptions for export pricing
(y-axis: exchange rate pass-through to export prices; x-axis: VAX ratio)
Source: ECB calculations.
Notes: The slope of the relationship between the VAX ratio and exchange rate pass-through to export prices depends on relative country size. In this chart, Home and Foreign are assumed to be of equal size. Under producer-currency pricing, export prices are sticky in the currency of the producer/exporter; under local-currency pricing, export prices are sticky in the currency of the importer; and under dominant-currency pricing, export prices are sticky in US dollars regardless of the trading partners involved.
Chart 7
Exchange rate pass-through to import prices and trading-partners’ global value chain participation (VAX ratio) under alternative assumptions for export pricing
(y-axis: exchange rate pass-through to import prices; x-axis: trading partner’s VAX ratio)
Source: ECB calculations.
Notes: The slope of the relationship between the VAX ratio and exchange rate pass-through to import prices depends on relative country size. In this chart, Home and Foreign are assumed to be of equal size. Under producer-currency pricing, export prices are sticky in the currency of the producer/exporter; under local-currency pricing, export prices are sticky in the currency of the importer; and under dominant-currency pricing, export prices are sticky in US dollars regardless of the trading partners involved.
The relationships between global value chain participation and exchange rate pass-through to export and import prices do not change qualitatively under alternative assumptions for the export pricing paradigm. Recent research has highlighted the empirical relevance of local-currency and dominant-currency pricing as alternatives to producer-currency pricing.[26] Under producer-currency pricing export prices are sticky in the currency of the producer, while under local-currency pricing export prices are sticky in the currency of the importer and under dominant-currency pricing, export prices are sticky in the currency of a third country, typically the US dollar. Although the mechanisms linking global value chain participation and exchange rate pass-through to import and export prices may differ somewhat across different export pricing paradigms, higher levels of home (trading-partner) global value chain participation are associated with a higher (lower) exchange rate pass-through to export (import) prices for all pricing paradigms (see Chart 6 and Chart 7). This even applies to the case of flexible prices, under which the currency in which export prices are invoiced is immaterial.
4 Empirical evidence on the effect of global value chain participation on exchange rate pass-through to export and import prices
The role of the rise in global value chain participation in the change in exchange rate pass-through to export and import prices over time is analysed in a panel regression framework. The time-varying, country-specific estimates of exchange rate pass-through to export and import prices estimated in Section 2 using rolling-window regressions are used as the dependent variable in the second step of the analysis. The explanatory variables on the right-hand side of the equation include the VAX ratio as a measure of economies’ global value chain participation (see Box 2).
Box 2 Analysing determinants of time-variation in exchange rate pass-through
Panel regressions are used to gauge the role of the rise in global value chain participation in the change in exchange rate pass-through to export and import prices over time (see Section 4). First, the time-varying estimates of exchange rate pass-through to export prices obtained from the rolling-window regressions in equation (1) in Box 1 are related to the home economy’s degree of global value chain participation in the panel regression
(3)
where is the home economy’s VAX ratio and is a vector of additional controls that include trade openness (measured as the ratio of imports to GDP) as well as the volatility in domestic inflation and the nominal effective exchange rate.[27],[28] The regression also controls for unobserved, time-invariant country-specific characteristics, , that may have a bearing on cross-country differences in exchange rate pass-through. These country fixed effects capture, for example, cross-country differences in the structure of invoicing currencies for exports and imports (see the discussion on Charts 6 and 7), which changes only very slowly over time.[29] The regression also controls for the effects of unobserved, time-varying factors that are common to all countries, . These time fixed effects capture, for example, the fact that estimated exchange rate pass-through and global value chain participation fell synchronously across countries during the global financial crisis. Finally, the regression controls for two other factors that have been suggested to have contributed to the change in exchange rate pass-through in the literature: the share of energy in export and import bundles, , and the rise in globalisation and hence competitive pressures among exporters, measured by an economy’s total factor productivity, .[30],[31] The time index refers to the respective ten-year rolling window in the overall sample period 1991 to 2014.[32]
Analogously to the specification for export prices above, time-varying estimates of exchange rate pass-through to import prices obtained from the rolling-window regressions in equation (2) in Box 1 are related to the degree of global value chain participation of economy i’s trading partners, ,
(4).
The results are consistent with the hypothesis that increasing global value chain participation has contributed to the rise in estimated exchange rate pass-through to export prices. The results from the regression that explores the relationship between the country-specific, time-varying estimates of exchange rate pass-through to export prices and countries’ increase in global value chain participation – reflected in a reduction in their VAX ratio – are reported in Table 1, column 1 (see also Box 1). The negative and statistically significant coefficient estimated for the VAX ratio is consistent with the hypothesis that a greater role for imported intermediates in production has rendered export prices more sensitive to exchange rate changes.
Table 1
Panel regression results showing the relationship between global value chain participation and changes in the estimated exchange rate pass-through to import and export prices

Sources: ECB calculations.
Notes: Significance levels: *** p < 0.01, ** p < 0.05. Inference is carried out on the basis of Driscoll-Kraay standard errors which are robust to heteroscedasticity and autocorrelation as well as cross-section dependence. The VAX ratio reflects the ratio of an economy’s domestic value added to gross exports.
The results are also consistent with the hypothesis that the increasing degree of global value chain participation has contributed to the decline in the estimated exchange rate pass-through to import prices. The regression results are consistent with the hypothesis that an increased degree of global value chain participation on the part of economy i’s trading partners – reflected in a reduction in the latter’s VAX ratio, – reduces the sensitivity of Home import prices to exchange rate changes (Table 1, column 2). The estimates are also consistent with the hypothesis that a decline in the share of energy in total imports and an increase in competitive pressures among exporters in the context of greater globalisation have contributed to the reduction of estimated exchange rate pass-through to import prices, as argued in existing literature.[33],[34]
Because the regression framework does not identify structural innovations that have underpinned the rise in global value chain participation, it is difficult to quantify the latter’s historical contribution to the overall variation in estimated exchange rate pass-through over time. However, assuming that changes in global value chain participation are exogenous and uncorrelated with changes in other potential determinants of exchange rate pass-through (which may well not be the case), a rough calculation is possible. Under these assumptions, the observation that the VAX ratios of the economies in the sample considered have fallen on average by about 5 percentage points, together with the relevant coefficient estimate in column 1, Table 1, would imply that the rise in global value chain participation has raised exchange rate pass-through to export prices by 5 percentage points – which is very close to the 7 percentage point increase actually estimated. Similarly, the observation that the rise in the integration of the rest of the world in value chains with the economies considered in the sample as reflected in a fall in the VAX ratios on average by about 4 percentage points, together with the relevant coefficient estimate in column 2, Table 1, would imply that the rise in global value chain participation has reduced exchange rate pass-through to import prices by 1.3 percentage points, which is around 20% of the overall decline.
5 Conclusion
The decline in exchange rate pass-through to import prices in advanced economies, documented in several contributions to the literature, has important monetary policy implications. In an environment with limited exchange rate pass-through to import prices, expenditure-switching effects in response to exchange rate depreciations are muted and exchange rate depreciations are associated with only minor increases in import and hence consumer price inflation. It is thus important to understand the mechanisms that have given rise to this decline.
This article has examined the impact of economies' participation in global value chains on their exchange rate pass-through to export and import prices. The empirical evidence suggests that global value chain participation increases economies’ exchange rate pass-through to export prices and reduces pass-through to import prices. Some evidence suggests that in the years following the Great Recession and especially after the trade slowdown observed in 2011, the pace of global value chain expansion has decelerated and the strengthening of production chains has become more important at the regional level. It is therefore possible that the decline in exchange rate pass-through due to the expansion of global value chain participation has also slowed.
- See Campa, J. and Goldberg, L., ”Exchange Rate Pass-Through into Import Prices”, The Review of Economics and Statistics, Vol. 87, No 4, 2005, pp. 679-690; Marazzi, M., Sheets, N., Vigfusson, R., Faust, J., Gagnon, J., Marquez, J., Martin, R., Reeve, T. and Rogers, J., “Exchange-Rate Pass-through to U.S. Import Prices: Some New Evidence,” International Finance Discussion Paper, No 833, Board of Governors of the Federal Reserve System, 2005; Ihrig, J., Marazzi, M. and Rothenberg, A., “Exchange-rate Pass-Through in the G-7 Countries,” International Finance Discussion Paper, No 851, Board of Governors of the Federal Reserve System, 2006; Sekine, T., “Time-varying exchange rate pass-through: experiences of some industrial countries,” BIS Working Paper, No 202, 2006; and the article entitled “Exchange rate pass-through into euro area inflation”, Economic Bulletin, Issue 7, ECB, 2016.
- See, for example, Baldwin, R., “Global supply chains: why they emerged, why they matter, and where they are going”, in Elms, D. and Low, P. (eds.), “Global value chains in a changing world”, WTO Secretariat, 2013, pp. 13-59; and World Investment Report 2013 – Global Value Chains: Investment and Trade for Development, United Nations Conference on Trade and Development (UNCTAD), 2013.
- See Dedrick, J., Kraemer, K. and Linden, G., “Who profits from innovation in global value chains? A study of the iPod and notebook PCs”, Industrial and Corporate Change, Vol. 19, No 1, 2010, pp. 81-116.
- One estimate is that intermediates account for, respectively, 56% and 73% of overall trade flows in goods and services, see Miroudot, S., Lanz, R. and Ragoussis, A., “Trade in Intermediate Goods and Services”, OECD Trade Policy Papers, No 93, OECD Publishing, 2009.
- See, for example, Hummels, D., Ishii, J. and Yi, K.-M., “The nature and growth of vertical specialization in world trade”, Journal of International Economics, Vol. 54, No 1, 2001, pp. 75-96; Trefler, D. and Zhu, S.C., “The structure of factor content predictions”, Journal of International Economics, Vol. 82, No 2, November 2010, pp. 195-207; Johnson, R. and Noguera, G., “Accounting for intermediates: Production sharing and trade in value added”, Journal of International Economics, Vol. 86, No 2, 2012, pp. 224-236; or Koopman, R., Wang, Z. and Wei, S.-J., “Tracing Value-Added and Double Counting in Gross Exports”, American Economic Review, Vol. 104, No 2, 2014, pp. 459-94.
- See “Trade Interconnectedness: The World with Global Value Chains”, Policy Paper, International Monetary Fund, 2013.
- See Georgiadis, G., “Determinants of global spillovers from US monetary policy”, Journal of International Money and Finance, Vol. 67, Issue C, 2016, pp. 41-61.
- See Bems, R. and Johnson, R., “Demand for Value Added and Value-Added Exchange Rates”, American Economic Journal: Macroeconomics, Vol. 9, No 4, 2017, pp. 45-90.
- See Brumm, J., Georgiadis, G., Gräb, J. and Trottner, F., “Global Value Chain Participation and Current Account Imbalances”, Journal of International Money and Finance, forthcoming; and Gunnella, V., Fidora, M. and Schmitz, M., “The impact of global value chains on the euro area economy”, Occasional Paper Series, No 221, ECB, 2019.
- For more details see Georgiadis, G., Gräb, J. and Khalil, M., “Global value chain participation and exchange rate pass-through,” Working Paper Series, ECB, forthcoming. A similar mechanism (although the focus is on export quantity elasticities) is explored in Ahmed, S., Appendino, M. and Ruta, M, "Global value chains and the exchange rate elasticity of exports," The B.E. Journal of Macroeconomics, Vol. 17, No 1, 2017, pp. 1-24.
- Of course, if Home also uses intermediates imported from Foreign, the same mechanism that produces a decline in exchange rate pass-through to import prices in Home carries over to import prices in Foreign. However, it can be shown that, in general equilibrium after all rounds of adjustment, exchange rate pass-through to import prices still declines and exchange rate pass-through to export prices still rises as economies participate more in global value chains.
- See Gunnella et al., op. cit., for a discussion of the VAX ratio as an indicator of global value chain participation. See also Section 2.2 for more details.
- For a discussion see Rodnyansky, A., “(Un)Competitive Devaluations and Firm Dynamics,” Cambridge Working Papers in Economics, No 1888, University of Cambridge, 2018.
- The pass-through estimates for the euro area countries are not directly comparable with those for other advanced economies in the sample owing to the inclusion of intra-euro area trade prices in euro area countries’ import and export price data used for the regression. Specifically, because the export and import price data include prices of exports (imports) to (from) other euro area countries while the nominal effective exchange rate does not include exchange rates against other euro area countries, exchange rate pass-through to export and import prices is systematically underestimated for euro area countries relative to non-euro area countries. However, this underestimation is fully accounted for by the inclusion of country fixed effects in the second stage regression in Section 4, at least if the underestimation has not changed over time.
- See Campa, J. and Goldberg, L., op. cit; Vigfusson, R., Sheets, N. and Gagnon, J., “Exchange Rate Passthrough to Export Prices: Assessing Cross-Country Evidence”, Review of International Economics, Vol. 17, No 1, 2009, pp. 17-33; Bussière, M., Delle Chiaie, S. and Peltonen, T., ”Exchange Rate Pass-Through in the Global Economy: The Role of Emerging Market Economies,” IMF Economic Review, Vol. 62, No 1, 2014, pp. 146-178; Burstein, A. and Gopinath, G., “International Prices and Exchange Rates“, in Gopinath, G., Helpman, E. and Rogoff, K. (eds.), Handbook of International Economics, Vol. 4, 2014, pp. 391-451.
- For details see Georgiadis, G., Gräb, J. and Khalil, M., op. cit.
- The countries considered are Australia, Austria, Belgium, Canada, Denmark, Finland, France, Germany, Greece, Ireland, Italy, Japan, the Netherlands, Norway, Portugal, Spain, Sweden, Switzerland, the United States and the United Kingdom.
- Serial correlation in is accounted for by lags of the right-hand side variables other than the exchange rate.
- The sample includes those economies for which data on global value chain participation are available in the World Input-Output Database (WIOD; see below). Quarterly data on import and export price indices and world GDP growth are obtained from the OECD. Data on nominal effective exchange rates, domestic GDP growth and producer price inflation are taken from the IMF's International Financial Statistics.
- For evidence on the decline in the euro area’s exchange rate pass-through to extra-euro area import prices see Özyurt, S., “Has the exchange rate pass through recently declined in the euro area?”, Working Paper Series, No 1955, ECB, 2016.
- See Dedrick et al., op. cit.
- The World Input-Output Database (WIOD) provides global input-output tables at annual frequency in two editions for a large number of countries and sectors. The 2013 edition covers the period from 1995 to 2011 and the 2016 edition the period from 2000 to 2014. Unfortunately, the two editions are not consistent in terms of country and sector coverage. For this reason, the data from the two WIOD editions can in general not be combined to construct consistent measures of global value chain participation for the entire period from 1995 to 2014. Various other concepts and metrics have been proposed to measure trade in value added and global value chain participation on the basis of global input-output tables. See Timmer, M., Dietzenbacher, E., Los, B., Stehrer, R. and de Vries, G., “An Illustrated User Guide to the World Input-Output Database: the Case of Global Automotive Production”, Review of International Economics, Vol. 23, No 3, 2015, pp. 575-605; Timmer, M., Los, B., Stehrer, R. and de Vries, G., "An Anatomy of the Global Trade Slowdown based on the WIOD 2016 Release", GGDC Research Memorandum, No GD-162, Groningen Growth and Development Center, 2016.
- See also IRC Trade Task Force, “Understanding the weakness in global trade – What is the new normal?”, Occasional Paper Series, No 178, ECB, 2016.
- See also World Economic Outlook, International Monetary Fund, October 2016.
- The model is a standard two-country open-economy New Keynesian dynamic stochastic general equilibrium model. Production requires labour and an intermediate input goods bundle, which consists of domestically produced and imported intermediate inputs subject to imperfect substitution. Variation in the VAX is simulated by varying the degree of home bias in production inputs as well as country size. For details see Georgiadis, G., Gräb, J. and Khalil, M., op. cit.
- For local-currency pricing see in particular Betts, C. and Devereux, M., “Exchange rate dynamics in a model of pricing-to-market”, Journal of International Economics, Vol. 50, No 1, 2000, pp. 215-244; as well as Devereux, M. and Engel, C., “Monetary Policy in the Open Economy Revisited: Price Setting and Exchange-Rate Flexibility”, The Review of Economic Studies, Vol. 70, No 4, 2003, pp. 765-783; and for dominant-currency pricing, Gopinath, G., “The international price system”, Jackson Hole Symposium Proceedings, 2016; Casas, C., Diez, F., Gopinath, G. and Gourinchas, P.-O., “Dominant Currency Paradigm: A New Model for Small Open Economies,” IMF Working Paper, No 17/264, 2017; as well as Boz, E., Gopinath, G. and Plagborg-Møller, M., “Global Trade and the Dollar,” IMF Working Paper, No 17/239, 2017.
- The estimates of exchange rate pass-through used as dependent variables are generated regressands, which is less problematic than in case of generated regressors as this does not imply correlation between an explanatory variable and the regression error by construction.
- See Taylor, J., “Low inflation, pass-through, and the pricing power of firms”, European Economic Review, Vol. 44, No 7, 2000, pp. 1389-1408, as well as Frankel, J., Parsley, D. and Wei, S.-J., “Slow Pass-through Around the World: A New Import for Developing Countries?”, Open Economies Review, Vol. 23, No 2, 2012, pp. 213-251.
- Another variable that is likely to be captured to a large degree by country fixed effects is the share of trade within a country’s own currency area. When the role of imported intermediate inputs in amplifying the exchange rate effect on export prices is considered, the effect only matters if the imported intermediate input is from an economy which has a different currency. For example, for a German producer, using inputs imported from the Netherlands would not have any effect on the exchange rate pass-through, whereas inputs from China would amplify it.
- See Campa, J. and Goldberg, L., op. cit.; Gust, C., Leduc, S. and Vigfusson, R., “Trade Integration, competition, and the decline in exchange-rate pass-through”, Journal of Monetary Economics, Vol. 57, No 3, 2010, pp. 309-324; and Amiti, M., Itskhoki, O. and Konings, J., “Importers, Exporters, and Exchange Rate Disconnect”, American Economic Review, Vol. 104, No 7, 2014, pp. 1942-78.
- The bilateral trade weights for the construction of variables which correspond to averages of an economy's major trading partners are taken from the Bank for International Settlements. Data on total factor productivity measured at constant prices is taken from the Penn World Table database. The share of fuel imports (exports) in total imports (exports) is taken from the World Bank’s World Development Indicators database. The sample used for the estimations spans the period from 2000 to 2014.
- Since the estimates of exchange rate pass-through are obtained from overlapping sample periods in the first stage, residuals in the second stage regressions are serially correlated. This is taken into account by inference that is robust to serial correlation of the residuals.
- Because real total factor productivity is measured as an index, the country-specific trading-partner average cannot be calculated. However, given that such averages will be very similar across economies in the sample, they are absorbed in the period fixed effects.
- Available panel data on currency invoicing shares suggest that invoicing patterns have remained broadly unchanged over time. Accordingly, there is little evidence to suggest that changes in exchange rate pass-through relate to changes in pricing paradigms.