
Executive summary
This report analyses trends in card fraud in 2019 as reported by card payment schemes active in the euro area. The analysis focuses on data for 2019, which are put into the context of a five-year period from 2015 to 2019. Card payment schemes active in the euro area report data broken down by Single Euro Payments Area (SEPA) country, covering almost the entire card market.[1] Card fraud consists of (i) fraudulent transactions with physical cards (card-present fraud), such as cash withdrawals with counterfeit or stolen cards; and (ii) fraudulent transactions conducted remotely (card-not-present fraud), for example where criminals conduct online payments with card details obtained through phishing or data breaches.[2]
The total value of fraudulent transactions using cards issued within SEPA[3] and acquired worldwide[4] amounted to €1.87 billion in 2019. For cards issued in the euro area only, the total value of fraudulent card transactions amounted to €1.03 billion.
Fraud as a share of the total value of transactions decreased in 2019, as fraud in absolute terms increased at a slower pace than overall card payments. The total value of overall card transactions using cards issued within SEPA and acquired worldwide increased by 6.5% compared with 2018, whereas corresponding fraud grew by 3.4%. Consequently, fraud as a share of the total value of transactions decreased by 0.001 percentage points to 0.036% in 2019. Over the five-year period between 2015 and 2019, the lowest fraud share was observed in 2017 (0.035%), which was the lowest figure recorded since the start of data collection in 2007. A share of 0.036% means that on average 3.6 cent were lost to fraud for each €100-worth of transactions using cards issued within SEPA in 2019. For cards issued in the euro area, the value of fraud as a share of total card transactions in 2019 remained below the share for SEPA as whole at 0.032%, albeit up slightly from 0.031% in 2018.
The vast majority of fraudulent transactions continue to be related to card-not-present (CNP) fraud. In 2019 80% of the value of card fraud resulted from CNP transactions, i.e. payments via the internet, mail or phone. In contrast, fraudulent transactions at physical point-of-sale (POS) terminals such as face-to-face payments at retailers or restaurants and at automated teller machines (ATMs) only accounted for 15% and 5% of the total value of card fraud in 2019 respectively.[5] CNP fraud accounted for €1.50 billion in fraud losses in 2019, up by 4.3% on the previous year. Partially available data on total CNP transactions suggest that fraud grew at a considerably slower rate than overall CNP transactions in 2019. With respect to card-present transactions, fraud committed at POS terminals went up by 2.2% in 2019, while fraud committed at ATMs decreased by 6.1%. The latter was driven by a notable decline in counterfeit card fraud at ATMs involving transactions acquired outside SEPA, as the increased global adoption of EMV chip technology[6] further reduced opportunities for committing magnetic stripe counterfeit fraud.[7]
Delayed debit and credit card transactions appear more affected by fraud than debit card payments. When distinguishing card payments by card function, the fraud share of delayed debit and credit cards in 2019 (0.088%) continued to be considerably larger than the share for debit card transactions (0.016%), the former being more frequently used for online payments and cross-border transactions. However, the fraud share for delayed debit and credit cards declined notably compared with previous years (from around 0.11% in 2015 and 2016 to 0.088% in 2019).
More than half of the total value of fraud in 2019 was related to cross-border transactions within SEPA. From a geographical perspective, domestic transactions accounted for 89% of the value of all card transactions in 2019, but only 35% of fraudulent transactions. Cross-border transactions within SEPA represented 9% of all card transactions in terms of value, but 51% of reported fraud. Although only 2% of all transactions were acquired outside SEPA, they accounted for 14% of fraud. While the increase in the absolute value of card fraud in 2019 related almost exclusively to increases in fraud involving cross-border transactions acquired within SEPA, relative fraud shares declined for both domestic and cross-border transactions compared with the previous year.
Further reductions in European fraud shares are expected with the implementation of the Regulatory Technical Standards (RTS) for strong customer authentication (SCA) and common and secure open standards of communication (CSC) under the revised Payment Services Directive (PSD2). The share of fraud in the total value of transactions was lower from 2017 to 2019 than in previous years. This was supported by the implementation of various fraud prevention measures by payment service providers (PSPs) and card payment schemes, such as EMV standards, card tokenisation and geo-blocking, along with efforts by European regulators to strengthen the security requirements for card payments with PSD2. Implementation of the RTS for SCA and CSC under PSD2, which entered into force in 2019, should make card payments even more secure and reduce opportunities for fraud. The full effect of these regulatory measures was expected to materialise following market-wide implementation by 31 December 2020. The first experiences reported by individual card payment schemes already appear encouraging, although it is too early to draw market-wide conclusions.
The Eurosystem will continue to monitor trends in fraud and the security of card payments, supported by more detailed and comprehensive information in future. In 2018 the European Banking Authority (EBA), in close cooperation with the European Central Bank (ECB), specified in the EBA Guidelines on fraud reporting under PSD2[8] a set of statistical information on payment fraud to be collected from payment service providers, in line with the requirements set out in PSD2. This broadens the scope of information collected to cover various types of payment transactions and includes more detailed information on both the type of fraud and the corresponding transaction. In December 2020 the ECB Governing Council adopted the inclusion of these requirements in a larger data collection exercise under the ECB Regulation on payments statistics, with reporting to commence in 2022. This not only makes it possible to broaden the focus beyond card fraud, but also to conduct a more detailed assessment of the effectiveness of recent regulatory measures such as the RTS on SCA and CSC.
Overall, the outlook on card fraud has improved slightly since the last edition of this report, but industry, regulators and consumers need to remain vigilant. Although fraud in relative terms decreased slightly in 2019, overall levels remain persistent and are increasing in absolute terms. Moreover, the recent surge in card payments for online purchases during the COVID-19 pandemic may increasingly make such payments the target of criminal activities (e.g. by phishing). Consequently, card payment schemes and their participating PSPs are encouraged to continue to exchange information related to fraud prevention and best security practices. PSPs also need to go on fighting fraud and provide secure payment solutions to end users. It is important for them to be supported in this by the merchants, as they play a key role in the successful implementation of these solutions.
1 Introduction
In its role as overseer of card payment schemes operating in the euro area, the Eurosystem closely monitors trends in card fraud. The ECB’s Governing Council approved an oversight framework for card payment schemes in January 2008. Statistical information is collected on these schemes as part of the harmonised implementation of this framework.
Each card payment scheme is asked to supply general business data, along with volumes and values of card transactions and the corresponding fraud, broken down by country for all countries in the Single Euro Payments Area (SEPA) and in aggregate for all countries outside SEPA. This report analyses and summarises the information received for 21 card payment schemes and system operators.[9]
The results presented in this report are generally derived from an issuing perspective. The exception is Chapter 7, where some results are also shown from an acquiring point of view. Where this occurs, the change of perspective is highlighted. Results presented “from an issuing perspective” refer to payments made with cards issued within SEPA and acquired worldwide. Results “from an acquiring perspective” refer to transactions conducted using cards issued worldwide and acquired within SEPA.
As with previous editions of this report, a few methodological issues continue to apply; these are detailed in the annex. However, since these divergences are limited to a few specific schemes and countries they have been accepted for the present analysis.
The report is organised as follows. Chapter 2 presents the main findings on the total level of card fraud. Chapter 3 analyses reported fraud for different card functions. Chapters 4 and 5 focus on CNP and card-present fraud respectively. Chapter 6 compares fraud figures between domestic transactions and cross-border payments, both within and outside SEPA. Chapter 7 takes a more detailed look at country-specific findings for EU Member States, focusing on both absolute and relative levels of fraud. Chapter 8 concludes, providing an outlook on potential fraud-related trends going forward.
The first annex provides a glossary of terms frequently used in the report. The second annex describes some persistent methodological divergences in the data reporting.
2 Total level of card fraud
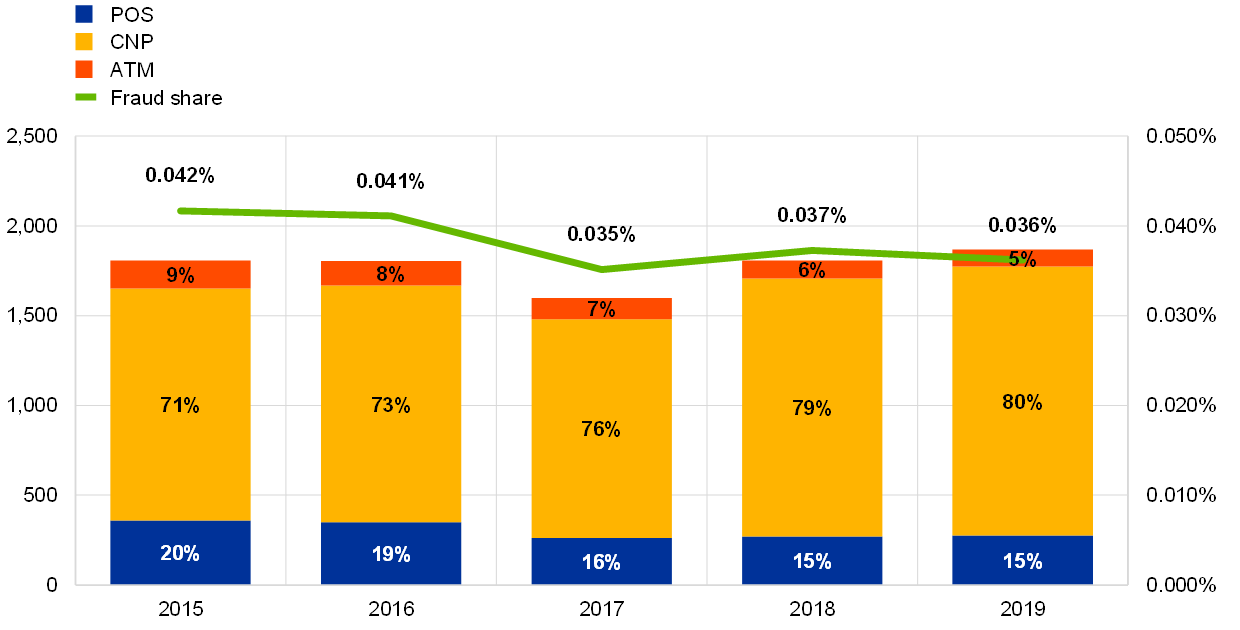
The total value of transactions using cards issued in SEPA amounted to €5.16 trillion in 2019, of which €1.87 billion was fraudulent (see Chart 1a).
The value of card fraud increased by 3.4% compared with 2018, while the value of overall card transactions grew by 6.5%. The value of overall card transactions thus grew faster than fraud, leading to a slight decrease in fraud as a share of the total value of transactions from 0.037% in 2018 to 0.036% in 2019.[10] This follows a slight increase in the fraud share in 2018 from its lowest recorded level in 2017 (0.035%). Both the 2018 and 2019 figures remain notably below the five-year high recorded in 2015 (0.042%). Taking a broader perspective over the last ten years, card fraud increased in both absolute and relative terms until the middle of the decade, but has shown substantial improvements in relative terms in recent years (see Box 1).
The relevance of CNP fraud continues to increase, accounting for 80% of the total value of fraud in 2019. In contrast, the share of fraud at ATMs and POS terminals decreased to 5% and 15% of the total value of fraud respectively.
Chart 1a
Total value of card fraud using cards issued within SEPA
(left-hand scale: total value of fraud (EUR millions); right-hand scale: value of fraud as a share of the value of transactions)
Source: All reporting card payment scheme operators.
The total number of card transactions using cards issued in SEPA amounted to 100.75 billion in 2019, of which 24.16 million were fraudulent (see Chart 1b).[11]
Compared with 2018, card fraud volume in 2019 increased in both absolute (+14.8%) and relative terms (from 0.023% to 0.024% of all card payments), as the total number of card transactions grew by 12.4%. The fraud share in terms of volumes, however, remained considerably below the corresponding figure for values.
As with fraud in terms of value, the vast majority of fraudulent transactions in terms of volumes is related to CNP fraud, accounting for 80% of all fraudulent transactions in 2019. The number of fraudulent transactions at ATMs and POS terminals only account for 2% and 18% of all fraudulent transactions in 2019 respectively.
Chart 1b
Total volume of card fraud using cards issued within SEPA
(left-hand scale: total volume (million transactions); right-hand scale: volume of fraud as a share of the volume of transactions)

Source: All reporting card payment scheme operators.
As the number of fraudulent card transactions grew at a faster rate than the corresponding value of fraud in 2019, the average value of a fraudulent transaction continued to decline (-10% compared with 2018; see Chart 2). In 2019 a fraudulent transaction on average amounted to around €77, which is roughly 41% less than the figure recorded in 2015. This decrease in average fraud amount was substantially steeper than the corresponding decline in the average card payment in general.[12]
The decline in the average value of a fraudulent transaction was solely driven by declining average amounts for CNP and POS fraud. At the same time, the average fraudulent transaction value at ATMs has been considerably larger and has increased slightly over recent years.
Chart 2
Average size of transactions and fraud
(left-hand scale: average value (EUR))

Source: All reporting card payment scheme operators.
Box 1
Card fraud trends 2009-19
The data collection from card payment schemes providing the basis for this report has now been accumulating consistent and comparable information on card fraud for cards issued in SEPA for more than a decade. Consequently, it seems relevant to take a broader perspective on card fraud over a longer time horizon, assessing how it has evolved over the last ten years.
Card fraud has generally increased in absolute terms (see Chart A), amid an overall increase in card transactions and an ever-increasing relevance of CNP payments conducted online (which are more affected by fraud than card-present transactions). At the same time, the overall growth in the value of card fraud over this period has been lower than the corresponding growth in card payments in general, and the value of card fraud appears to have plateaued in recent years. In relative terms, i.e. as a share of total value of transactions, fraud has been lower in recent years (2017-19) compared with previous years for which data was collected, suggesting a beneficial impact from the various fraud prevention measures employed by the industry along with corresponding regulatory efforts. The minimum share of fraud in the total value of transactions over this period was recorded in 2017 (0.035%), while the maximum was in 2009 (0.048%).
Chart A
Total value of card fraud using cards issued within SEPA
(left-hand scale: 2009 value = 100; right-hand scale: value of fraud as a share of the value of transactions)

Source: All reporting card payment scheme operators for each year.
Turning to the type of fraud, card-present fraud conducted at ATMs or POS terminals seems to have played a more significant role in 2009 compared with 2019, in both absolute and relative terms (see Chart B). At the same time, the overall increase in the absolute value of fraud over the ten-year period appears to have been driven solely by the considerable increase in CNP fraud.
Card-present fraud in 2009 was mostly related to counterfeit fraud, which had decreased substantially by 2019. This appears at least partially due to the use of security measures such as the increasing implementation of EMV chip standards globally in recent years. The result has been a continuing decline in counterfeit fraud, contributing substantially to the overall reductions in card-present fraud over the last decade.
Chart B
Card fraud by type in 2009 and 2019
(left-hand scale: total value of fraud (EUR millions))

Source: All reporting card payment scheme operators in the respective years.
Throughout most of the decade, the majority of fraud related to cross-border card transactions (see Chart C). However, the share of domestic fraud in the total value of fraudulent transactions was notably larger in earlier years, as the overall increase in the total value of fraud in recent years has been almost solely in cross-border transactions.
In relative terms, cross-border payments appear consistently more affected by fraud than domestic transactions, with the corresponding fraud share being considerably higher. The fraud share figures for cross-border payments acquired outside SEPA were especially high in the earlier years of the decade. Compared with 2009, the fraud shares for both domestic and cross-border transactions, whether acquired within or outside SEPA, were lower in 2019. In particular, the fraud share for cross-border transactions acquired outside SEPA showed a steep decrease over the ten-year period amid the global roll-out of EMV standards mentioned above, and converged with fraud rates for cross-border transactions acquired within SEPA.
Chart C
Card fraud by geographical dimension between 2009 and 2019 in both absolute and relative terms
(left-hand scale: total value of fraud (EUR millions); right-hand scale: value of fraud as a share of the value of transactions)

Source: All reporting card payment scheme operators for each year.
3 Card fraud by card function
Data for this report are collected separately for (i) debit cards, and (ii) delayed debit and credit cards.[13] As in previous years, data for 2019 show that transactions with delayed debit and credit cards appear to be more affected by fraud in terms of value than transactions with debit cards (see Chart 3), with the former being more frequently used for online payments and cross-border transactions. This was observed for almost all SEPA countries.
The total share of fraud in the overall value of transactions, however, decreased compared with the previous year for delayed debit and credit cards to 0.088%, while remaining stable for debit cards at 0.016%. In general, delayed debit and credit card fraud accounted for 58% of the total value of payment card fraud in 2019.
For delayed debit cards and credit cards, fraud decreased in 2019 for all channels (i.e. CNP, ATMs and POS terminals) in both absolute and relative terms (as a percentage of total delayed debit card and credit card transactions), with the overall fraud share for delayed debit and credit card transactions reaching a five-year low.
For debit cards, CNP and POS fraud increased in 2019 in absolute terms (not shown in the chart) compared with the previous year, but decreased for ATMs; in relative terms, the shares of CNP, POS and ATM fraud in the total value of debit card transactions remained stable in 2019 compared with the previous year.
Chart 3
Share and composition of fraud by card function
(value of fraud as a share of corresponding total value of transactions)

Source: All reporting card payment scheme operators.
Note: Excludes cards issued in France and Spain, which are partially reported in aggregate without distinguishing by card function.
4 Card-not-present fraud
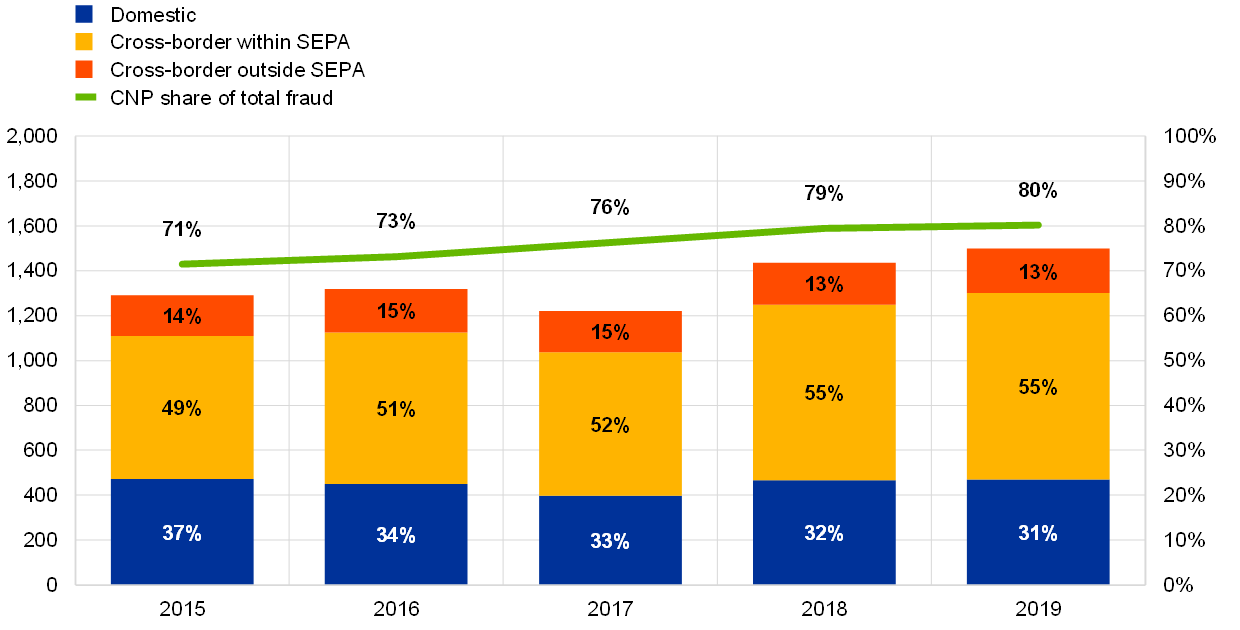
In 2019 the total value of card-not-present (CNP) fraud increased by 4.3% compared with the previous year, reaching a total of €1.50 billion in value. Partially available data on total CNP transactions suggest, however, that fraud has grown at a slower rate than overall CNP transactions.
CNP fraud accounted for 80% of the total value of card fraud in 2019. This share has been growing steadily since 2008 (not shown on the chart), thanks to the continuously increasing importance of card payments over the internet.
An increase of 15.9% in CNP fraud over the five years from 2015 to 2019 was the main driver behind the overall slight increase in the total value of fraud by 3.4% over this period. The majority of CNP fraud takes place across borders, with the largest part relating to cross-border transactions within SEPA, as shown in Chart 4 below. Further details on trends in CNP fraud in 2019 are provided in Chapter 7.
Chart 4
Value of CNP fraud and share of the total value of fraud
(left-hand scale: total value of CNP fraud (EUR millions); right-hand scale: value of CNP fraud as a share of total fraud)
Source: All reporting card payment scheme operators.
5 Types of card-present fraud at ATMs and POS terminals
While 80% of the total value of fraudulent transactions in 2019 involved CNP fraud, card-present fraud committed at ATMs and POS terminals still accounted for a considerable loss in terms of value.
In absolute terms, the combined value of ATM and POS fraud (representing the total of card-present fraud) amounted to more than €370 million in 2019, marking a slight decrease of 0.03% compared with the previous year. The value of ATM fraud alone decreased by 6.1%, continuing the steady decline since 2015; the value of POS fraud slightly increased by 2.2% compared with the previous year.
5.1 Types of fraud
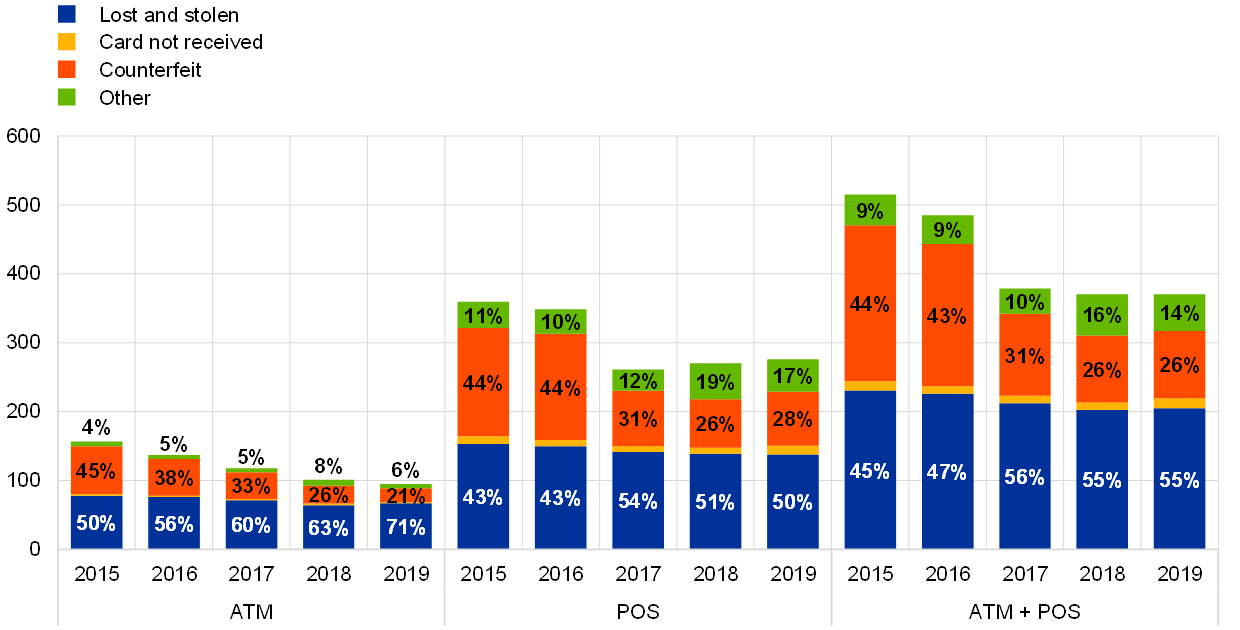
The decrease in the value of ATM fraud in 2019 was mainly driven by a decline in counterfeit card fraud (-25.5%), while losses from lost-and-stolen cards continued to be the main type of ATM fraud (accounting for 71% of total card-present fraud at ATMs in terms of value). Other types of ATM fraud play only a minor role (accounting for 6% of total fraud at ATMs in 2019).
The decrease observed in counterfeit card fraud at ATMs appears to be at least partially the result of the increased global roll-out and maturity of EMV terminals, which has significantly reduced opportunities for committing magnetic stripe counterfeit fraud. The resulting general reduction in non-EMV cross-border transactions has further aided card issuers in their fraud detection and prevention efforts (making it easier to identify fraud).
At POS terminals, increases in card-not-received (+47.9%) and counterfeit card fraud (+10.4%) appear to be the main cause for the overall increase in the total value of card-present fraud in 2019. At the same time, lost-and-stolen card fraud declined slightly in absolute terms compared with previous years, but still accounted for half of the total value of card-present-fraud at POS terminals. In contrast to ATM fraud, other types of fraud (e.g. account takeovers or compromised application fraud, where fraudsters apply for a card in someone else’s name or request a replacement card by falsely reporting theft or loss, for instance) continued to play a more significant role, being responsible for around 17% of total card-present fraud at POS in terms of value in 2019.
Over the five-year period from 2015 to 2019, the value of counterfeit card fraud at ATMs and POS terminals combined decreased by 56.8% in absolute terms, while lost-and-stolen card fraud decreased by 11.3%. The latter, however, remains the most prominent category of card-present fraud, accounting for 55% of all card-present fraud in terms of value in 2019.
Chart 5
Value of fraud by category at ATMs and POS terminals
(total value of card-present fraud (EUR millions))
Source: All reporting card payment scheme operators.
5.2 Geographical breakdown of counterfeit card fraud at ATMs and POS terminals
As in previous years, the vast majority of counterfeit card fraud in 2019 involved cross-border transactions (see Chart 6). A considerable part of these transactions related to cross-border payments acquired outside SEPA. More specifically, 87% of ATM counterfeit card fraud and 34% of POS counterfeit card fraud related to transactions of this type.
This share, however, continues to decline. The value of overall counterfeit card fraud for transactions acquired outside SEPA decreased further in 2019 (-23.5% compared with the previous year), thanks to the continued roll-out of the EMV security standard on a global level. Over the five-year period from 2015 to 2019, counterfeit card fraud for transactions acquired outside SEPA decreased by 77.2%.
At the same time, it is noteworthy that counterfeit card fraud involving domestic and cross-border transactions within SEPA increased by 16.9% and 42.4% respectively in 2019. The latter accounted for 50% of all counterfeit card fraud at POS terminals in 2019.
Chart 6
Value of counterfeit card fraud at ATMs and POS terminals
(total value of counterfeit fraud (EUR millions))

Source: All reporting card payment scheme operators.
6 Geographical distribution of card fraud
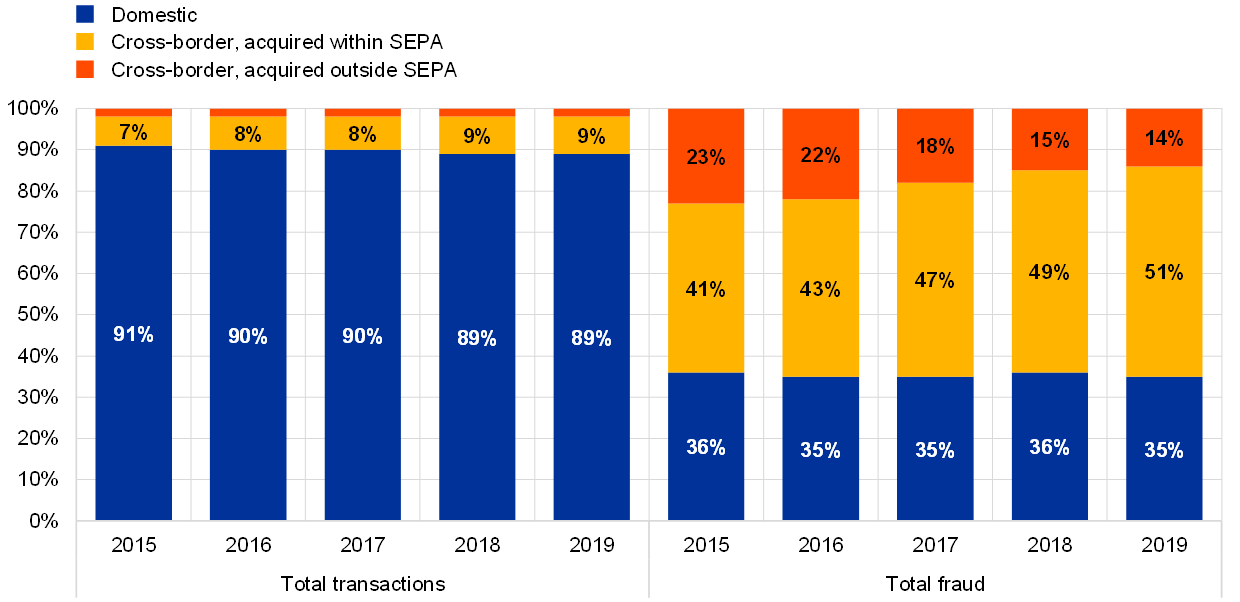
The geographical composition of overall card transactions with cards issued within SEPA remained relatively unchanged in terms of values in 2019, with the overall share of cross-border card transactions within SEPA in 2018 and 2019 being slightly higher than in earlier years (see Chart 7). Domestic transactions continue to represent the vast majority of card payments.
In 2019 domestic transactions increased by 5.8% compared with the previous year, accounting for 89% of all transactions (the same share as in 2018). Cross-border transactions within SEPA, on the other hand, went up by 12.1%, representing 9% of all card transactions. Consequently, as in previous years, cross-border transactions within SEPA grew at a faster pace than domestic card payments. This indicates that cardholders are increasingly purchasing goods and services across borders at physical or e-commerce merchants within SEPA. The proportion of cross-border card transactions outside SEPA remained stable between 2015 and 2019 at 2% of the total value of card payments, while the annual year-on-year growth rate accelerated each year (+13.1% in 2019).
In turn, while representing only 9% of all card payment transactions, cross-border transactions within SEPA accounted for more than half of all fraudulent transactions in terms of value in 2019 (51%), followed by domestic fraud (35%) and cross-border fraud outside SEPA (14%).
Cross-border card fraud within SEPA as a share of total card fraud rose slightly in 2019 compared with the previous year, maintaining the steady trend seen in recent years. In absolute value terms, cross-border card fraud within SEPA in 2019 increased by 7.0% compared with the previous year, marking a 28.3% rise since 2015. In contrast, domestic card fraud and cross-border fraud outside SEPA declined by 1.3% and 34.5% respectively over the same five-year period. As a result, cross-border fraud within SEPA now represents the most significant geographical category of card fraud.
Chart 7
Value of domestic and cross-border transactions and fraud
Source: All reporting card payment scheme operators.
The geographical composition of reported card fraud allows the following observations on type of fraud:
- Counterfeit card fraud is typically committed outside SEPA (see Chart 8). However, the share of counterfeit card fraud involving cross-border transactions acquired outside SEPA in total counterfeit card fraud decreased substantially in 2019, supported by the continued global migration to EMV standards (see Chapter 5).
- Lost-and-stolen card fraud typically takes place at the domestic level (representing more than 60% of all lost-and-stolen fraud), with relative proportions remaining fairly stable in 2019 compared with the previous year.
Chart 8
Geographical breakdown of lost-and-stolen and counterfeit card fraud at ATMs and POS terminals by value
(value of fraud as a share of total lost-and-stolen and counterfeit fraud: geographical breakdown)

Source: All reporting card payment scheme operators, 2018 and 2019.
In 2019 both domestic transactions and domestic fraud increased in absolute terms compared with the previous year (see Chart 9). Similarly, both cross-border transactions acquired within SEPA and corresponding fraud also increased. In contrast to the previous year, however, total transactions grew at a faster pace than the corresponding fraud levels in both cases, implying a decrease in fraud in relative terms.
In addition, while the value of cross-border transactions acquired outside SEPA grew considerably in 2019, corresponding fraud decreased in the same period (albeit not as much as in previous years).
Chart 9
Total value of domestic and cross-border transactions and fraud
(year-on-year difference in fraud value)

Source: All reporting card payment scheme operators.
Note: “within SEPA” refers to transactions acquired in SEPA countries; “outside SEPA” refers to transactions acquired in non-SEPA countries.
7 A country-by-country and regional perspective on card fraud
As in previous years, the share of fraud in the total value of card transactions varied considerably across EU Member States in 2019 (see Chart 10).
From an issuing perspective,[14] fraud rates in France,[15] the United Kingdom and Spain were the highest in 2019, while rates in Romania, Hungary and Poland were among the lowest.
From an issuing perspective, card fraud as a share of total value of card payments was lower for the euro area (0.032%) than for SEPA as whole (0.036%) in 2019. In contrast, from an acquiring perspective, the euro area continued to experience slightly higher fraud rates than SEPA as a whole.
Chart 10
Fraud share from an issuing and acquiring perspective
(value of fraud as a share of value of transactions)
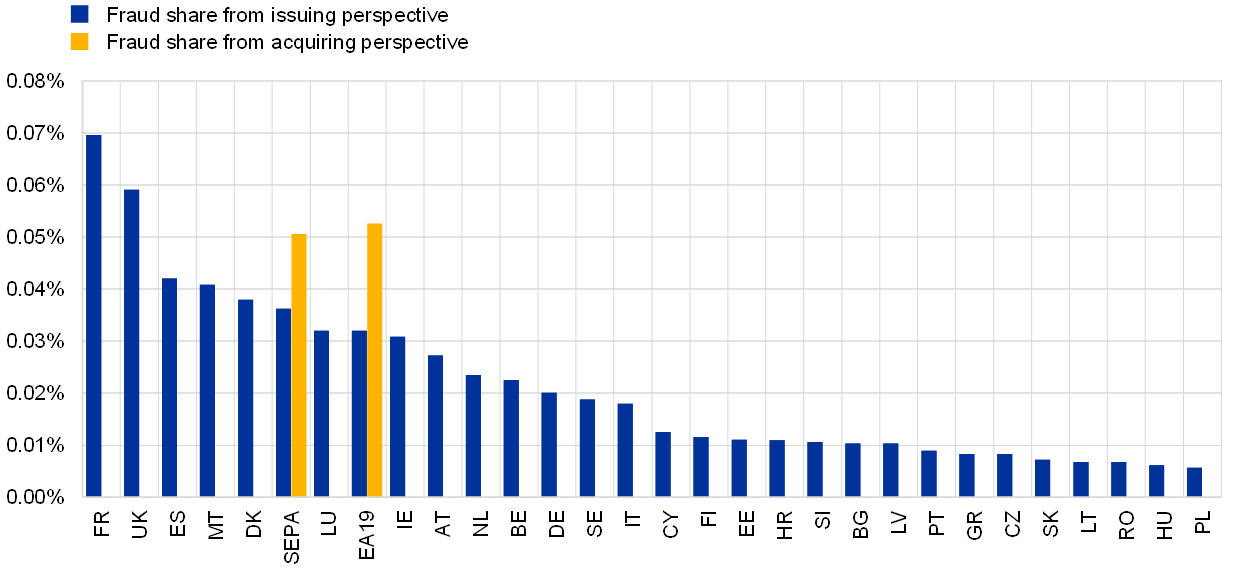
Source: All reporting card payment scheme operators, 2019.
Notes: Blue bars reflect the fraud share for transactions with cards issued in the respective country/area and acquired anywhere. Yellow bars reflect the fraud share for transactions with cards issued anywhere and acquired within the geographical area. The fraud rate for France calculated from the data collected for this report differs from the fraud rate according to the Banque de France own data (0.064% according to the 2019 Annual Report of the Observatory for the Security of Payment Means) owing to inconsistencies in the collection of data on domestic transactions and fraud. The fraud rate for Denmark is also slightly higher compared with statistics available at Danmarks Nationalbank (0.035%), due to slight differences in the reporting basis. EA19 stands for the euro area as a whole.
Fraud rates for SEPA (and the euro area) remain generally lower from an issuing perspective than an acquiring perspective. This indicates that cards issued within SEPA experience lower fraud rates for transactions acquired outside SEPA than cards issued in non-SEPA countries for transactions acquired within SEPA. Consequently, European card holders appear to benefit from the security features of their cards when paying abroad as well as at home.
Compared with five years earlier, fraud as a share of the total value of transactions from an issuing perspective is lower in 2019 for both the euro area (-3.6%) and SEPA as a whole (-13.2%). This is mainly the result of the fraud prevention and detection measures developed by the industry, along with European regulatory efforts to strengthen the security of card payments.
Overall, fraud shares decreased over this five-year period in the majority of EU Member States. In eight of them, fraud shares in 2019 are higher than in 2015, albeit often in line with similar increases in card usage and e-commerce transactions. For most of these countries, however, this stems from comparatively very low fraud shares in 2015, with latest figures still remaining relatively low.
In all EU Member States, the majority of card payments in 2019 related to domestic transactions (see Table 1). Compared with previous years, this picture has not changed much. However, the relevance of cross-border payments, involving payments acquired in countries other than the country of issuance, has been increasing steadily over recent years in the majority of countries. In addition, the share of cross-border transactions from an issuing perspective varies considerably across EU Member States, ranging from 3% of the total value of transactions (Portugal) to 43% (Luxembourg).
In contrast to card payments in general, for almost all EU countries fraud mainly relates to cross-border payments. In 19 Member States, cross-border fraud accounted for more than 90% of the total value of fraud for cards issued in the respective country in 2019. In several countries, the share of cross-border fraud was close to 100% of total fraud (e.g. Bulgaria, Cyprus, Estonia, Latvia, Lithuania and Slovakia). Only in a few, mostly larger, domestic markets such as France and the United Kingdom, and to a lesser extent Ireland and Germany, do fraudulent domestic transactions seem to play a more significant role (accounting for between 21% and 47% of total fraud).
Table 1
Cross-border transactions and fraud as a share of the total value of transactions/fraud

Source: All reporting card payment scheme operators, 2019.
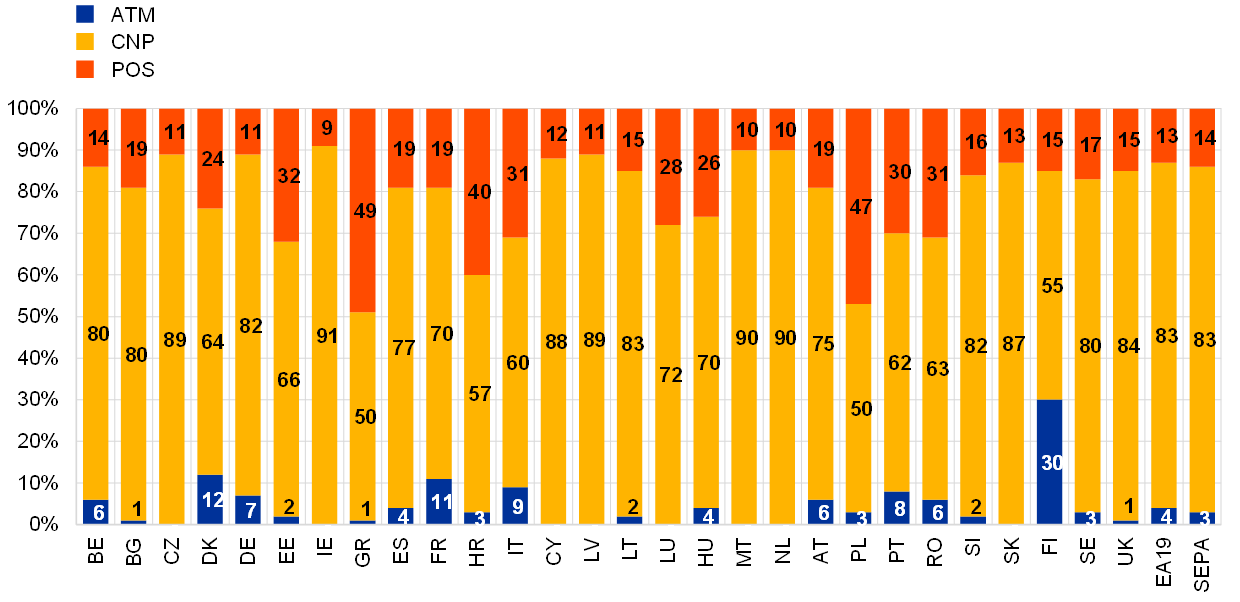
From an issuing point of view, CNP fraud was the main channel for committing card fraud across all EU Member States in 2019. For Greece, Latvia, Lithuania and Romania, over 95% of all fraudulent transactions in terms of value related to CNP fraud. In contrast, for Finland and France, 36% and 27% respectively of total fraud in 2019 was related to card-present transactions at ATMs and POS terminals.
In general, the variation in relative shares of each channel in total fraud across EU countries from an issuing point of view has decreased in recent years:
- CNP fraud accounted for between 64% and 98% in 2019, with a median share of 88% (which increased by 3 percentage points compared with 2018).
- POS fraud accounted for between 1% and 27%, with a median share of 8%.
- ATM fraud accounted for between 0% and 13%, with a median share across countries of 5%.
Chart 11
Geographical distribution of the value of card fraud by transaction channel from an issuing perspective
(value of fraud by channel as a share of total fraud)

Source: All reporting card payment scheme operators, 2019.
Note: EA19 stands for the euro area as a whole.
Variations in the fraudulent use of the different channels were more pronounced from the acquiring point of view than from the issuing perspective. The median share of CNP in total fraud is also substantially lower from the acquiring point of view than from the issuing perspective.
- CNP fraud accounted for between 50% and 91%, with a median share of 79% (which increased by 4 percentage points compared with 2018).
- POS fraud accounted for between 9% and 49%, with a median share of 18%.
- ATM fraud accounted for between 0% and 30%, with a median share of 3%.
Chart 12
Geographical distribution of the value of fraud using cards issued worldwide by transaction channel from an acquiring perspective
(value of fraud by channel as a share of total fraud)
Source: All reporting card payment scheme operators, 2019.
Note: EA19 stands for the euro area as a whole.
Both card use and fraud levels varied considerably across EU countries in 2019.
Most of the significant card markets with relatively high transaction values and a relatively high number of cards per inhabitant (e.g. Luxembourg, the United Kingdom, Denmark and Ireland) experienced higher fraud rates. This was predominantly CNP fraud (see Chart 11) and related to cross-border transactions (see Table 1). At the same time, France and Spain also show relatively high fraud shares compared with other countries, despite having slightly more moderate card markets.
In countries where card use in general is relatively low (e.g. Hungary, Poland and Romania), fraud shares were typically also at the lower end. The low card usage in these countries aids fraud detection efforts and targeted prevention measures. In addition, the migration from magnetic stripe cards to EMV cards with dual interface (i.e. contact chip plus contactless antenna), along with an increased roll-out of EMV-enabled POS and ATM terminals, has helped to reduce card-present fraud in recent years.
Table 2
Card use, transaction and fraud levels from an issuing perspective

Source: ECB.
Notes: Data on cards, inhabitants, transactions per card and transactions per inhabitant are taken from the ECB Statistical Data Warehouse (SDW); data on fraud and fraud per transaction were collected for oversight purposes by all reporting card payment scheme operators for 2019. The fraud/transaction indicator is therefore constructed using data from the same source. No data on the total number of cards are available for Malta, Ireland or Slovakia in the SDW for 2019. Values are in euro. The cells are colour coded: green indicates high card usage or low levels of fraud; red indicates low card usage or high levels of fraud; darker colours indicate extreme values. Each column is formatted independently. EA19 stands for the euro area as a whole.
Table 2 provides an overview of the most relevant card payment and fraud figures across EU countries (ranked by fraud as a share of the total value of transactions).[16]
Table 3 shows fraud levels by country and main types of fraud in 2019, together with relative changes compared with the year before.
Both levels and trends in fraud differed significantly across countries in 2019. Nevertheless, with the exception of France and Spain, most countries with relatively higher levels of fraud as a share of total value of transactions experienced declines compared with 2018. In contrast, several countries with relatively very low fraud shares saw these grow in 2019. Consequently, variation in fraud shares across countries declined slightly in 2019.
Turning to trends in different types of fraud, the vast majority of countries continued to experience declines in the share of ATM counterfeit card fraud in the total value of transactions, thanks to the global implementation of EMV standards, which has reduced the value of fraudulent cross-border transactions acquired outside SEPA. While several countries saw similar trends in counterfeit fraud at POS terminals, some with relatively higher fraud shares experienced notable increases in the relative importance of this type of fraud. Lost-and-stolen card fraud continued to be the main source of card-present fraud, in particular among countries with higher relative levels of fraud; changes in the relative importance of this type of fraud compared with 2018 varied considerably across countries.
Declines in the share of CNP fraud in the total value of transactions drove corresponding decreases in the overall fraud share among countries with relatively higher levels of fraud. Similarly, overall increases among countries with relatively low fraud shares were mostly in line with the corresponding changes in CNP fraud.
Fraud shares and growth rates for individual fraud categories are shown jointly in Table 3 to allow comparison between different types of fraud.
Table 3
Relative fraud levels and trends by channel and category from an issuing perspective

Source: All reporting card payment scheme operators, 2018 and 2019.
Notes: The fraud rate for France calculated from the data collected for this report differs from the fraud rate according to the Banque de France’s own data (0.00064 according to the 2019 Annual Report of the Observatory for the Security of Payment Means) owing to inconsistencies in the collection of data on domestic transactions and fraud. The fraud rate for Denmark is also slightly higher compared with statistics available at Danmarks Nationalbank (0.00035), due to slight differences in the reporting basis. The cells are colour coded: green indicates low fraud shares or reductions thereof; red indicates high fraud shares or increases thereof; darker colours indicate more extreme values. EA19 stands for the euro area as a whole.
Box 2
Enhanced fraud reporting for all payment service providers
The ECB cooperates closely with the EBA to ensure that payment fraud is reported by all European payment service providers consistently and with sufficient detail to make it possible to assess trends in payment fraud and the effectiveness of prevention measures. This cooperation is built on a two-step approach:
- First, the EBA, in close cooperation with the ECB, identified in the EBA Guidelines on fraud reporting under PSD2[17] statistical information to be collected for supervisory purposes from payment service providers, in line with the requirements set out in Article 96(6) of the revised Payment Services Directive (PSD2).
- Second, the ECB has included these requirements in a larger data collection under the ECB Regulation on payments statistics,[18] which serves the oversight of payment systems and payment schemes along with other central bank functions, such as monetary policy. The corresponding amendment to the ECB Regulation on payments statistics was adopted by the Governing Council in December 2020, with reporting to commence in 2022 for data relating to the first half-year of 2022 onwards.
The newly collected data will cover various means of payments (credit transfers, direct debits, card payments, cash withdrawals, e-money transactions, remittances), along with more detailed information on the type of fraud, the payment initiation channel and whether strong customer authentication was applied.
It is expected that the enhanced collection, once sufficiently mature, will allow a more detailed assessment of the effectiveness of recent regulatory measures such as the Regulatory Technical Standards for strong customer authentication and common and secure open standards of communication. It should also provide valuable insight into changes in payment behaviour (e.g. increased use of cards to purchase goods online) and their implications for the risk of fraud.
8 Outlook
A further reduction in CNP fraud rates in the EU is expected due to the implementation of the Regulatory Technical Standards for strong customer authentication and common and secure open standards of communication under PSD2 by all issuers, acquirers and merchants. These enhanced security standards for payment service providers were drafted by the EBA and the ECB, published by the European Commission in November 2017 and entered into force in September 2019, with a subsequent EBA Opinion postponing the deadline for implementation for e-commerce card-based payment transactions to 31 December 2020. The Eurosystem expects overseen card payment schemes to observe the related oversight standards and support and require participants to comply with the applicable legislation for performing strong customer authentication. The overseers, together with the supervisors (who are the competent authorities for payment service providers such as issuers and acquirers), are monitoring the application of strong customer authentication by the industry and associated fraud developments.
The Eurosystem will continue to observe trends in the fraud landscape and the security of card payments, taking relevant action where needed. Collection of more detailed and comprehensive information from payment service providers on card fraud under the recently amended ECB Regulation on payments statistics and PSD2 will further support the Eurosystem in this important task (see Box 2).
Annexes
Glossary of terms
Acquiring country – The country of the card transaction beneficiary. For card-present transactions, the acquiring country is determined by the location of the ATM or POS terminals used. For CNP transactions, the acquiring country is determined by the country where the merchant (or the respective subsidiary) is legally incorporated.
Card fraud – No definition of card fraud is provided for the purpose of these statistics. Card payment schemes are required to report card fraud as defined in their own rules and procedures.
Card function – For the purpose of these statistics, reporting entities differentiate between cards with the following functions:
- a debit function
- a delayed debit function or a credit function
Card-not-present (transactions or fraud) – For the purpose of these statistics, cashless transactions via channels other than ATM and POS are “card-not-present” (CNP) transactions. This refers to “remote transactions” as defined by the SEPA cards framework: any transaction where either the card, the cardholder, or the merchant are not present in the same place at the time the instruction for payment for the transaction is given by the cardholder. Examples include mail order, telephone order, e-commerce.
Card-present (transactions or fraud) – For the purpose of these statistics, card-present transactions refer to ATM withdrawals and POS transactions.
Card with a credit function – A card enabling the cardholder to make purchases charged to an account with the card issuer with a regularly credit facility. The credit granted can be settled in full by the end of a specified period, or settled in part with the balance taken as extended credit on which interest is usually charged. The distinguishing feature of a card with a credit function, as compared with a card with a debit or delayed debit function, is the contractual agreement whereby the cardholder is granted a credit line and allowed to draw extended credit (irrespective of whether the cardholder actually makes use of this feature or chooses to settle the full amount of the debt incurred at the end of the specified period).
Card with a debit function – A card enabling the holder to have their purchases charged directly and immediately to their account, whether this account is held with the card issuer or not. A card with a debit function may be linked to an account offering overdraft facilities as an additional feature. The distinguishing feature of a card with a debit function, as compared with a card with a credit or delayed debit function, is the contractual agreement whereby the cardholder’s purchases are charged directly to the funds on their current account.
Card with a delayed debit function – A card enabling the holder to have their purchases charged to an account with the card issuer. The balance on this account is then settled in full at the end of a specified period. The distinguishing feature of a card with a delayed debit function, as compared with a card with a credit or debit function, is the contractual agreement whereby the cardholder is granted a credit line but is obliged to settle the full amount of the debt incurred at the end of the specified period.
Cross-border transaction – A transaction where the issuing and acquiring countries are different.
Domestic transaction – A transaction where the issuing and acquiring countries are the same.
Issuing country – The country of the card issuer.
Methodological considerations
Two methodological data issues already identified in the reporting several years ago continue to apply, namely that some card payment scheme operators (i) allocate transactions with cards issued cross-border to the country of issuance as opposed to the location of the issuer, and (ii) allocate CNP transactions acquired cross-border by location of the acquirer instead of by location of the merchant. These divergences result in inconsistencies between data collected from the card payment schemes and similar data reported by payment service providers for ECB Statistical Data Warehouse purposes. Given that these inconsistencies are limited to a few specific schemes and countries, they have been accepted for this report.
In addition, some adjustments have been made to data reported to avoid double counting domestic transactions where cards are co-badged.[19] For a few countries, such as France, these adjustments may result in under-reporting of total transactions and thus a slightly over-estimated fraud rate. This discrepancy has also been considered acceptable for this report. In the case of France, the resulting deviations in the fraud share compared with data collected by the Banque de France have been highlighted throughout the report.
© European Central Bank, 2021
Postal address 60640 Frankfurt am Main, Germany
Telephone +49 69 1344 0
Website www.ecb.europa.eu
All rights reserved. Reproduction for educational and non-commercial purposes is permitted provided that the source is acknowledged.
For specific terminology please refer to the ECB glossary (available in English only).
PDF ISBN 978-92-899-4874-6, ISSN 2315-0033, doi:10.2866/793033, QB-BI-21-001-EN-N
HTML ISBN 978-92-899-4875-3, ISSN 2315-0033, doi:10.2866/603420, QB-BI-21-001-EN-Q
- Unless otherwise specified, total figures in this report (transactions, fraud, fraud shares) refer to values and cover the SEPA perspective from an issuing point of view. Country-based tables throughout the report reflect EU Member State figures. On occasions, where relevant, the euro area total figures (EA19) are also provided.
- The general information on card usage, data collection methodology and classification provided in the first report on card fraud is not repeated in this version (see “Report on Card Fraud”, ECB, July 2012).
- The “issuing country” is the country of the card issuing payment service provider.
- The “acquiring country” is the country of the card transaction beneficiary. For card-present transactions, the acquiring country is determined by the location of the ATM or POS terminal used. For CNP transactions, the acquiring country is determined by the country where the merchant (or the respective subsidiary) is legally incorporated.
- The same trend is observed with respect to fraud volumes, although ATM fraud was even less prevalent in terms of volumes, while card-present fraud at POS terminals was more common.
- Most implementations of chip-and-PIN are based on EMV as the industry standard for card transactions at POS terminals and ATMs.
- Source: EMVCo Worldwide EMV Deployment Statistics, 2018-20.
- Guidelines on fraud reporting under PSD2
- American Express, BANCOMAT S.p.A., Bancontact, BNP Paribas Personal Finance, Cartes Bancaires, CashlinkMALTA, Cofidis, Cofinoga, Crédit Agricole Consumer Finance, Dankort, Diners Club International, Franfinance, girocard, JCB International, Karanta, MasterCard Europe, Oney Bank, SIBS’ MB, Sistema de Tarjetas y Medios de Pago S.A. (STMP), UnionPay and Visa Europe.
- The growth rates are not influenced by variations in data provision, and the baseline fraud amounts used in the calculation of the share come from the same schemes and comparable data.
- In general, volume figures are less accurate than value figures, and some small card schemes do not report them completely. While their quality and completeness has improved with time, overall percentage increases over the five-year period analysed should be treated with caution.
- As stated above, reported volumes are less accurate than corresponding value figures, in particular with regard to the total number of transactions reported by some smaller card schemes. Consequently, average transaction and fraud amounts may not be fully accurate and reliable.
- The analysis presented in this chapter excludes payments with cards issued in France and Spain, which are partially reported in aggregate without distinguishing by card function.
- From an issuing perspective, some card payment schemes split their data by the country of issuance of a card, i.e. the country where the card programme is sold (including cross-border issuing), while others report by the country in which the card issuer is domiciled. This may lead to discrepancies for some countries (e.g. Luxembourg).
- Some adjustments have been made to the data reported for France to avoid double counting of domestic transactions where cards are co-badged by both an international and a domestic card payment scheme. These adjustments resulted in an under-reporting of total domestic transactions and thus a slight over-estimation of the fraud rate. Consequently, the 2019 fraud rate calculated for France differs from the rate published in the 2019 Annual Report of the Observatory for the Security of Payment Means (0.064%).
- Although the United Kingdom left the EU on 31 January 2020, it is still included in the overview across EU countries presented in this chapter, which refers to data for 2019.
- These Guidelines where published in 2018 and entered into force in January 2019. They were revised in January 2020, with the revisions taking effect from 1 July 2020.
- Regulation (EU) 2020/2011 of the European Central Bank of 1 December 2020 amending Regulation (EU) No 1409/2013 on payments statistics (ECB/2013/43) (ECB/2020/59).
- A co-badged card is a card where there are two badges on the card, two payment schemes, two payment propositions and two liable parties for each part, but they share the same physical plastic card.