
Continued decline in 2012 in the number of monetary financial institutions in the euro area and in the EU
On 1 January 2013 the total number of monetary financial institutions (MFIs)[1] in the euro area stood at 7,059. This is a net decrease of 474 units (-6%) in comparison with the situation a year ago. With a few small exceptions, declines occurred across the whole of the euro area. In the European Union (EU) as a whole, there were 9,076 MFIs, a net decrease of 511 units
Number of MFIs
On 1 January 2013 there were 7,059 MFIs resident in the euro area, compared with 7,533 on 1 January 2012. In relative terms, the decrease was particularly pronounced in Slovakia (-30%), Luxembourg (-22%), France (-9%), Spain and Finland (both -8%). In absolute terms, Luxembourg (-124), France (-105) and Italy (-55) were the main contributors to the net decrease of 474 units in the euro area.
Since 2011 a substantial decrease in the number of money market funds (an MFI sub-sector) has been recorded in the European Union (-519 over two years), partly on account of their new definition under Guideline ECB/2011/13, which is more closely in line with that used for supervisory purposes. In addition, the contraction in this sub-sector continued during 2012, most prominently in Luxembourg (-128) and France (-84).
Despite the enlargement of the euro area through the accession of Greece (2001), Slovenia (2007), Cyprus and Malta (both 2008), Slovakia (2009) and Estonia (2011), the number of MFIs in the euro area has decreased by 28% or 2,797 institutions since 1 January 1999. On 1 January 2013 Germany and France accounted for 42% of all euro area MFIs, approximately the same share as recorded on 1 January 2012.
On 1 January 2013 there were 9,076 MFIs resident in the EU, a net decrease of 511 units (-5%) since 1 January 2012. Compared with the situation on 1 January 1999, when there were 10,909 MFIs in the EU, there has been a net decrease of 1,833 units (-17%), despite the addition of 1,608 MFIs on 1 May 2004, when ten new Member States acceded, and of a further 72 MFIs on 1 January 2007, when Bulgaria and Romania joined the EU.
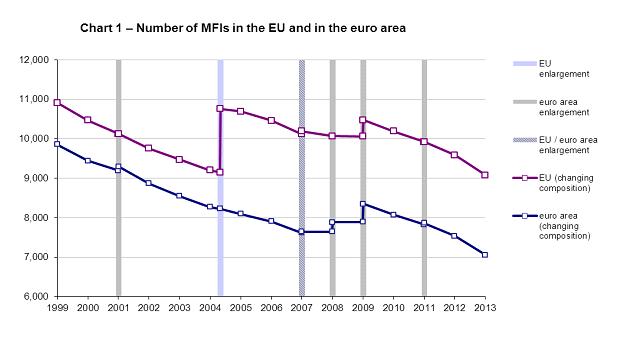
Note: The net increase in the number of MFIs in 2009 was caused by significant reclassifications in two member states; on the other hand the reduction in 2011 was influenced by the introduction of a common definition for European money market funds (Guideline ECB/2011/13), which inversely led to the reclassification of certain funds formerly recognised as money market funds.
Structure of the MFI population
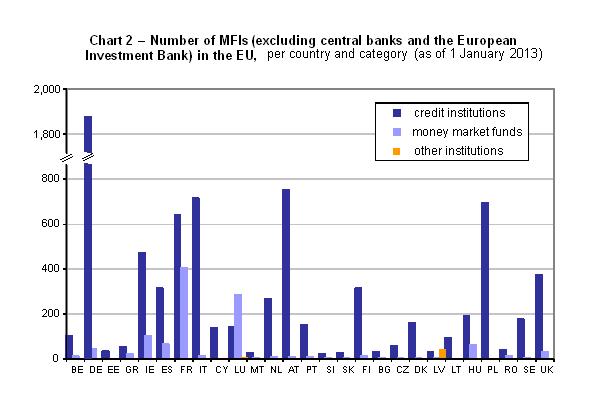
The vast majority of euro area MFIs are credit institutions (i.e. commercial banks, savings banks, post office banks, credit unions, etc.), which accounted for 85.5% of MFIs (6,019 units) on 1 January 2013, while money market funds accounted for 14.0% (987 units). Central banks (18 units including the ECB) and other institutions (35 units) together accounted for only 0.2% of the total number of euro area MFIs.
In the EU as a whole, credit institutions accounted for 86.8% of MFIs on 1 January 2013, while money market funds accounted for 12.2% (see Chart 2 below).
Country breakdown on 1 January 2013
In the euro area, Germany and France accounted for 41.9% of all MFIs. Italy, Austria, Ireland and Luxembourg accounted for a further 35.3%. Over the past 14 years (1999-2013) noteworthy developments in national MFI sectors have included a significant increase of 477 units in Ireland over the period as a whole. [2] At the same time there were relatively large falls of 59%, 46% and 42% respectively in the number of MFIs in the Netherlands, France and Germany and lesser declines in Spain (37%), Luxemburg (36%), Portugal (30%), Greece (27%) and Belgium (24%; see Table 1 below).
Among the non-euro area EU Member States, Poland had the largest number of MFIs (696), representing 8% of MFIs in the EU, or 35% of MFIs in the non-euro area EU Member States. The other main contributors to the number of MFIs in non-euro area EU Member States were the United Kingdom (20%), Hungary (12%), Sweden (9%) and Denmark (8%). Between the beginning of 1999 and 1 January 2013, there were considerable reductions in the number of MFIs in the United Kingdom and Denmark, by 27% and 24% respectively.
Foreign branches
On 1 January 2013 there were 623 branches of non-domestic credit institutions resident in the euro area. These branches accounted for 10% of all euro area credit institutions. 107 of these branches (17%) were located in Germany. Belgium, Estonia, Slovakia and Greece had the largest number of foreign branches as a proportion of the total number of credit institutions, at 58%, 50%, 50% and 42% respectively. The head offices of the majority of the foreign branches in euro area countries were located either in another euro area country (62%) or in the United Kingdom (16%).
On 1 January 2013 there were 259 branches of foreign credit institutions resident in non-euro area EU Member States. Of these, by far the largest proportion (51%) was located in the United Kingdom. The head offices of the majority of the foreign branches in non-euro area EU Member States were located either in euro area countries (53%) or in other EU Member States (19%).
| Country | Number of MFIs | Percentage changes | |||||||
|---|---|---|---|---|---|---|---|---|---|
| 1 Jan. 1999 | 1 Jan. 2001 | 1 May 2004 | 1 Jan. 2011 | 1 Jan. 2012 | 1 Jan. 2013 | 1 Jan. 1999 to 1 Jan. 2013 | 1 May 2004 to 1 Jan. 2013 | 1 Jan 2012 to 1 Jan. 2013 | |
| ECB | 1 | 1 | 1 | 1 | 1 | 1 | - | - | - |
| EIB* | - | - | - | 1 | 1 | 1 | - | - | - |
| BE | 153 | 142 | 126 | 123 | 122 | 117 | -23.5 | -7.1 | -4.1 |
| DE | 3,280 | 2,782 | 2,268 | 1,999 | 1,956 | 1,916 | -41.6 | -15.5 | -2.0 |
| EE | - | - | 25 | 37 | 37 | 35 | - | 40.0 | -5.4 |
| GR | 102 | 105 | 100 | 83 | 79 | 75 | -26.5 | -25.0 | -5.1 |
| IE | 96 | 211 | 294 | 696 | 590 | 573 | 496.9 | 94.9 | -2.9 |
| ES | 608 | 571 | 512 | 413 | 415 | 381 | -37.3 | -25.6 | -8.2 |
| FR | 1,938 | 1,764 | 1,577 | 1,206 | 1,147 | 1,042 | -46.2 | -33.9 | -9.2 |
| IT | 944 | 884 | 854 | 808 | 785 | 730 | -22.7 | -14.5 | -7.0 |
| CY | - | - | 409 | 153 | 143 | 139 | - | -66.0 | -2.8 |
| LU | 676 | 662 | 586 | 602 | 554 | 430 | -36.4 | -26.6 | -22.4 |
| MT | - | - | 17 | 32 | 33 | 34 | - | 100.0 | 3.0 |
| NL | 668 | 620 | 484 | 300 | 297 | 276 | -58.7 | -43.0 | -7.1 |
| AT | 910 | 866 | 827 | 806 | 783 | 761 | -16.4 | -8.0 | -2.8 |
| PT | 228 | 223 | 205 | 164 | 159 | 160 | -29.8 | -22.0 | 0.6 |
| SI | - | - | 27 | 28 | 29 | 28 | - | 3.7 | -3.4 |
| SK | - | - | 28 | 43 | 44 | 31 | - | 10.7 | -29.5 |
| FI | 354 | 362 | 396 | 370 | 358 | 329 | -7.1 | -16.9 | -8.1 |
| Euro area** | 9,856 | 9,193 | 8,230 | 7,865 | 7,533 | 7,059 | -28.4 | -14.2 | -6.3 |
| BG | - | - | 36 | 37 | 37 | - | - | 0.0 | |
| CZ | - | - | 79 | 67 | 67 | 61 | - | -22.8 | -9.0 |
| DK | 216 | 213 | 206 | 164 | 164 | 164 | -24.1 | -20.4 | 0.0 |
| LV | - | - | 52 | 76 | 72 | 72 | - | 38.5 | 0.0 |
| LT | - | - | 74 | 90 | 95 | 96 | - | 29.7 | 1.1 |
| HU | - | - | 238 | 246 | 251 | 251 | - | 5.5 | 0.0 |
| PL | - | - | 659 | 710 | 703 | 696 | - | 5.6 | -1.0 |
| RO | - | - | 55 | 55 | 53 | - | - | -3.6 | |
| SE | 179 | 177 | 255 | 205 | 205 | 182 | 1.7 | -28.6 | -11.2 |
| UK | 556 | 541 | 457 | 407 | 405 | 405 | -27.2 | -11.4 | 0.0 |
| EU** | 10,909 | 10,124 | 10,756 | 9,921 | 9,587 | 9,076 | -16.8 | -15.6 | -5.3 |
* For the ECB's monetary and other euro area statistics, the EIB continues to be treated as an institution that is resident outside the euro area.
** Changing composition.
Notes:
The number of MFIs is derived from the ECB’s “List of monetary financial institutions”, which is updated daily on the ECB’s website and is compiled in such a way as to ensure its completeness, accuracy and homogeneity across countries. Its objectives are twofold, namely (i) to serve as the reference reporting population for the compilation of comprehensive and consistent monetary statistics for the euro area and (ii) to serve as a register and a reliable sampling frame for other data collections and for statistical and economic analyses.
Information on MFIs and other financial institutions, including the list of monetary financial institutions and institutions subject to minimum reserves, can be found on the ECB’s website.
-
[1]“Monetary financial institutions” (MFIs) are central banks, resident credit institutions as defined in European Union law, and other resident financial institutions whose business is to receive deposits and/or close substitutes for deposits from entities other than MFIs and, for their own account (at least in economic terms), to grant credits and/or make investments in securities (including electronic money institutions that are principally engaged in financial intermediation in the form of issuing electronic money). Money market funds are also classified as MFIs.
-
[2]The overall increase includes 419 units which resulted from the reclassification of Irish credit unions as credit institutions as of 1 January 2009.
Evropská centrální banka
Generální ředitelství pro komunikaci
- Sonnemannstrasse 20
- 60314 Frankfurt am Main, Německo
- +49 69 1344 7455
- media@ecb.europa.eu
Reprodukce je povolena pouze s uvedením zdroje.
Kontakty pro média