

- SPEECH
The complexity of monetary policy
Keynote speech by Fabio Panetta, Member of the Executive Board of the ECB, at the CEPR-EABCN conference on “Finding the Gap: Output Gap Measurement in the Euro Area” held at the European University Institute
Florence, 14 November 2022
The output gap – the difference between actual and potential output[1] – plays an important conceptual role in central banking.
In normal conditions, the output gap represents a gauge of inflationary pressure by signalling the amount of slack in the economy.[2] In turn, this provides a yardstick against which central banks calibrate monetary policy. By steering demand so that actual output matches potential central banks can stabilise inflation around their targets.
From the global financial crisis until the start of the pandemic, variations in the output gap reflected prominently the role played by demand factors.
The implication for monetary policy was relatively straightforward. The shocks to demand pushed output, employment and inflation in the same direction, leading to a positive correlation between output gaps and inflation. Monetary policy could aim to close the inflation gap without facing major trade-offs in terms of the output gap.
Central banks ultimately faced the difficulty, not so much of diagnosing, but of delivering: once inflation fell too low, their conventional instruments were constrained as interest rates approached their lower bound.[3] Central banks had to deploy non-standard policy tools to lift demand.
Today we are in a new environment. The economy is experiencing large, negative supply shocks pushing output and inflation in opposite directions. The correlation between estimated output gaps and inflation has become more blurred and uncertain than in the past. And the trade-offs facing monetary policy have become more complicated.
In other words, monetary policy has become significantly more complex.
In designing the appropriate monetary policy response, central banks need to make two key judgements: one on the origin of the shocks hitting the economy and another on their persistence.
I will argue today that euro area inflation has been driven by soaring energy prices and enduring supply constraints even as the economy reopened after the crisis phase of the pandemic, unleashing pent-up demand. But the boost to demand from the reopening is fading, and we have no evidence as yet that supply shocks are having large and permanent effects on output potential. And if supply shocks durably lowered potential, our policy response would have to consider that they also affect demand by depressing current and future real income.
Against such a backdrop, monetary policy has to ward off the risk of a de-anchoring of inflation expectations, which could lead to second-round effects in the form of excessive wage and price-setting dynamics. That implies adjusting monetary conditions and frontloading rate hikes.
But so long as expectations remain anchored, the calibration of our policy adjustment should take into account the unprecedented uncertainty of the post-pandemic world. If we were too hasty and mistaken in concluding that supply shocks have durably depressed potential output, we may subject the economy to excessive tightening. If not corrected quickly, this could result in a permanent loss of output as productive capacity adjusts to significantly and persistently lower demand.[4] And that scar may prove difficult to heal.
Being prudent does not rule out the possibility of us having to move from withdrawing accommodation to restricting demand. But in the absence of clear second-round effects, we would need convincing evidence that the current shocks are likely to keep having a more adverse effect on supply than on demand.
This balancing act – weighing the various factors at play in a forward-looking way – is the ultimate purpose of projections and policy judgement alike. Models and measurements should be challenged and improved – indeed, this is what this conference is about – but selective anecdotal evidence is certainly not a better guide. Our policy decisions should continue to be informed by comprehensive analysis of the data; there is simply no substitute for that.
The origin of the shocks
The origin of the shocks – that is, whether they originate more on the demand side or on the supply side – matters considerably for monetary policy. A central bank would typically want to adjust policy gradually in the face of supply shocks.[5] But it should react immediately to demand shocks that risk bringing medium-term inflation above target.
This question is crucial today because the shocks that have hit the euro area economy in recent years have affected both demand and supply, making the main drivers of inflation harder to identify.
We have faced both a series of external supply shocks[6] and a deterioration in the terms of trade which have pushed up costs for firms and weakened demand. This has resulted in an extraordinary rise in energy and food prices, especially after Russia’s invasion of Ukraine. Together, energy and food currently directly account for more than two-thirds of headline inflation (Chart 1).
Chart 1
Contributions of components of euro area headline HICP inflation
(annual percentage changes and percentage points contributions)

Sources: Eurostat and ECB calculations.
Notes: NEIG stands for “non-energy industrial goods”. The latest observation is for October 2022.
At the same time, the consumption items benefitting most from the reopening of the economy have made an increasingly relevant contribution to core inflation over time (Chart 2). The combination of this positive pent-up demand shock, pandemic-related supply disruptions and soaring energy prices has provoked a much faster and stronger pass-through of cost pressures, especially energy costs, into domestic inflation than in the past. Indeed, items with a high share of energy in direct costs currently account for around half of the inflation in services and non-energy industrial goods.[7] We have also seen firms react to the threat of shortages by ordering more and earlier than usual, which has in turn pushed up inflation along the pricing chain, a phenomenon known as the “bullwhip effect”.[8]
Chart 2
Decomposition of HICP inflation excluding energy and food
(annual percentage changes and percentage points contributions)
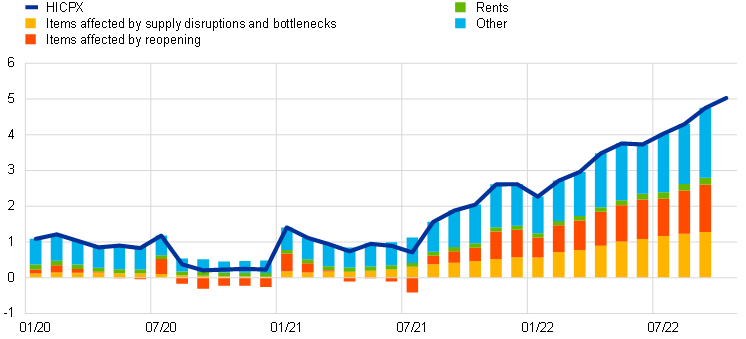
Sources: Eurostat and ECB calculations. See Gonçalves, E. and Koester, G. (2022), “The role of demand and supply in underlying inflation – decomposing HICPX inflation into components”.
Notes: Items affected by supply disruptions and bottlenecks comprise new motor cars, second-hand motor cars, spare parts and accessories for personal transport equipment, and household furnishings and equipment (including major household appliances). Items affected by the reopening of the economy comprise clothing and footwear, recreation and culture, recreation services, hotels/motels, and domestic and international flights. The latest observations are for October 2022 (flash) for HICPX and September 2022 for the rest.
The nature of the shocks has also been blurred on the labour market side by governments’ policy response to the pandemic. It has shielded employment from swings in demand through job retention schemes.[9] And it has led to an increase in public sector employment (Chart 3), especially in healthcare and education.[10]
Chart 3
Euro area employment across sectors
(index: Q4 2019 = 100)

Source: ECB staff calculations based on Eurostat data.
Note: The latest observations are for the first quarter of 2022.
As a result, the output and unemployment gaps are giving different signals today. According to our projections, real GDP is expected to remain below its pre-pandemic path over the projection horizon, whereas the labour market is expected to remain resilient.[11]
However, the relative contributions of supply and demand conditions are likely to change over time.
In particular, the release of pent-up demand largely explains the recent contribution of demand to inflation. This is different from a cyclical upswing that “feeds on itself”[12], or a sustained increase in consumption as seen in the United States as a result of a highly expansionary fiscal policy and rapidly rising wages (Chart 4, panel a). That is why, in the euro area, the demand-driven contribution to core inflation has emerged more slowly over time (Chart 4, panel b). But forward-looking indicators point to a significant weakening in demand, which suggests that its contribution is likely to fade out (Chart 5).
Chart 4
Evolution of private consumption and demand-driven contributions to core inflation in the euro area and the United States
(percentage points contributions)
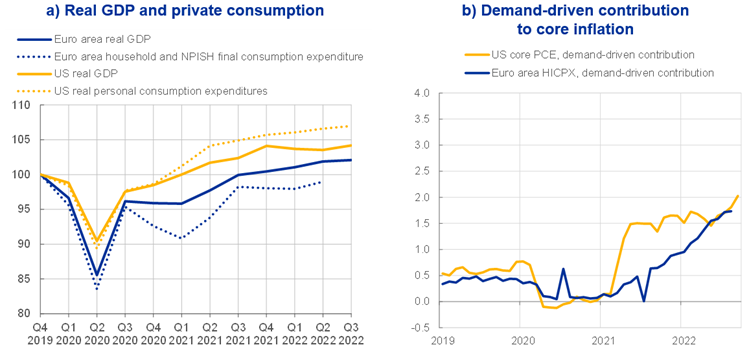
Sources: Panel a): Eurostat, FRED and ECB staff calculations. Panel b): FRSF/Adam Shapiro, Eurostat and ECB staff calculations.
Notes: Panel a): the latest observation is for the third quarter of 2022, except for euro area household and non-profit institutions serving households (NPISH) final consumption expenditure for which the latest observation is for the second quarter of 2022. Panel b): seasonally adjusted series; based on an application of Shapiro, A.H. (2022), “How Much Do Supply and Demand Drive Inflation?”, FRBSF Economic Letter, No 2022-15, Federal Reserve Bank of San Francisco, 21 June; and Shapiro, A.H. (2022), “Decomposing Supply and Demand Driven Inflation”, Working Papers, No 2022-18, Federal Reserve Bank of San Francisco, October. For euro area results see Gonçalves, E. and Koester, G. (2022): “The role of demand and supply in underlying inflation – decomposing HICPX inflation into components”, Economic Bulletin, Issue 7, ECB. The latest observations are for August 2022 for the euro area and September 2022 for the United States.
Chart 5
Euro area household expectations and Purchasing Managers’ Index
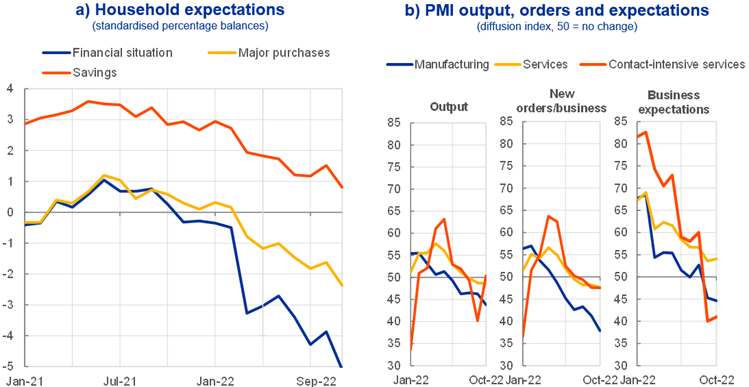
Sources: Panel a): DG-ECFIN and ECB staff calculations. Panel b): S&P Global.
Notes: Panel a): expectations for the next 12 months, standardised over the period January 1985 to December 2019. The latest observation is for September 2022. Panel b): the latest observation is for October 2022.
And as the weakening in demand is likely to rapidly slow down GDP growth while the boost from the reopening of the economy abates, evidence suggests adverse supply and energy shocks will continue to depress output (Chart 6). Similarly, the contribution of supply shocks to inflation is likely to endure in the coming months, as a result of the lagged effect of previous bottlenecks and the staggered pass-through of wholesale energy costs into retail bills.
Chart 6
GDP response to demand and supply shocks
(y-axis: percentage change in response to one-standard deviation demand and supply shocks, x-axis: months)
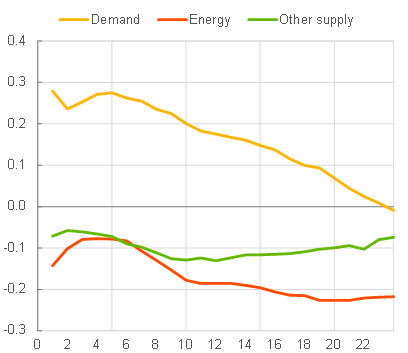
Sources: ECB staff calculations.
Notes: The Bayesian SVAR includes monthly interpolated GDP, HICP, ten-year OIS rate, HICP energy and PMI suppliers’ delivery times. The SVAR is estimated using the Minnesota prior with the dummy coefficient prior. Shocks are identified using sign and narrative restriction methods. Technical details on the method can be found in De Santis, R. A. and Van der Veken, W. (2022), “Deflationary Financial Shocks and Inflationary Uncertainty Shocks: An SVAR Investigation”, Working Paper Series, No 2727, ECB.
This leads me to believe that supply factors will remain, overall, the dominant determinant of inflation going forward.
The persistence of the shocks
When inflation is driven mainly by supply shocks, monetary policy should respond when the shocks are persistent to keep inflation expectations anchored and avoid that inflation becomes entrenched. Understanding the reasons for the persistence of current shocks and whether they may permanently lower potential is also crucial for designing the adequate policy response.
There are two alternative explanations for the persistence of the supply shocks we have experienced.
The first is that the economy has been hit by a sequence of temporary supply shocks, which have jointly created a persistent effect on inflation. In this case, potential output should remain broadly unchanged. And the lingering effect of the supply shocks on economic activity through real incomes and confidence could result in a negative output gap.
The second explanation is that the pandemic and the war could have triggered or accelerated structural changes – such as deglobalisation or a more costly energy mix – which have permanently lowered potential output. In these circumstances, the economy could be overheating even though real GDP remains well below its pre-pandemic path (Chart 7). In other words, by lowering potential output the supply shocks could have created excess demand and hence a positive output gap, which would justify a more restrictive policy stance.
Chart 7
Euro area real GDP
(index 2014 = 100)
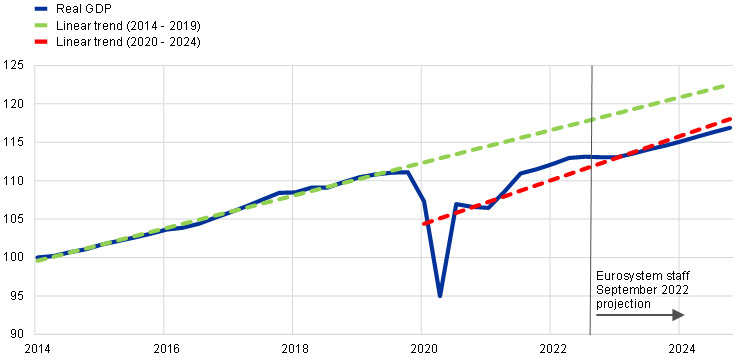
Sources: ECB staff macroeconomic projections and calculations.
Distinguishing between these two possible explanations in real time is no easy task. Just as for the origins of the shocks, it requires a close look at the evidence.
One way of doing this is by looking at output gap estimates. Estimates from major forecasting institutions show some dispersion, but point in a similar direction: they all foresee a negative output gap in 2023 that does not fully close in 2024 (Chart 8).[13] With regard to the current situation, estimating revisions of potential output in real time is tricky[14] but the latest European Commission estimates foresee potential growth at 1.2% in 2023 and 1.3 % in 2024, with the level of potential output in 2024 being 5.6% higher than in 2019.
Chart 8
Euro area output gap
Measures of the euro area output gap across a suite of models
(percentage of potential output)
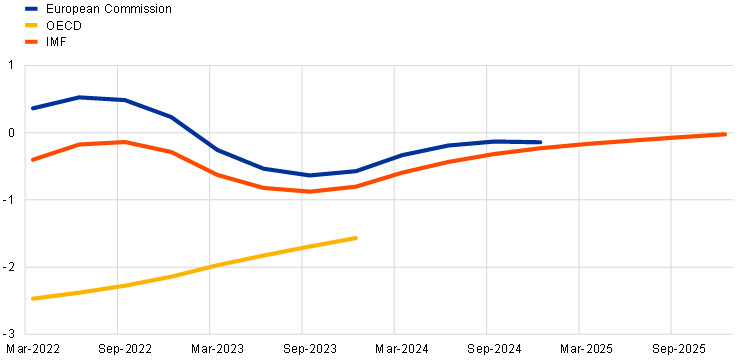
Sources: European Commission’s Autumn 2022 European Economic Forecast, OECD’s June 2022 Economic Outlook and IMF’s November 2022 World Economic Outlook. Quarterly estimates are interpolated from annual data.
An alternative way of analysing whether supply capacity has fallen is to examine the possible effects of individual adverse supply shocks.
ECB staff recently conducted a series of studies which suggest that shocks analogous to those seen in recent months are likely to have limited effects on potential. The studies found that even significant hypothetical negative shocks such as deglobalisation[15] – and the associated global supply chain disruptions – or a permanent and large increase in oil prices[16] would induce only a moderate downward revision in the level of potential output in the euro area after four years, ranging from -0.3% in the first case to -0.8% in the second compared to the baseline scenario without these shocks.[17] These effects need to be set against a projected cumulative increase in potential output of around 5% over the same period, as estimated by the European Commission.
Similarly, analyses focusing on the euro area labour market suggest that the shocks we have seen in recent years – in particular, the pandemic – do not seem to have left lingering scars on labour supply and potential output, for instance, by triggering early retirement.[18]
As always, such estimates are surrounded by considerable uncertainty. But at this stage, they do not support the view that we are or will be facing a large positive output gap.
Overall, my reading of the available evidence so far is that we cannot say – with sufficiently high confidence – that we are facing a large and permanent loss of potential.
Implications for monetary policy
My primary objective today is to illustrate the difficulties and the risks policymakers must contend with when assessing supply and demand dynamics in real time, as well as the implications of these dynamics for the medium-term inflation outlook.
I will nonetheless offer some reflections on how the previous analysis is influencing my thinking on monetary policy in an uncertain economic environment.
There is a common argument today that monetary policy faces asymmetric risks. If policy overreacts to inflation, it can always undo the damage later. But if it underreacts, and inflation gets out of control, it will have to subject the economy to a harder and more costly tightening to rein inflation back in.
There are limits to this argument.
Monetary policy certainly needs to adjust – even if the output gap is negative – because the risk of second-round effects has become too great. However, I also believe that given the uncertainty we are facing, the calibration of our monetary policy stance must remain evidence-based and focused on the medium-term inflation outlook.[19] And after the progress we have already done in adjusting our policy stance, an aggressive tightening is not advisable, for two main reasons.
First, conducting monetary policy based on the view that potential is permanently lower – without clear evidence that this is the case – could prove self-fulfilling and costly. The evidence increasingly shows that destroying demand also affects supply. Research on recessions over the last fifty years has found that deep contractions – including those driven by monetary policy – lead to long-lasting effects on real GDP compared to the pre-contraction trend.[20]
This suggests that current macroeconomic policies should be designed to avoid unnecessarily heightening the risk that the increasingly likely contraction in coming months becomes a severe and protracted one, which would scar the economy. This requires that energy and fiscal policies remain targeted and contribute to dampen inflationary pressures, helping to keep inflation expectations anchored while preserving productive capacity. But it also requires that monetary policy does not ignore the risks of overtightening.[21]
If we were to compress demand in an excessive and persistent manner, we would face the risk of also pushing output permanently below trend, irrespective of whether the initial shocks were temporary or not (that is, even if a harsh policy reaction was unnecessary). And that could not be easily reversed by subsequent policy easing, not least because expansions do not rebuild supply nearly as much as contractions destroy it.[22]
Second, even if we were to conclude that supply shocks will lower potential durably, we would still need to examine their effects on demand before deciding our policy stance.[23]
For instance, workers may accept some loss in real income as demand softens, costs can no longer be passed on easily to consumers and risks to job security increase. In some euro area countries, wage negotiations focus on core inflation rather than headline inflation. This can be seen as a recognition that the terms of trade loss has to be borne – at least to some extent – rather than retrieved.
Also, in this setting, households may choose to reduce consumption – instead of smoothing it and mitigating the hit to spending – because a permanently lower potential output would also permanently reduce their future income and wealth. Recent research using endogenous growth models shows that, if supply shocks cause “scarring”, the prospect of lower potential output reduces investment and productivity growth. By compressing households’ future income and their current spending, it can cause demand to drop by as much as – or even more than – supply.[24]
All told, these effects imply that, even in the face of lasting consequences of supply shocks on potential output, the implications for the output gap, inflation dynamics and optimal policy calibration can only be derived over time. And this reinforces the case that, for as long as inflation expectations remain anchored, monetary policy should adjust but not overreact.[25]
ECB staff projections published in September 2022, which foresee inflation close to 2% at the end of their horizon, are consistent with a withdrawal of monetary policy accommodation. But the uncertainty surrounding supply and demand dynamics requires us to remain prudent as regards how far the adjustment needs to go. And we should not ignore the fact that the tightening, which has followed from our decisions since the end of 2021 and from expectations of further adjustments in our stance, is already working its way through the economy – with the usual transmission lags. Estimates suggest that this tightening will on average subtract more than one percentage point from annual real GDP growth each year until 2024 compared to a counterfactual where interest rates and balance sheet expectations would have remained unchanged since December 2021.[26]
Conclusion
Let me conclude.
Inflation is high at the moment and the risks associated with this situation should not be underestimated. Monetary policy has to tighten to ensure that inflation does not become entrenched.
But the impact of the current shocks on the output gap is clearly unclear.
It would be misguided to base an aggressive tightening on assumptions which cannot be conclusively substantiated. The consequences of possible errors may not be perceptible today, but they would become evident over time. It may then be too late to fully reverse them.
Potential output can be defined as the highest level of economic activity that can be sustained by means of the available technology and factors of production, in particular labour and capital, without creating inflationary pressure. See Andersson, M., Szörfi, B., Tóth M. and Zorell, N. (2018), “Potential output in the post-crisis period”, ECB Economic Bulletin, Issue 7.
Slack is a proxy of the economy’s capacity to grow without straining resources and leading to excessive cost and price rises.
The likelihood of hitting the lower bound in a crisis had increased with the fall in nominal and real rates, which mainly reflected the success of monetary policy in anchoring inflation expectations and a fall in the natural (real) rate of interest. The latter was driven by ageing, waning productivity growth, a rise in mark-ups and a surge in risk aversion in the wake of the global financial crisis. See Brand, C., Bielecki, M. and Penalver, A. (eds.) (2018), “The natural rate of interest: estimates, drivers, and challenges to monetary policy”, Occasional Paper Series, No 217, ECB, December.
Demand shortfalls may perpetuate themselves, resulting in persistent or even permanent impacts on output (hysteresis), by adversely affecting the supply potential of the economy and thereby lowering the level of potential output or even its longer-term growth rate. For instance, firms may refrain from undertaking investment decisions or cut their innovation budgets. See Andersson, M. et al. (2018), op. cit. and Yellen, J.L., “Macroeconomic Research After the Crisis”, speech at the 60th annual economic conference sponsored by the Federal Reserve Bank of Boston, Boston, October 2016.
As supply shocks create a temporary trade-off between inflation and real activity, a gradual policy response avoids creating unnecessary volatility in growth and employment. See ECB (2021), “An overview of the ECB’s monetary policy strategy”, July.
These include global supply chain disruptions, zero-COVID policies, production cuts by oil exporting countries and the effects of the war in Ukraine on energy and commodity prices.
Panetta, F. (2022), “Mind the step: calibrating monetary policy in a volatile environment”, speech at the ECB Money Market Conference, Frankfurt am Main, 3 November, Chart 2.
Rees, D. and Rungcharoenkitkul, P. (2021), “Bottlenecks: causes and macroeconomic implications”, BIS Bulletin, No 48, 11 November.
In the second quarter of 2022, 0.7% of the euro area labour force was still enrolled in such schemes.
Consolo, A. and Dias da Silva, A. (2022), “The role of public employment during the COVID-19 crisis”, Economic Bulletin, Issue 6, ECB.
ECB (2022), ECB staff macroeconomic projections for the euro area, September.
Rudebusch, G. (2016), “Will the Economic Recovery Die of Old Age?”, FRBSF Economic Letter, No 2016-03, Federal Reserve Bank of San Francisco, 4 February.
For instance, the European Commission’s Autumn 2022 European Economic Forecast published on 11 November 2022 foresees that the output gap in the euro area closes in 2022 but turns negative again in 2023 and does not fully close in 2024.
For instance potential output level estimates for 2022, 2023 and 2024 were revised down in the European Commission’s Autumn 2022 European Economic Forecast compared to the Autumn 2021 European Economic Forecast (by 0.9%, 1.3% and 1.5% respectively) but remain higher compared to the Autumn 2020 European Economic Forecast. Potential output growth estimates for 2022, 2023 and 2024 in the European Commission’s Autumn 2022 European Economic Forecast also remain higher than the estimates in the Autumn 2019 and 2020 European Economic Forecasts. To put the size of the revisions to potential output in context, the European Commission estimates that potential output was 5% lower 5 years after the onset of the global financial crisis compared to the level it would have had if it had increased each year from 2008 to 2012 at the pre-crisis potential growth rate (that loss increased to more than 9% after 10 years). The European Commission’s Autumn 2022 European Economic Forecast estimates GDP to be 0.2% higher in 2024 than the level it would have had if it had increased each year from 2020 to 2024 at the 2019 potential growth rate, but 0.6 percentage points lower than the level implied by the Autumn 2019 European Economic Forecast. The potential output level in 2024 is therefore not estimated to be significantly different from the level that could be expected before the onset of the pandemic, with the sign of the change depending on the counterfactual used. This may reflect factors that have impacted potential growth in different directions: the pandemic and the recent shocks may have had a negative effect, while Next Generation EU investments and other policy measures in response to the pandemic may have had a positive effect, with the net effect being small.
The analysis assumes a drop in globalisation equal to half of that observed during the global financial crisis and a permanent, large fall of European firms’ participation in global value chains. See Le Roux, J. (2022), “How persistent supply chain disruptions could affect euro area potential output”, Economic Bulletin, Issue 1, ECB.
The analysis assumes a permanent increase by 40% of oil prices. See Le Roux, J., Szörfi, B. and Weißler, M. (2022), “How higher oil prices could affect euro area potential output”, Economic Bulletin, Issue 5, ECB.
These effects on potential output are not additive.
ECB staff analyses find that while participation rates of older workers have not yet returned to their pre-pandemic trend, they are now comfortably above their pre-pandemic level. This stands in stark contrast with the United States, where the participation of older workers has not recovered and may remain permanently below pre-pandemic levels. See Faria-e-Castro, M. (2021), “The COVID Retirement Boom”, Economic Synopses, No 25, Federal Reserve Bank of St. Louis, 15 October and Domash, A. and Summers, L.H. (2022), “How tight are U.S. labor markets?”, NBER Working Paper, No 29739, National Bureau of Economic Research, February.
See Panetta, F. (2022), op.cit.
Aikman, D., Drehmann, M., Juselius M. and Xing, X. (2022), “The scarring effects of deep contractions”, BIS Working Papers, No 1043, 3 October.
See Panetta, F. (2022), op.cit.
Aikman, D, Drehmann, M., Juselius, M. and Xing, X. (2022), op. cit.
Moreover, lower future growth could dampen the natural interest rate, r*.
See Fornaro, L. and Wolf, M. (2021), “The Scars of Supply Shocks”, Barcelona School of Economics Working Paper, April.
This argument does not deny historical examples of central banks over-estimating potential and setting policy inappropriately. There is strong evidence to suggest that part of the reason the Federal Reserve lost control of inflation in the 1970s is that it missed a slowdown in productivity growth and did not realise that the economy was overheating. However, the lessons learned from that period indicate that when uncertainty is high, it is safest not to base policy around large, real-time revisions in potential output or any other unobservable variable. Indeed, those central banks that best navigated the 1970s energy shock – such as the Deutsche Bundesbank – reacted to changes in the output gap rather than estimates of levels. This was a more robust strategy because changes are less subject to mismeasurement and are therefore revised less ex post. Current output gap estimates by major institutions point to the output gap in the euro area becoming more negative in 2023 and only partly recovering in 2024 (see Chart 8). In other words, historical experience supports the case for waiting for stronger evidence on potential output and proceeding prudently. 8). See Orphanides, A. (2003), “The Quest for Prosperity without Inflation”, Journal of Monetary Economics, Vol. 50, No 3, pp. 633-663, Orphanides, A. and Williams, J.C. (2002), “Robust Monetary Policy Rules with Unknown Natural Rates”, Brookings Papers on Economic Activity, Vol. 2002, No 2, and Beyer, A., Gaspar, V., Gerberding, C. and Issing, O. (2009), “Opting out of the Great Inflation: German monetary policy after the break down of Bretton Woods”, Working Paper Series, No 1020, ECB, March.
ECB staff estimates find that the change in market pricing of the short-to-medium term interest rates and in survey evidence of Eurosystem balance sheet expectations between December 2021 and the assumptions implied in the September 2022 ECB staff projections would on average subtract around 1 percentage point from annual real GDP growth each year until 2024 (i.e. annual real GDP growth is estimated to be reduced by around one percentage point on average in 2022, 2023 and 2024). Since the September 2022 ECB staff projections, tightening expectations have further increased, implying a further impact on GDP growth. The estimated impact refers to the average across a set of models used by the ECB for policy simulations, including the NAWM-II model (Coenen, G., Karadi, P., Schmidt, S. and Warne, A. (2018), “The New Area-Wide Model II: an extended version of the ECB’s micro-founded model for forecasting and policy analysis with a financial sector“, Working Paper Series, No 2200, ECB, November (revised December 2019)), the ECB-BASE model (Angelini, E., Bokan, N., Christoffel, K., Ciccarelli, M. and Zimic, S. (2019), “Introducing ECB-BASE: The blueprint of the new ECB semi-structural model for the euro area”, Working Paper Series, No 2315, ECB, September) and the MMR model (Mazelis, F., Motto, R. and Ristiniemi, A. (2022), “Monetary policy strategies in a low interest rate environment for the euro area”, forthcoming).
Európai Központi Bank
Kommunikációs Főigazgatóság
- Sonnemannstrasse 20
- 60314 Frankfurt am Main, Németország
- +49 69 1344 7455
- media@ecb.europa.eu
A sokszorosítás a forrás megnevezésével engedélyezett.
Médiakapcsolatok-
14 November 2022